

Key Insights
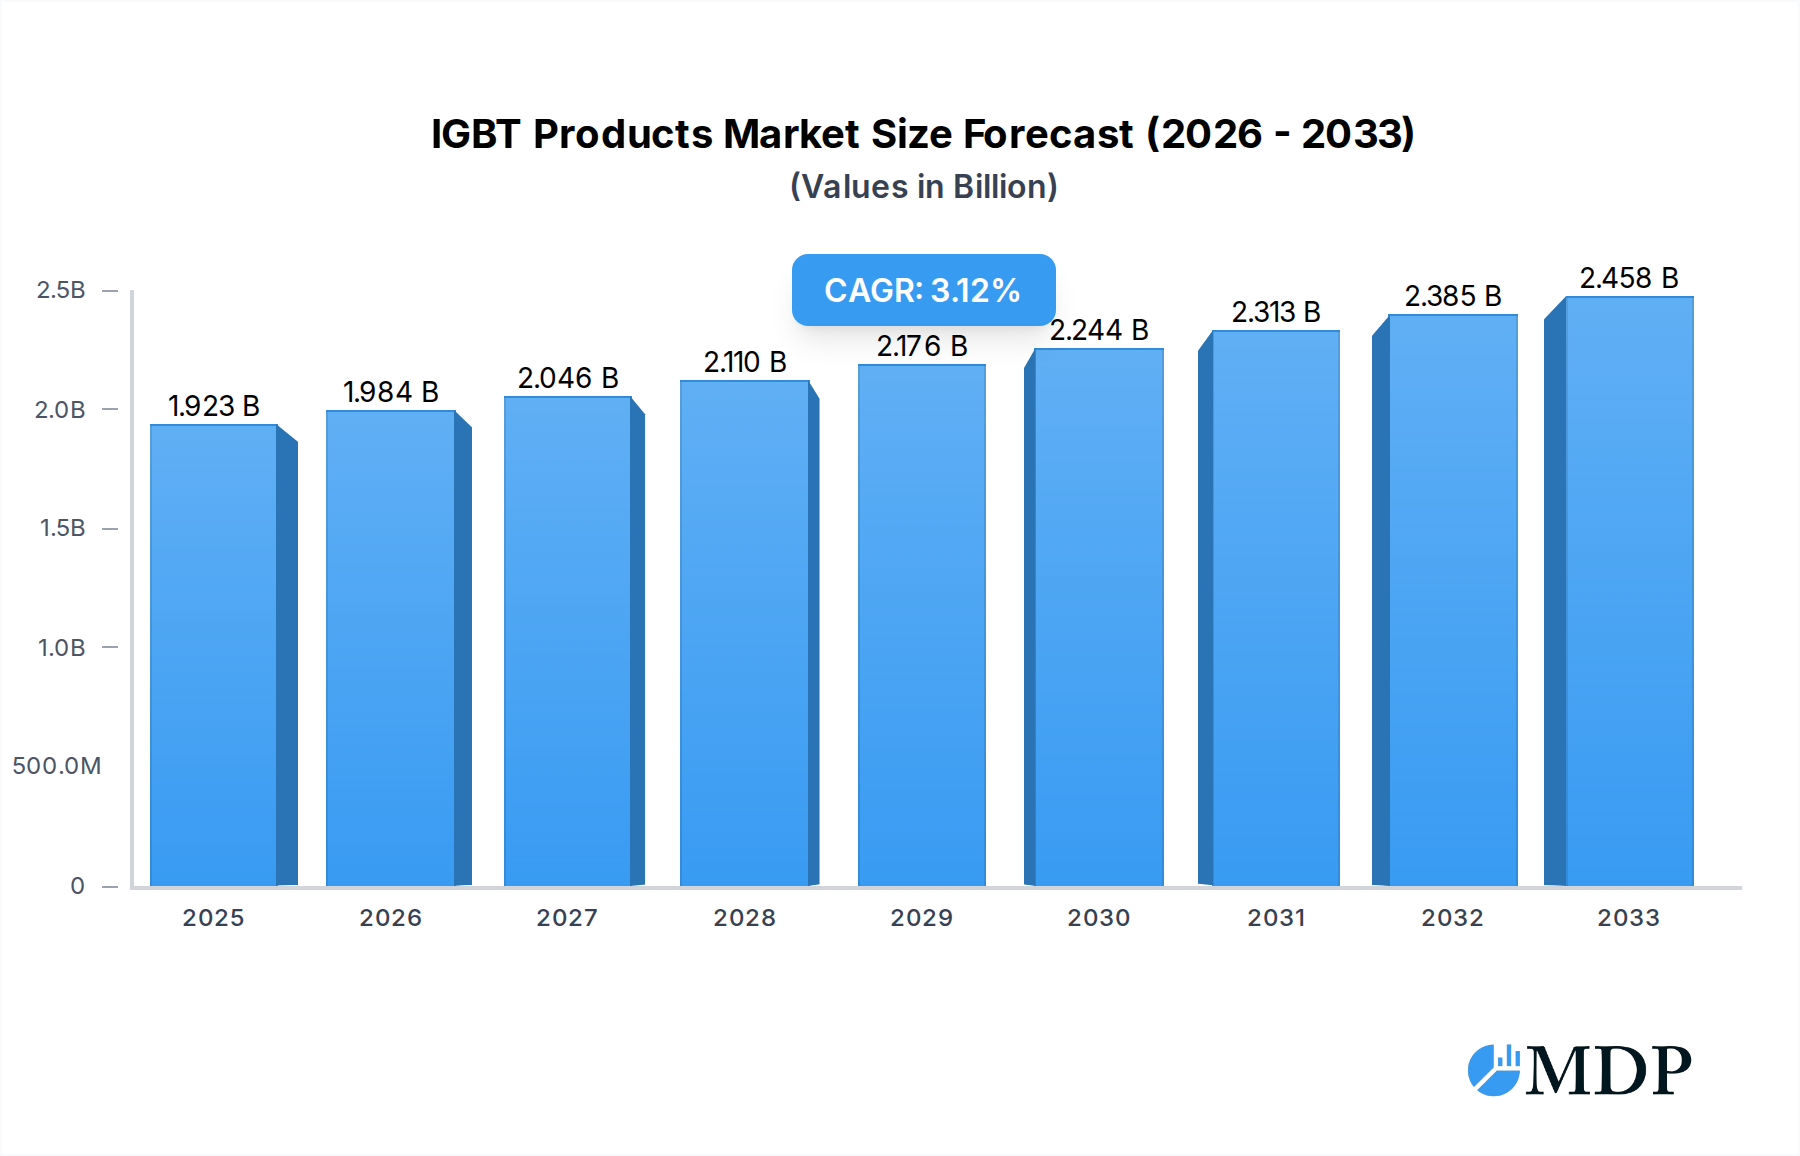
The global Insulated Gate Bipolar Transistor (IGBT) Products market is poised for robust expansion, projected to reach an estimated $1.923 billion in 2025, with a projected Compound Annual Growth Rate (CAGR) of 3.17% throughout the forecast period of 2025-2033. This significant growth is primarily fueled by the escalating demand for power electronics across a multitude of critical industries. The automotive sector, in particular, is a major driver, with the increasing adoption of electric vehicles (EVs) and hybrid electric vehicles (HEVs) necessitating advanced IGBT solutions for power management and motor control. Similarly, the burgeoning renewable energy sector, encompassing solar and wind power generation, relies heavily on IGBTs for efficient energy conversion and grid integration. Furthermore, the continuous evolution and miniaturization of electronic devices, coupled with the expansion of industrial automation and smart grid initiatives, are further bolstering market demand.

IGBT Products Market Size (In Billion)
Key trends shaping the IGBT Products market include the advancement of high-power density and energy-efficient IGBT modules, driven by the need to reduce energy consumption and operational costs. Innovations in materials science, leading to enhanced thermal management and higher voltage and current ratings, are also crucial. The market is segmented into various applications, with Industrial, Aerospace, Electronics, Automotive, and Energy sectors representing the primary consumers. By type, the market is segmented into IGBT Chips, IGBT Single Tubes, and IGBT Modules, with modules expected to dominate due to their integrated functionality and ease of use. Geographically, Asia Pacific, led by China, is anticipated to maintain its leading position due to its strong manufacturing base and rapid industrialization, while North America and Europe are also significant markets driven by technological advancements and sustainability initiatives.
IGBT Products Company Market Share
IGBT Products Market Research Report: Global Analysis, Trends, and Forecasts (2019-2033)
This comprehensive IGBT Products market research report provides an in-depth analysis of the global Insulated Gate Bipolar Transistor (IGBT) market, covering historical data from 2019-2024, a base year of 2025, and a detailed forecast period from 2025-2033. With an estimated market size projected to reach billions, this report is an essential resource for industry stakeholders seeking to understand market dynamics, identify growth opportunities, and navigate the competitive landscape.
IGBT Products Market Dynamics & Concentration
The global IGBT Products market exhibits a moderate to high concentration, with a significant portion of market share held by a few dominant players. Innovation is a key driver, fueled by continuous advancements in power electronics technology aimed at increasing efficiency, power density, and reliability across various applications. Regulatory frameworks, particularly those related to energy efficiency standards and emissions reduction, are increasingly influencing product development and adoption. Product substitutes, while present in some lower-power applications, are largely unable to match the performance and efficiency of IGBTs in high-power scenarios. End-user trends are characterized by a growing demand for high-efficiency power solutions in industrial automation, electric vehicles, renewable energy systems, and consumer electronics. Mergers and acquisitions (M&A) activities are notable, with companies strategically acquiring competitors or complementary technology providers to expand their product portfolios and market reach. For instance, the historical period saw approximately xx M&A deals, indicating a trend towards consolidation and strategic growth. The market share of leading companies like Infineon Technologies and Mitsubishi Electric is estimated to be in the billions, underscoring the concentrated nature of the industry.
IGBT Products Industry Trends & Analysis
The IGBT Products industry is experiencing robust growth, driven by the escalating demand for efficient power management solutions across a multitude of sectors. The Compound Annual Growth Rate (CAGR) for the IGBT Products market is projected to be approximately xx% over the forecast period, reaching billions in market valuation by 2033. This expansion is primarily fueled by the global transition towards renewable energy sources, the rapid adoption of electric vehicles (EVs), and the increasing sophistication of industrial automation. Technological disruptions, such as the development of Wide Bandgap (WBG) semiconductors like Silicon Carbide (SiC) and Gallium Nitride (GaN), are influencing the IGBT market by pushing for higher performance and efficiency benchmarks. However, IGBTs continue to hold a strong position due to their cost-effectiveness and established reliability in many high-voltage and high-current applications. Consumer preferences are shifting towards products that offer enhanced energy savings, longer operational life, and reduced environmental impact, directly benefiting the IGBT market. Competitive dynamics are intense, with major players investing heavily in research and development to introduce next-generation IGBTs with improved thermal management, reduced switching losses, and higher power densities. Market penetration for advanced IGBT solutions is steadily increasing, especially in emerging economies undergoing rapid industrialization and infrastructure development. The global market penetration is estimated to be xx% in the base year.
Leading Markets & Segments in IGBT Products
The Industrial segment is currently the dominant market for IGBT products, with significant contributions from countries like China, Germany, and the United States. This dominance is attributed to the widespread adoption of IGBTs in industrial drives, power supplies, and motor control applications, essential for modern manufacturing and automation processes. The economic policies promoting industrial growth and infrastructure development in these regions act as key drivers. Furthermore, the Automotive segment is emerging as a significant growth engine, driven by the exponential rise in electric vehicle production. The need for efficient power inverters and converters for EV powertrains is creating substantial demand for IGBT modules.
Key Drivers in the Industrial Segment:
- Increasing adoption of Variable Frequency Drives (VFDs) for energy efficiency in motor control.
- Growth in renewable energy integration, requiring robust power converters.
- Expansion of smart grid technologies demanding reliable power electronics.
Key Drivers in the Automotive Segment:
- Government incentives and regulations promoting EV adoption.
- Advancements in battery technology and charging infrastructure.
- Demand for higher power density and efficiency in EV powertrains.
In terms of product types, IGBT Modules hold the largest market share due to their integrated nature, offering enhanced performance, reliability, and ease of use in complex power electronic systems. IGBT Chips cater to specialized applications where custom solutions are required, while IGBT Single Tubes are utilized in less demanding applications or as components within modules. The Energy segment, encompassing renewable energy generation (solar, wind) and power transmission and distribution, is another critical area exhibiting substantial growth. The ongoing global shift towards sustainable energy sources necessitates high-performance power conversion and control systems, where IGBTs play a crucial role. The market for IGBTs in the Energy sector is projected to reach billions by 2033.
IGBT Products Product Developments
Product innovations in the IGBT sector are focused on enhancing power density, improving thermal management, and increasing energy efficiency. Companies are actively developing advanced IGBT chips and modules that can handle higher voltages and currents with reduced losses, leading to smaller and more efficient power electronic systems. For example, the development of trench field-stop IGBT technology has significantly improved switching speed and reduced conduction losses. The competitive advantage of these new products lies in their ability to meet the stringent performance requirements of evolving applications like electric vehicles, high-speed trains, and advanced industrial drives, contributing to a more sustainable and technologically advanced future.
Key Drivers of IGBT Products Growth
The growth of the IGBT Products market is propelled by several key factors. Technological advancements are paramount, with ongoing research into new materials and device architectures enabling higher performance and efficiency. The global push for energy efficiency and sustainability is a significant economic driver, as IGBTs are critical components in systems designed to reduce energy consumption and carbon emissions. Furthermore, supportive government regulations and incentives, particularly in the renewable energy and automotive sectors, are accelerating the adoption of IGBT-based solutions. The increasing electrification of various industries, from transportation to manufacturing, also plays a crucial role.
Challenges in the IGBT Products Market
Despite its growth, the IGBT Products market faces several challenges. Intense competition from alternative technologies, such as Silicon Carbide (SiC) and Gallium Nitride (GaN) devices, poses a threat in certain high-performance applications, demanding continuous innovation from IGBT manufacturers. Supply chain disruptions and raw material price volatility, exacerbated by geopolitical factors, can impact production costs and lead times. Stringent regulatory hurdles related to product safety and environmental standards in different regions can also present barriers to market entry and expansion. The cost of advanced IGBT technology can also be a restraint for some price-sensitive applications.
Emerging Opportunities in IGBT Products
Several catalysts are driving long-term growth opportunities in the IGBT Products market. The accelerating transition to renewable energy sources worldwide, including solar and wind power, creates a sustained demand for high-capacity IGBT modules for inverters and grid connection systems. The burgeoning electric vehicle market continues to be a major opportunity, with ongoing advancements in battery technology and charging infrastructure fueling the need for efficient power electronics. Furthermore, strategic partnerships and collaborations between IGBT manufacturers, system integrators, and end-users can unlock new application areas and accelerate product development. Investments in smart grid technologies and industrial automation further enhance the market's growth potential.
Leading Players in the IGBT Products Sector
- Infineon Technologies
- Mitsubishi Electric
- Fuji Electric
- Semikron Danfoss
- Argussoft
- Todomicro
- Cgocmall
- Zuccato Energia
- Lic Engineering
- Amcoza
- Hitachi
- Onsemi
- ABB
- IXYS Corporation
- Starpower Semiconductor
- CRRC
- Vishay
- Macmic Science and Technology
- Zhuzhou CRRC Times Electric
- Sino-Microelectronics
- BYD Semiconductor
- Xi'an Weiguang Science&Technology
- Weike Electronic Modules (Shenzhen)
- Nanjing Silvermicro Electronics
- Bomin Electronics
Key Milestones in IGBT Products Industry
- 2019: Launch of new generation of high-efficiency IGBT modules for renewable energy applications.
- 2020: Increased investment in R&D for Wide Bandgap (WBG) semiconductor alternatives.
- 2021: Significant surge in demand for IGBTs driven by EV market growth and global energy initiatives.
- 2022: Strategic M&A activities aimed at consolidating market position and expanding product portfolios.
- 2023: Introduction of advanced packaging technologies for improved thermal performance in IGBT modules.
- 2024: Growing focus on cost optimization and supply chain resilience for IGBT components.
- 2025 (Estimated): Expected market valuation to reach billions, driven by continued electrification and sustainability trends.
- 2026-2033 (Forecast): Continued market expansion driven by evolving industrial needs and technological advancements.
Strategic Outlook for IGBT Products Market
The strategic outlook for the IGBT Products market remains highly positive, fueled by ongoing global trends towards electrification, renewable energy adoption, and industrial automation. Growth accelerators include continuous innovation in device technology, leading to higher efficiency and power density, and increasing demand from emerging markets undergoing rapid industrialization. Strategic opportunities lie in expanding product offerings for electric mobility, developing advanced solutions for smart grids and energy storage systems, and forging stronger partnerships across the value chain. The market is poised for sustained growth, with significant potential for companies that can adapt to technological shifts and capitalize on the global demand for high-performance power electronics.
IGBT Products Segmentation
-
1. Application
- 1.1. Industrial
- 1.2. Aerospace
- 1.3. Electronics
- 1.4. Automotive
- 1.5. Energy
- 1.6. Others
-
2. Types
- 2.1. IGBT Chip
- 2.2. IGBT Single Tube
- 2.3. IGBT Module
IGBT Products Segmentation By Geography
-
1. North America
- 1.1. United States
- 1.2. Canada
- 1.3. Mexico
-
2. South America
- 2.1. Brazil
- 2.2. Argentina
- 2.3. Rest of South America
-
3. Europe
- 3.1. United Kingdom
- 3.2. Germany
- 3.3. France
- 3.4. Italy
- 3.5. Spain
- 3.6. Russia
- 3.7. Benelux
- 3.8. Nordics
- 3.9. Rest of Europe
-
4. Middle East & Africa
- 4.1. Turkey
- 4.2. Israel
- 4.3. GCC
- 4.4. North Africa
- 4.5. South Africa
- 4.6. Rest of Middle East & Africa
-
5. Asia Pacific
- 5.1. China
- 5.2. India
- 5.3. Japan
- 5.4. South Korea
- 5.5. ASEAN
- 5.6. Oceania
- 5.7. Rest of Asia Pacific
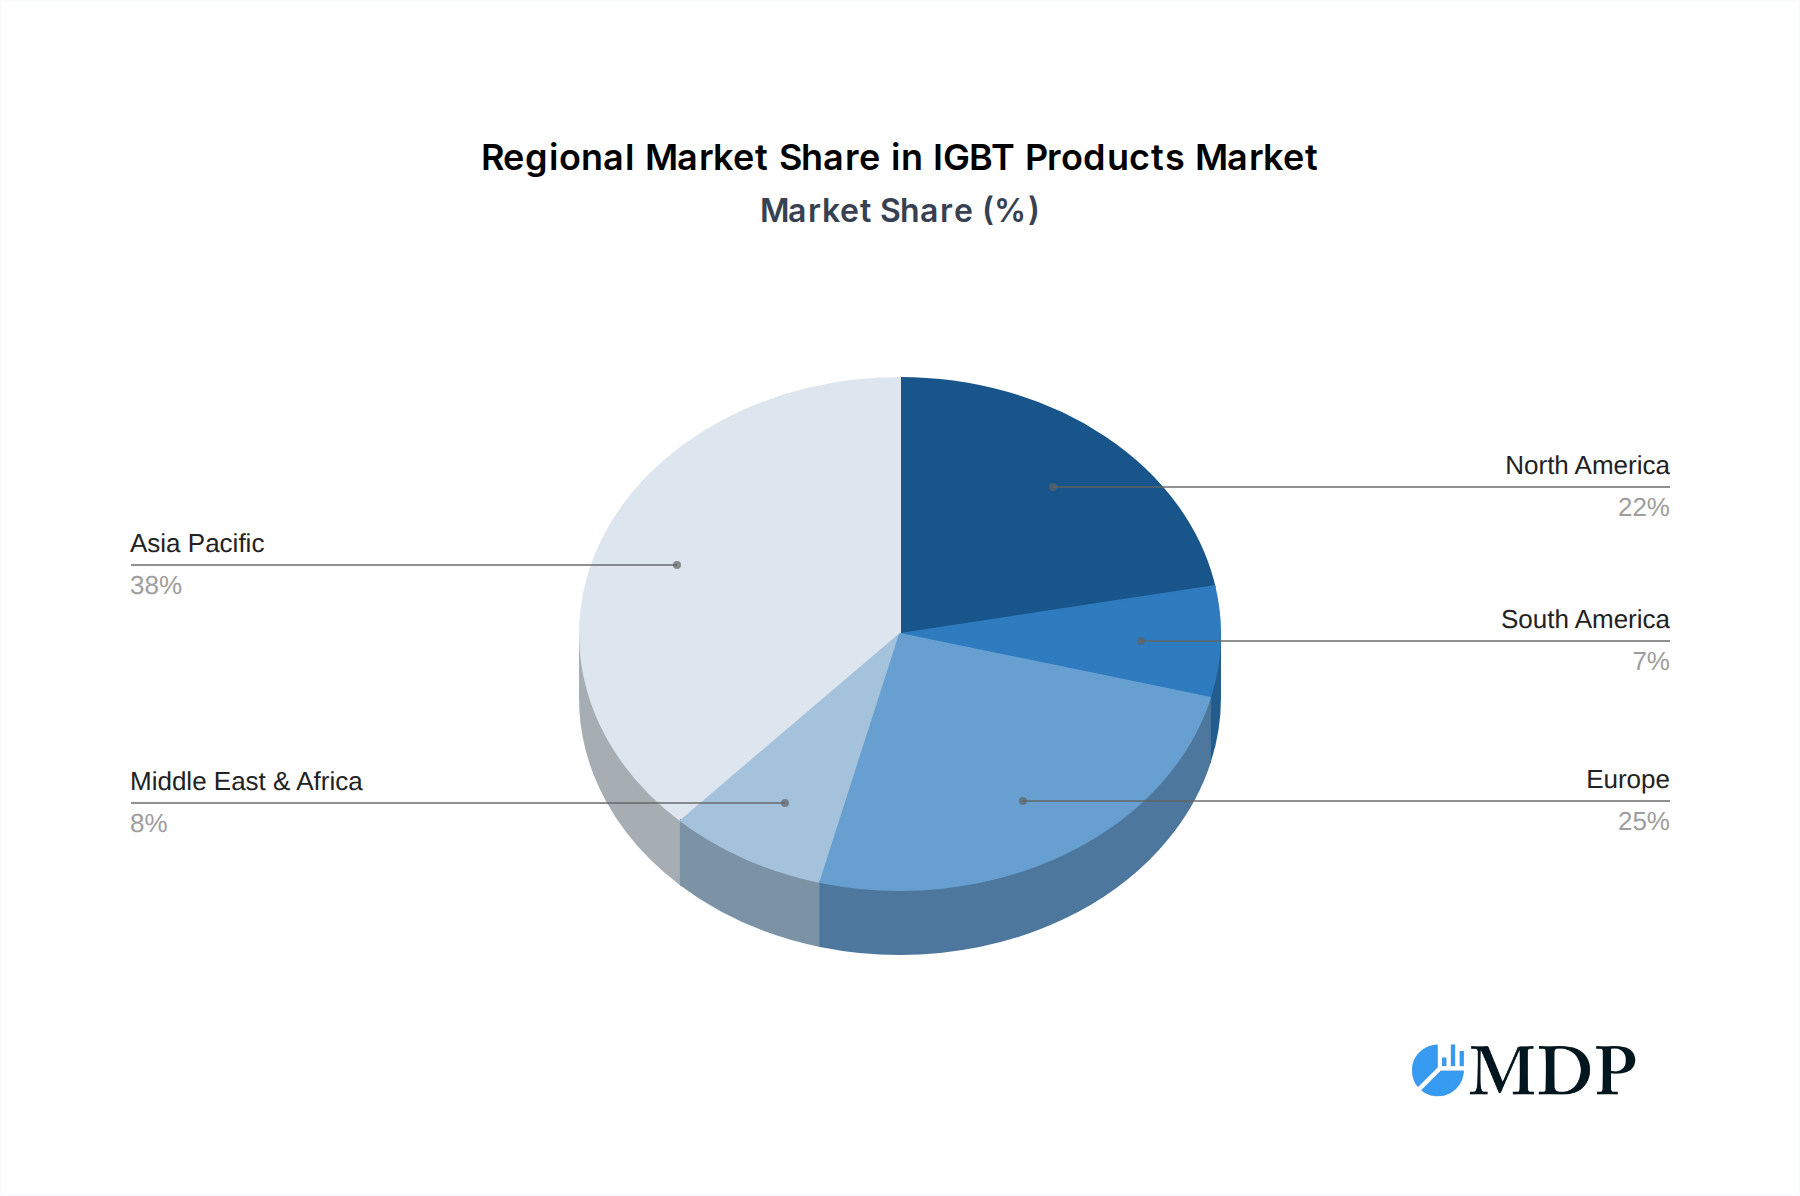
IGBT Products Regional Market Share
Geographic Coverage of IGBT Products
IGBT Products REPORT HIGHLIGHTS
| Aspects | Details |
|---|---|
| Study Period | 2020-2034 |
| Base Year | 2025 |
| Estimated Year | 2026 |
| Forecast Period | 2026-2034 |
| Historical Period | 2020-2025 |
| Growth Rate | CAGR of 3.17% from 2020-2034 |
| Segmentation |
|
Table of Contents
- 1. Introduction
- 1.1. Research Scope
- 1.2. Market Segmentation
- 1.3. Research Methodology
- 1.4. Definitions and Assumptions
- 2. Executive Summary
- 2.1. Introduction
- 3. Market Dynamics
- 3.1. Introduction
- 3.2. Market Drivers
- 3.3. Market Restrains
- 3.4. Market Trends
- 4. Market Factor Analysis
- 4.1. Porters Five Forces
- 4.2. Supply/Value Chain
- 4.3. PESTEL analysis
- 4.4. Market Entropy
- 4.5. Patent/Trademark Analysis
- 5. Global IGBT Products Analysis, Insights and Forecast, 2020-2032
- 5.1. Market Analysis, Insights and Forecast - by Application
- 5.1.1. Industrial
- 5.1.2. Aerospace
- 5.1.3. Electronics
- 5.1.4. Automotive
- 5.1.5. Energy
- 5.1.6. Others
- 5.2. Market Analysis, Insights and Forecast - by Types
- 5.2.1. IGBT Chip
- 5.2.2. IGBT Single Tube
- 5.2.3. IGBT Module
- 5.3. Market Analysis, Insights and Forecast - by Region
- 5.3.1. North America
- 5.3.2. South America
- 5.3.3. Europe
- 5.3.4. Middle East & Africa
- 5.3.5. Asia Pacific
- 5.1. Market Analysis, Insights and Forecast - by Application
- 6. North America IGBT Products Analysis, Insights and Forecast, 2020-2032
- 6.1. Market Analysis, Insights and Forecast - by Application
- 6.1.1. Industrial
- 6.1.2. Aerospace
- 6.1.3. Electronics
- 6.1.4. Automotive
- 6.1.5. Energy
- 6.1.6. Others
- 6.2. Market Analysis, Insights and Forecast - by Types
- 6.2.1. IGBT Chip
- 6.2.2. IGBT Single Tube
- 6.2.3. IGBT Module
- 6.1. Market Analysis, Insights and Forecast - by Application
- 7. South America IGBT Products Analysis, Insights and Forecast, 2020-2032
- 7.1. Market Analysis, Insights and Forecast - by Application
- 7.1.1. Industrial
- 7.1.2. Aerospace
- 7.1.3. Electronics
- 7.1.4. Automotive
- 7.1.5. Energy
- 7.1.6. Others
- 7.2. Market Analysis, Insights and Forecast - by Types
- 7.2.1. IGBT Chip
- 7.2.2. IGBT Single Tube
- 7.2.3. IGBT Module
- 7.1. Market Analysis, Insights and Forecast - by Application
- 8. Europe IGBT Products Analysis, Insights and Forecast, 2020-2032
- 8.1. Market Analysis, Insights and Forecast - by Application
- 8.1.1. Industrial
- 8.1.2. Aerospace
- 8.1.3. Electronics
- 8.1.4. Automotive
- 8.1.5. Energy
- 8.1.6. Others
- 8.2. Market Analysis, Insights and Forecast - by Types
- 8.2.1. IGBT Chip
- 8.2.2. IGBT Single Tube
- 8.2.3. IGBT Module
- 8.1. Market Analysis, Insights and Forecast - by Application
- 9. Middle East & Africa IGBT Products Analysis, Insights and Forecast, 2020-2032
- 9.1. Market Analysis, Insights and Forecast - by Application
- 9.1.1. Industrial
- 9.1.2. Aerospace
- 9.1.3. Electronics
- 9.1.4. Automotive
- 9.1.5. Energy
- 9.1.6. Others
- 9.2. Market Analysis, Insights and Forecast - by Types
- 9.2.1. IGBT Chip
- 9.2.2. IGBT Single Tube
- 9.2.3. IGBT Module
- 9.1. Market Analysis, Insights and Forecast - by Application
- 10. Asia Pacific IGBT Products Analysis, Insights and Forecast, 2020-2032
- 10.1. Market Analysis, Insights and Forecast - by Application
- 10.1.1. Industrial
- 10.1.2. Aerospace
- 10.1.3. Electronics
- 10.1.4. Automotive
- 10.1.5. Energy
- 10.1.6. Others
- 10.2. Market Analysis, Insights and Forecast - by Types
- 10.2.1. IGBT Chip
- 10.2.2. IGBT Single Tube
- 10.2.3. IGBT Module
- 10.1. Market Analysis, Insights and Forecast - by Application
- 11. Competitive Analysis
- 11.1. Global Market Share Analysis 2025
- 11.2. Company Profiles
- 11.2.1 Infineon Technologies
- 11.2.1.1. Overview
- 11.2.1.2. Products
- 11.2.1.3. SWOT Analysis
- 11.2.1.4. Recent Developments
- 11.2.1.5. Financials (Based on Availability)
- 11.2.2 Mitsubishi Electric
- 11.2.2.1. Overview
- 11.2.2.2. Products
- 11.2.2.3. SWOT Analysis
- 11.2.2.4. Recent Developments
- 11.2.2.5. Financials (Based on Availability)
- 11.2.3 Fuji Electric
- 11.2.3.1. Overview
- 11.2.3.2. Products
- 11.2.3.3. SWOT Analysis
- 11.2.3.4. Recent Developments
- 11.2.3.5. Financials (Based on Availability)
- 11.2.4 Semikron Danfoss
- 11.2.4.1. Overview
- 11.2.4.2. Products
- 11.2.4.3. SWOT Analysis
- 11.2.4.4. Recent Developments
- 11.2.4.5. Financials (Based on Availability)
- 11.2.5 Argussoft
- 11.2.5.1. Overview
- 11.2.5.2. Products
- 11.2.5.3. SWOT Analysis
- 11.2.5.4. Recent Developments
- 11.2.5.5. Financials (Based on Availability)
- 11.2.6 Todomicro
- 11.2.6.1. Overview
- 11.2.6.2. Products
- 11.2.6.3. SWOT Analysis
- 11.2.6.4. Recent Developments
- 11.2.6.5. Financials (Based on Availability)
- 11.2.7 Cgocmall
- 11.2.7.1. Overview
- 11.2.7.2. Products
- 11.2.7.3. SWOT Analysis
- 11.2.7.4. Recent Developments
- 11.2.7.5. Financials (Based on Availability)
- 11.2.8 Zuccato Energia
- 11.2.8.1. Overview
- 11.2.8.2. Products
- 11.2.8.3. SWOT Analysis
- 11.2.8.4. Recent Developments
- 11.2.8.5. Financials (Based on Availability)
- 11.2.9 Lic Engineering
- 11.2.9.1. Overview
- 11.2.9.2. Products
- 11.2.9.3. SWOT Analysis
- 11.2.9.4. Recent Developments
- 11.2.9.5. Financials (Based on Availability)
- 11.2.10 Amcoza
- 11.2.10.1. Overview
- 11.2.10.2. Products
- 11.2.10.3. SWOT Analysis
- 11.2.10.4. Recent Developments
- 11.2.10.5. Financials (Based on Availability)
- 11.2.11 Hitachi
- 11.2.11.1. Overview
- 11.2.11.2. Products
- 11.2.11.3. SWOT Analysis
- 11.2.11.4. Recent Developments
- 11.2.11.5. Financials (Based on Availability)
- 11.2.12 Onsemi
- 11.2.12.1. Overview
- 11.2.12.2. Products
- 11.2.12.3. SWOT Analysis
- 11.2.12.4. Recent Developments
- 11.2.12.5. Financials (Based on Availability)
- 11.2.13 ABB
- 11.2.13.1. Overview
- 11.2.13.2. Products
- 11.2.13.3. SWOT Analysis
- 11.2.13.4. Recent Developments
- 11.2.13.5. Financials (Based on Availability)
- 11.2.14 IXYS Corporation
- 11.2.14.1. Overview
- 11.2.14.2. Products
- 11.2.14.3. SWOT Analysis
- 11.2.14.4. Recent Developments
- 11.2.14.5. Financials (Based on Availability)
- 11.2.15 Starpower Semiconductor
- 11.2.15.1. Overview
- 11.2.15.2. Products
- 11.2.15.3. SWOT Analysis
- 11.2.15.4. Recent Developments
- 11.2.15.5. Financials (Based on Availability)
- 11.2.16 CRRC
- 11.2.16.1. Overview
- 11.2.16.2. Products
- 11.2.16.3. SWOT Analysis
- 11.2.16.4. Recent Developments
- 11.2.16.5. Financials (Based on Availability)
- 11.2.17 Vishay
- 11.2.17.1. Overview
- 11.2.17.2. Products
- 11.2.17.3. SWOT Analysis
- 11.2.17.4. Recent Developments
- 11.2.17.5. Financials (Based on Availability)
- 11.2.18 Macmic Science and Technology
- 11.2.18.1. Overview
- 11.2.18.2. Products
- 11.2.18.3. SWOT Analysis
- 11.2.18.4. Recent Developments
- 11.2.18.5. Financials (Based on Availability)
- 11.2.19 Zhuzhou CRRC Times Electric
- 11.2.19.1. Overview
- 11.2.19.2. Products
- 11.2.19.3. SWOT Analysis
- 11.2.19.4. Recent Developments
- 11.2.19.5. Financials (Based on Availability)
- 11.2.20 Sino-Microelectronics
- 11.2.20.1. Overview
- 11.2.20.2. Products
- 11.2.20.3. SWOT Analysis
- 11.2.20.4. Recent Developments
- 11.2.20.5. Financials (Based on Availability)
- 11.2.21 BYD Semiconductor
- 11.2.21.1. Overview
- 11.2.21.2. Products
- 11.2.21.3. SWOT Analysis
- 11.2.21.4. Recent Developments
- 11.2.21.5. Financials (Based on Availability)
- 11.2.22 Xi'an Weiguang Science&Technology
- 11.2.22.1. Overview
- 11.2.22.2. Products
- 11.2.22.3. SWOT Analysis
- 11.2.22.4. Recent Developments
- 11.2.22.5. Financials (Based on Availability)
- 11.2.23 Weike Electronic Modules (Shenzhen)
- 11.2.23.1. Overview
- 11.2.23.2. Products
- 11.2.23.3. SWOT Analysis
- 11.2.23.4. Recent Developments
- 11.2.23.5. Financials (Based on Availability)
- 11.2.24 Nanjing Silvermicro Electronics
- 11.2.24.1. Overview
- 11.2.24.2. Products
- 11.2.24.3. SWOT Analysis
- 11.2.24.4. Recent Developments
- 11.2.24.5. Financials (Based on Availability)
- 11.2.25 Bomin Electronics
- 11.2.25.1. Overview
- 11.2.25.2. Products
- 11.2.25.3. SWOT Analysis
- 11.2.25.4. Recent Developments
- 11.2.25.5. Financials (Based on Availability)
- 11.2.1 Infineon Technologies
List of Figures
- Figure 1: Global IGBT Products Revenue Breakdown (billion, %) by Region 2025 & 2033
- Figure 2: North America IGBT Products Revenue (billion), by Application 2025 & 2033
- Figure 3: North America IGBT Products Revenue Share (%), by Application 2025 & 2033
- Figure 4: North America IGBT Products Revenue (billion), by Types 2025 & 2033
- Figure 5: North America IGBT Products Revenue Share (%), by Types 2025 & 2033
- Figure 6: North America IGBT Products Revenue (billion), by Country 2025 & 2033
- Figure 7: North America IGBT Products Revenue Share (%), by Country 2025 & 2033
- Figure 8: South America IGBT Products Revenue (billion), by Application 2025 & 2033
- Figure 9: South America IGBT Products Revenue Share (%), by Application 2025 & 2033
- Figure 10: South America IGBT Products Revenue (billion), by Types 2025 & 2033
- Figure 11: South America IGBT Products Revenue Share (%), by Types 2025 & 2033
- Figure 12: South America IGBT Products Revenue (billion), by Country 2025 & 2033
- Figure 13: South America IGBT Products Revenue Share (%), by Country 2025 & 2033
- Figure 14: Europe IGBT Products Revenue (billion), by Application 2025 & 2033
- Figure 15: Europe IGBT Products Revenue Share (%), by Application 2025 & 2033
- Figure 16: Europe IGBT Products Revenue (billion), by Types 2025 & 2033
- Figure 17: Europe IGBT Products Revenue Share (%), by Types 2025 & 2033
- Figure 18: Europe IGBT Products Revenue (billion), by Country 2025 & 2033
- Figure 19: Europe IGBT Products Revenue Share (%), by Country 2025 & 2033
- Figure 20: Middle East & Africa IGBT Products Revenue (billion), by Application 2025 & 2033
- Figure 21: Middle East & Africa IGBT Products Revenue Share (%), by Application 2025 & 2033
- Figure 22: Middle East & Africa IGBT Products Revenue (billion), by Types 2025 & 2033
- Figure 23: Middle East & Africa IGBT Products Revenue Share (%), by Types 2025 & 2033
- Figure 24: Middle East & Africa IGBT Products Revenue (billion), by Country 2025 & 2033
- Figure 25: Middle East & Africa IGBT Products Revenue Share (%), by Country 2025 & 2033
- Figure 26: Asia Pacific IGBT Products Revenue (billion), by Application 2025 & 2033
- Figure 27: Asia Pacific IGBT Products Revenue Share (%), by Application 2025 & 2033
- Figure 28: Asia Pacific IGBT Products Revenue (billion), by Types 2025 & 2033
- Figure 29: Asia Pacific IGBT Products Revenue Share (%), by Types 2025 & 2033
- Figure 30: Asia Pacific IGBT Products Revenue (billion), by Country 2025 & 2033
- Figure 31: Asia Pacific IGBT Products Revenue Share (%), by Country 2025 & 2033
List of Tables
- Table 1: Global IGBT Products Revenue billion Forecast, by Application 2020 & 2033
- Table 2: Global IGBT Products Revenue billion Forecast, by Types 2020 & 2033
- Table 3: Global IGBT Products Revenue billion Forecast, by Region 2020 & 2033
- Table 4: Global IGBT Products Revenue billion Forecast, by Application 2020 & 2033
- Table 5: Global IGBT Products Revenue billion Forecast, by Types 2020 & 2033
- Table 6: Global IGBT Products Revenue billion Forecast, by Country 2020 & 2033
- Table 7: United States IGBT Products Revenue (billion) Forecast, by Application 2020 & 2033
- Table 8: Canada IGBT Products Revenue (billion) Forecast, by Application 2020 & 2033
- Table 9: Mexico IGBT Products Revenue (billion) Forecast, by Application 2020 & 2033
- Table 10: Global IGBT Products Revenue billion Forecast, by Application 2020 & 2033
- Table 11: Global IGBT Products Revenue billion Forecast, by Types 2020 & 2033
- Table 12: Global IGBT Products Revenue billion Forecast, by Country 2020 & 2033
- Table 13: Brazil IGBT Products Revenue (billion) Forecast, by Application 2020 & 2033
- Table 14: Argentina IGBT Products Revenue (billion) Forecast, by Application 2020 & 2033
- Table 15: Rest of South America IGBT Products Revenue (billion) Forecast, by Application 2020 & 2033
- Table 16: Global IGBT Products Revenue billion Forecast, by Application 2020 & 2033
- Table 17: Global IGBT Products Revenue billion Forecast, by Types 2020 & 2033
- Table 18: Global IGBT Products Revenue billion Forecast, by Country 2020 & 2033
- Table 19: United Kingdom IGBT Products Revenue (billion) Forecast, by Application 2020 & 2033
- Table 20: Germany IGBT Products Revenue (billion) Forecast, by Application 2020 & 2033
- Table 21: France IGBT Products Revenue (billion) Forecast, by Application 2020 & 2033
- Table 22: Italy IGBT Products Revenue (billion) Forecast, by Application 2020 & 2033
- Table 23: Spain IGBT Products Revenue (billion) Forecast, by Application 2020 & 2033
- Table 24: Russia IGBT Products Revenue (billion) Forecast, by Application 2020 & 2033
- Table 25: Benelux IGBT Products Revenue (billion) Forecast, by Application 2020 & 2033
- Table 26: Nordics IGBT Products Revenue (billion) Forecast, by Application 2020 & 2033
- Table 27: Rest of Europe IGBT Products Revenue (billion) Forecast, by Application 2020 & 2033
- Table 28: Global IGBT Products Revenue billion Forecast, by Application 2020 & 2033
- Table 29: Global IGBT Products Revenue billion Forecast, by Types 2020 & 2033
- Table 30: Global IGBT Products Revenue billion Forecast, by Country 2020 & 2033
- Table 31: Turkey IGBT Products Revenue (billion) Forecast, by Application 2020 & 2033
- Table 32: Israel IGBT Products Revenue (billion) Forecast, by Application 2020 & 2033
- Table 33: GCC IGBT Products Revenue (billion) Forecast, by Application 2020 & 2033
- Table 34: North Africa IGBT Products Revenue (billion) Forecast, by Application 2020 & 2033
- Table 35: South Africa IGBT Products Revenue (billion) Forecast, by Application 2020 & 2033
- Table 36: Rest of Middle East & Africa IGBT Products Revenue (billion) Forecast, by Application 2020 & 2033
- Table 37: Global IGBT Products Revenue billion Forecast, by Application 2020 & 2033
- Table 38: Global IGBT Products Revenue billion Forecast, by Types 2020 & 2033
- Table 39: Global IGBT Products Revenue billion Forecast, by Country 2020 & 2033
- Table 40: China IGBT Products Revenue (billion) Forecast, by Application 2020 & 2033
- Table 41: India IGBT Products Revenue (billion) Forecast, by Application 2020 & 2033
- Table 42: Japan IGBT Products Revenue (billion) Forecast, by Application 2020 & 2033
- Table 43: South Korea IGBT Products Revenue (billion) Forecast, by Application 2020 & 2033
- Table 44: ASEAN IGBT Products Revenue (billion) Forecast, by Application 2020 & 2033
- Table 45: Oceania IGBT Products Revenue (billion) Forecast, by Application 2020 & 2033
- Table 46: Rest of Asia Pacific IGBT Products Revenue (billion) Forecast, by Application 2020 & 2033
Frequently Asked Questions
1. What is the projected Compound Annual Growth Rate (CAGR) of the IGBT Products?
The projected CAGR is approximately 3.17%.
2. Which companies are prominent players in the IGBT Products?
Key companies in the market include Infineon Technologies, Mitsubishi Electric, Fuji Electric, Semikron Danfoss, Argussoft, Todomicro, Cgocmall, Zuccato Energia, Lic Engineering, Amcoza, Hitachi, Onsemi, ABB, IXYS Corporation, Starpower Semiconductor, CRRC, Vishay, Macmic Science and Technology, Zhuzhou CRRC Times Electric, Sino-Microelectronics, BYD Semiconductor, Xi'an Weiguang Science&Technology, Weike Electronic Modules (Shenzhen), Nanjing Silvermicro Electronics, Bomin Electronics.
3. What are the main segments of the IGBT Products?
The market segments include Application, Types.
4. Can you provide details about the market size?
The market size is estimated to be USD 1.923 billion as of 2022.
5. What are some drivers contributing to market growth?
N/A
6. What are the notable trends driving market growth?
N/A
7. Are there any restraints impacting market growth?
N/A
8. Can you provide examples of recent developments in the market?
N/A
9. What pricing options are available for accessing the report?
Pricing options include single-user, multi-user, and enterprise licenses priced at USD 4350.00, USD 6525.00, and USD 8700.00 respectively.
10. Is the market size provided in terms of value or volume?
The market size is provided in terms of value, measured in billion.
11. Are there any specific market keywords associated with the report?
Yes, the market keyword associated with the report is "IGBT Products," which aids in identifying and referencing the specific market segment covered.
12. How do I determine which pricing option suits my needs best?
The pricing options vary based on user requirements and access needs. Individual users may opt for single-user licenses, while businesses requiring broader access may choose multi-user or enterprise licenses for cost-effective access to the report.
13. Are there any additional resources or data provided in the IGBT Products report?
While the report offers comprehensive insights, it's advisable to review the specific contents or supplementary materials provided to ascertain if additional resources or data are available.
14. How can I stay updated on further developments or reports in the IGBT Products?
To stay informed about further developments, trends, and reports in the IGBT Products, consider subscribing to industry newsletters, following relevant companies and organizations, or regularly checking reputable industry news sources and publications.
Methodology
Step 1 - Identification of Relevant Samples Size from Population Database


Step 2 - Approaches for Defining Global Market Size (Value, Volume* & Price*)

Note*: In applicable scenarios
Step 3 - Data Sources
Primary Research
- Web Analytics
- Survey Reports
- Research Institute
- Latest Research Reports
- Opinion Leaders
Secondary Research
- Annual Reports
- White Paper
- Latest Press Release
- Industry Association
- Paid Database
- Investor Presentations

Step 4 - Data Triangulation
Involves using different sources of information in order to increase the validity of a study
These sources are likely to be stakeholders in a program - participants, other researchers, program staff, other community members, and so on.
Then we put all data in single framework & apply various statistical tools to find out the dynamic on the market.
During the analysis stage, feedback from the stakeholder groups would be compared to determine areas of agreement as well as areas of divergence