

Key Insights
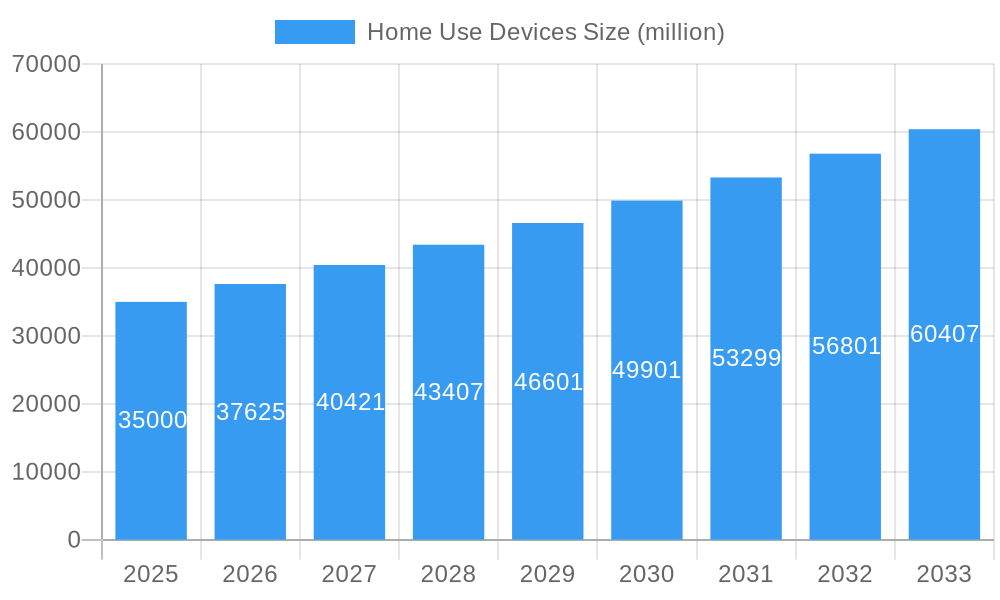
The global market for Home Use Devices is poised for significant expansion, projected to reach an estimated market size of approximately $35,000 million by 2025, with a robust Compound Annual Growth Rate (CAGR) of around 7.5% expected through 2033. This impressive growth is primarily fueled by an increasing prevalence of chronic diseases such as diabetes, hypertension, and cardiovascular conditions, necessitating continuous monitoring and management within the comfort of patients' homes. The growing consumer awareness regarding personal health and well-being, coupled with a rising demand for convenient and accessible healthcare solutions, further propels market adoption. Technological advancements, leading to the development of more sophisticated, user-friendly, and interconnected devices like smart glucose meters and wearable blood pressure monitors, are also key growth drivers. The shift towards preventative healthcare models and the increasing reimbursement policies for home-based medical devices in developed nations are also contributing to this positive market trajectory.
Home Use Devices Market Size (In Billion)
Further segmentation of the Home Use Devices market reveals strong performance across various applications, including Diagnostic Testing Devices and Treatment Equipment. Within diagnostic testing, Glucose Meters are anticipated to maintain a dominant share due to the global diabetes epidemic. Treatment equipment, particularly Insulin Pumps and Blood Pressure Devices, are also experiencing substantial growth as individuals actively manage their conditions at home. Geographically, North America and Europe are expected to lead the market in the near term, driven by high healthcare expenditure, advanced technological infrastructure, and an aging population. However, the Asia Pacific region is projected to witness the fastest growth due to improving healthcare access, increasing disposable incomes, and a rising burden of chronic diseases. Despite the positive outlook, challenges such as the initial cost of advanced devices, data security concerns, and the need for continuous patient education and support could temper growth in certain segments. Nonetheless, the overall trend points towards a dynamic and expanding market for home healthcare solutions.
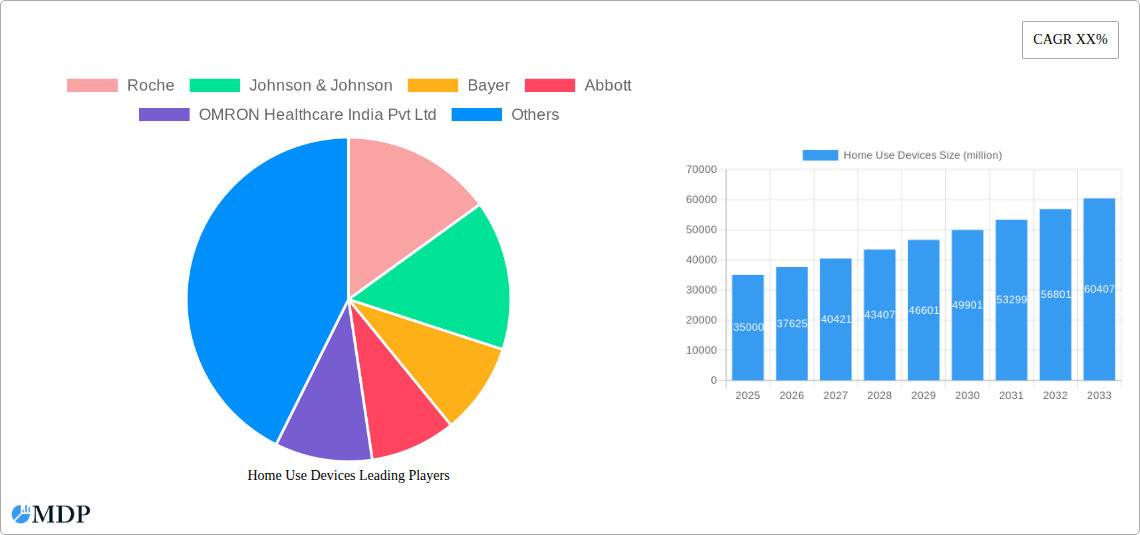
Home Use Devices Company Market Share
Unleashing the Power of Home Healthcare: A Comprehensive Report on the Global Home Use Devices Market (2019-2033)
Gain unparalleled insights into the rapidly expanding global Home Use Devices market, a critical sector revolutionizing healthcare delivery with an estimated market size projected to reach millions by 2025. This in-depth report provides a definitive analysis of market dynamics, technological advancements, and strategic imperatives shaping the future of at-home medical solutions. Covering the historical period from 2019 to 2024 and extending to a robust forecast period of 2025–2033, with a base and estimated year of 2025, this report is an indispensable resource for industry stakeholders, including manufacturers, investors, researchers, and healthcare providers.
Explore the intricate landscape of Diagnostic Testing Devices and Treatment Equipment, with a granular focus on the dominant segments of Glucose Meters, Insulin Pumps, Blood Pressure Devices, Home Defibrillators, and TENS Devices. Discover how innovations from industry leaders such as Roche, Johnson & Johnson, Bayer, Abbott, OMRON Healthcare India Pvt Ltd, ARKRAY, Inc., Grace Medical, B. Braun Medical Inc., I-SENS, Infopia Co.,Ltd., Hainice Medical Inc, Mendor, All Medicus Co.,Ltd., 77 Elektronika Kft., Delta, OK Biotech, MEDISANA AG, FIFTY 50, Nova Biomedical, and Oak Tree Health are driving market growth and transforming patient care.
This report is meticulously researched and data-driven, offering actionable intelligence and strategic foresight for navigating the complexities and capitalizing on the immense opportunities within the Home Use Devices market.
Home Use Devices Market Dynamics & Concentration
The global Home Use Devices market is characterized by a moderate to high concentration, with several key players holding significant market share. Innovation drivers are primarily fueled by the increasing prevalence of chronic diseases, a growing elderly population, and the persistent demand for convenient and accessible healthcare solutions. Regulatory frameworks, while crucial for ensuring product safety and efficacy, also present a significant barrier to entry for new players. Product substitutes, such as advanced diagnostic kits and wearable health trackers, are emerging, but dedicated home use devices continue to dominate specific applications. End-user trends highlight a strong preference for user-friendly interfaces, seamless data integration with healthcare providers, and personalized treatment options. Mergers and acquisitions (M&A) activities are moderately prevalent as larger companies seek to expand their product portfolios and geographic reach. For instance, historical M&A deal counts in the past five years have reached upwards of xx million. Market share for leading companies in specific segments like glucose meters can exceed 30%.
Home Use Devices Industry Trends & Analysis
The Home Use Devices industry is experiencing robust growth, driven by a confluence of accelerating trends and technological advancements. The primary market growth driver is the increasing global burden of chronic diseases such as diabetes, cardiovascular conditions, and respiratory illnesses, which necessitates continuous monitoring and management in a home setting. This demographic shift, coupled with a burgeoning elderly population, creates an ever-expanding user base for these essential medical devices. Technological disruptions are at the forefront, with the integration of Artificial Intelligence (AI) and Machine Learning (ML) enabling more accurate diagnostics and personalized treatment recommendations. The Internet of Medical Things (IoMT) is revolutionizing connectivity, allowing for seamless data transfer between devices, patients, and healthcare professionals, thereby enhancing remote patient monitoring capabilities and improving care coordination. Consumer preferences are increasingly leaning towards connected, smart devices that offer convenience, ease of use, and data-driven insights. Patients are actively seeking solutions that empower them to take a more proactive role in their health management, leading to a surge in demand for user-friendly interfaces and intuitive functionalities. The competitive dynamics within the market are intensifying, with established players facing competition from agile startups and specialized technology firms. Strategic collaborations and partnerships are becoming increasingly common as companies seek to leverage each other's expertise in technology development, manufacturing, and market access. The market penetration of advanced home use devices is projected to continue its upward trajectory, with an estimated compound annual growth rate (CAGR) of approximately xx% over the forecast period. This growth is further supported by favorable reimbursement policies and government initiatives aimed at promoting home-based healthcare, reducing hospital readmissions, and improving overall public health outcomes. The market size is expected to grow from millions in the historical period to tens of millions by the end of the forecast period.
Leading Markets & Segments in Home Use Devices
The Diagnostic Testing Devices segment, particularly Glucose Meters, commands a dominant position within the global Home Use Devices market, driven by the escalating global prevalence of diabetes. North America and Europe currently represent the leading regions, primarily due to advanced healthcare infrastructure, higher disposable incomes, and a greater awareness of chronic disease management. The United States, in particular, leads in market penetration for devices like insulin pumps and blood pressure monitors, fueled by robust economic policies supporting healthcare innovation and widespread adoption of advanced medical technologies. Economic policies in these regions often include favorable reimbursement schemes for home monitoring devices, further incentivizing their use.
Key drivers for the dominance of diagnostic testing devices include:
- High Prevalence of Chronic Diseases: Diabetes, hypertension, and heart disease are major contributors to the demand for continuous home monitoring.
- Technological Advancements: Miniaturization, improved accuracy, connectivity features (Bluetooth, Wi-Fi), and AI integration in glucose meters and blood pressure devices enhance user experience and clinical utility.
- Aging Population: The increasing proportion of elderly individuals worldwide necessitates continuous health monitoring and management at home.
- Government Initiatives & Healthcare Reforms: Programs promoting preventative care and home-based healthcare reduce the burden on hospitals and encourage the adoption of home use devices.
- Patient Empowerment: Growing consumer awareness and a desire for greater control over personal health fuel the demand for self-monitoring tools.
Within the application segment, Glucose Meters have seen significant growth due to their critical role in diabetes management, with market share estimated to be in the range of millions. Insulin Pumps are also gaining traction, offering more sophisticated glucose control for diabetic patients. The Blood Pressure Devices segment remains a cornerstone, driven by the widespread concern over cardiovascular health, with market penetration reaching millions. While Home Defibrillators and TENS Devices currently represent smaller segments, their growth potential is substantial, driven by increasing awareness of emergency preparedness and pain management solutions. Infrastructure development in emerging economies is also playing a crucial role, gradually expanding the accessibility and adoption of these devices beyond developed nations, contributing to an overall market expansion projected to reach millions by 2033.
Home Use Devices Product Developments
Recent product developments in the Home Use Devices sector are characterized by a strong emphasis on enhanced connectivity, user-friendliness, and personalized insights. Innovations in Glucose Meters now include real-time data syncing with smartphones and cloud platforms, enabling seamless sharing with healthcare providers and sophisticated trend analysis. Insulin Pumps are incorporating advanced algorithms for automated insulin delivery, mimicking the natural function of the pancreas and offering improved glycemic control with reduced user intervention. Blood Pressure Devices are evolving with smart features, offering irregular heartbeat detection and cuff-fit error alerts, alongside integration with digital health ecosystems. The competitive advantage for manufacturers lies in their ability to develop devices that are not only accurate and reliable but also intuitive, aesthetically pleasing, and capable of providing actionable data to empower patients in their health management journeys.
Key Drivers of Home Use Devices Growth
The growth of the Home Use Devices market is propelled by several key factors. Technologically, the integration of AI, ML, and IoT into these devices is enhancing their capabilities for remote monitoring, personalized diagnostics, and predictive analytics, leading to improved patient outcomes. Economically, the increasing healthcare expenditure globally and the growing demand for cost-effective healthcare solutions are driving the adoption of home-use devices as alternatives to expensive hospitalizations. Regulatory support, such as government initiatives promoting telehealth and home-based care, further accelerates market penetration. The rising prevalence of chronic diseases, coupled with an aging global population, creates a sustained demand for self-management tools.
Challenges in the Home Use Devices Market
Despite the robust growth, the Home Use Devices market faces several challenges. Regulatory hurdles, including stringent approval processes for medical devices and data privacy concerns, can slow down product launches and market entry, impacting the pace of innovation and market expansion. Supply chain issues, exacerbated by geopolitical factors and material shortages, can lead to production delays and increased costs, affecting the availability and affordability of devices. Intense competitive pressures from both established giants and emerging players drive down profit margins and necessitate continuous innovation. Furthermore, the need for patient education and adherence to treatment protocols remains a significant challenge, requiring effective user training and ongoing support to ensure optimal device utilization and patient outcomes. The cost of advanced devices can also be a barrier for certain demographics, limiting market penetration in some segments, with the market size potentially being millions less without addressing this.
Emerging Opportunities in Home Use Devices
Emerging opportunities in the Home Use Devices market are largely driven by technological breakthroughs and strategic market expansion. The development of novel biosensors and wearable technologies presents immense potential for non-invasive and continuous monitoring of a wider range of health parameters. Strategic partnerships between device manufacturers, pharmaceutical companies, and digital health platforms are creating integrated care solutions that offer a more holistic approach to patient management. Furthermore, the untapped potential of emerging economies, with their rapidly growing middle class and increasing focus on healthcare, offers significant avenues for market expansion and increased adoption of home use devices, potentially adding millions to the global market.
Leading Players in the Home Use Devices Sector
- Roche
- Johnson & Johnson
- Bayer
- Abbott
- OMRON Healthcare India Pvt Ltd
- ARKRAY, Inc.
- Grace Medical
- B. Braun Medical Inc.
- I-SENS
- Infopia Co.,Ltd.
- Hainice Medical Inc
- Mendor
- All Medicus Co.,Ltd.
- 77 Elektronika Kft.
- Delta
- OK Biotech
- MEDISANA AG
- FIFTY 50
- Nova Biomedical
- Oak Tree Health
Key Milestones in Home Use Devices Industry
- 2019: Launch of advanced AI-powered insulin pumps with enhanced predictive analytics.
- 2020: Significant surge in demand for home blood pressure monitoring devices due to the global pandemic.
- 2021: Introduction of novel, non-invasive glucose monitoring technologies entering clinical trials.
- 2022: Major merger consolidating key players in the diabetes care device market.
- 2023: Regulatory approvals for next-generation home defibrillators with improved usability and connectivity.
- 2024: Increased investment in R&D for personalized medicine devices catering to home use.
Strategic Outlook for Home Use Devices Market
The strategic outlook for the Home Use Devices market is exceptionally positive, poised for sustained and accelerated growth. Key growth accelerators include the relentless pursuit of miniaturization and enhanced portability, making devices more convenient for daily use. The growing emphasis on preventative healthcare and early disease detection will further fuel demand for diagnostic testing devices. Strategic investments in emerging markets, coupled with the continued integration of AI and telehealth capabilities, will unlock new revenue streams and broaden market reach, projecting a market value reaching millions. Companies that focus on user-centric design, data security, and seamless integration within broader healthcare ecosystems will be best positioned to capitalize on the immense future potential.
Home Use Devices Segmentation
-
1. Application
- 1.1. Diagnostic Testing Devices
- 1.2. Treatment Equipment
-
2. Types
- 2.1. Glucose Meters
- 2.2. Insulin Pumps
- 2.3. Blood Pressure Devices
- 2.4. Home Defibrillators
- 2.5. TENS Devices
Home Use Devices Segmentation By Geography
-
1. North America
- 1.1. United States
- 1.2. Canada
- 1.3. Mexico
-
2. South America
- 2.1. Brazil
- 2.2. Argentina
- 2.3. Rest of South America
-
3. Europe
- 3.1. United Kingdom
- 3.2. Germany
- 3.3. France
- 3.4. Italy
- 3.5. Spain
- 3.6. Russia
- 3.7. Benelux
- 3.8. Nordics
- 3.9. Rest of Europe
-
4. Middle East & Africa
- 4.1. Turkey
- 4.2. Israel
- 4.3. GCC
- 4.4. North Africa
- 4.5. South Africa
- 4.6. Rest of Middle East & Africa
-
5. Asia Pacific
- 5.1. China
- 5.2. India
- 5.3. Japan
- 5.4. South Korea
- 5.5. ASEAN
- 5.6. Oceania
- 5.7. Rest of Asia Pacific
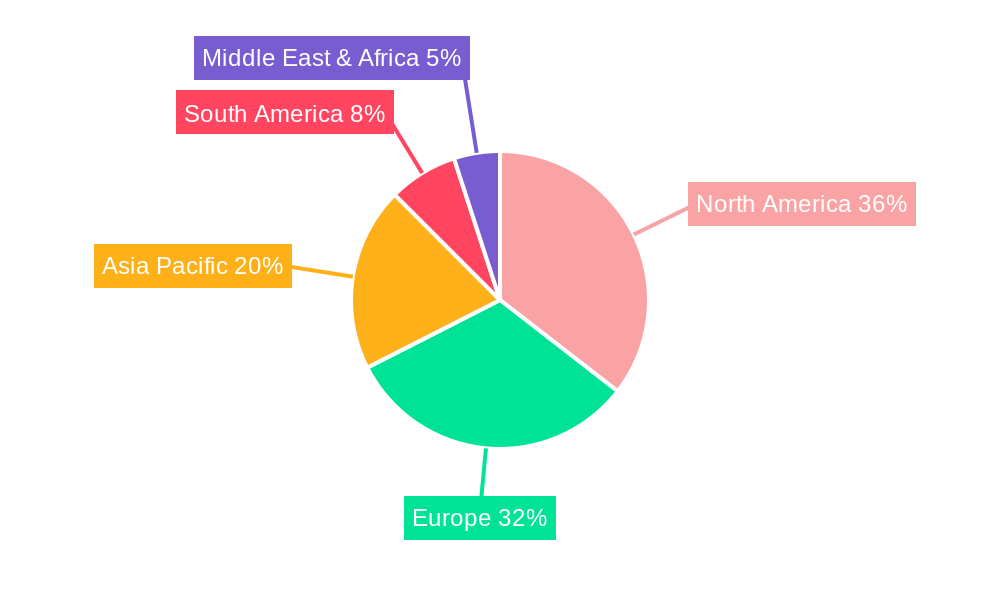
Home Use Devices Regional Market Share
Geographic Coverage of Home Use Devices
Home Use Devices REPORT HIGHLIGHTS
| Aspects | Details |
|---|---|
| Study Period | 2020-2034 |
| Base Year | 2025 |
| Estimated Year | 2026 |
| Forecast Period | 2026-2034 |
| Historical Period | 2020-2025 |
| Growth Rate | CAGR of 27% from 2020-2034 |
| Segmentation |
|
Table of Contents
- 1. Introduction
- 1.1. Research Scope
- 1.2. Market Segmentation
- 1.3. Research Objective
- 1.4. Definitions and Assumptions
- 2. Executive Summary
- 2.1. Market Snapshot
- 3. Market Dynamics
- 3.1. Market Drivers
- 3.2. Market Restrains
- 3.3. Market Trends
- 3.4. Market Opportunities
- 4. Market Factor Analysis
- 4.1. Porters Five Forces
- 4.1.1. Bargaining Power of Suppliers
- 4.1.2. Bargaining Power of Buyers
- 4.1.3. Threat of New Entrants
- 4.1.4. Threat of Substitutes
- 4.1.5. Competitive Rivalry
- 4.2. PESTEL analysis
- 4.3. BCG Analysis
- 4.3.1. Stars (High Growth, High Market Share)
- 4.3.2. Cash Cows (Low Growth, High Market Share)
- 4.3.3. Question Mark (High Growth, Low Market Share)
- 4.3.4. Dogs (Low Growth, Low Market Share)
- 4.4. Ansoff Matrix Analysis
- 4.5. Supply Chain Analysis
- 4.6. Regulatory Landscape
- 4.7. Current Market Potential and Opportunity Assessment (TAM–SAM–SOM Framework)
- 4.8. MDP Analyst Note
- 4.1. Porters Five Forces
- 5. Market Analysis, Insights and Forecast 2021-2033
- 5.1. Market Analysis, Insights and Forecast - by Application
- 5.1.1. Diagnostic Testing Devices
- 5.1.2. Treatment Equipment
- 5.2. Market Analysis, Insights and Forecast - by Types
- 5.2.1. Glucose Meters
- 5.2.2. Insulin Pumps
- 5.2.3. Blood Pressure Devices
- 5.2.4. Home Defibrillators
- 5.2.5. TENS Devices
- 5.3. Market Analysis, Insights and Forecast - by Region
- 5.3.1. North America
- 5.3.2. South America
- 5.3.3. Europe
- 5.3.4. Middle East & Africa
- 5.3.5. Asia Pacific
- 5.1. Market Analysis, Insights and Forecast - by Application
- 6. Global Home Use Devices Analysis, Insights and Forecast, 2021-2033
- 6.1. Market Analysis, Insights and Forecast - by Application
- 6.1.1. Diagnostic Testing Devices
- 6.1.2. Treatment Equipment
- 6.2. Market Analysis, Insights and Forecast - by Types
- 6.2.1. Glucose Meters
- 6.2.2. Insulin Pumps
- 6.2.3. Blood Pressure Devices
- 6.2.4. Home Defibrillators
- 6.2.5. TENS Devices
- 6.1. Market Analysis, Insights and Forecast - by Application
- 7. North America Home Use Devices Analysis, Insights and Forecast, 2020-2032
- 7.1. Market Analysis, Insights and Forecast - by Application
- 7.1.1. Diagnostic Testing Devices
- 7.1.2. Treatment Equipment
- 7.2. Market Analysis, Insights and Forecast - by Types
- 7.2.1. Glucose Meters
- 7.2.2. Insulin Pumps
- 7.2.3. Blood Pressure Devices
- 7.2.4. Home Defibrillators
- 7.2.5. TENS Devices
- 7.1. Market Analysis, Insights and Forecast - by Application
- 8. South America Home Use Devices Analysis, Insights and Forecast, 2020-2032
- 8.1. Market Analysis, Insights and Forecast - by Application
- 8.1.1. Diagnostic Testing Devices
- 8.1.2. Treatment Equipment
- 8.2. Market Analysis, Insights and Forecast - by Types
- 8.2.1. Glucose Meters
- 8.2.2. Insulin Pumps
- 8.2.3. Blood Pressure Devices
- 8.2.4. Home Defibrillators
- 8.2.5. TENS Devices
- 8.1. Market Analysis, Insights and Forecast - by Application
- 9. Europe Home Use Devices Analysis, Insights and Forecast, 2020-2032
- 9.1. Market Analysis, Insights and Forecast - by Application
- 9.1.1. Diagnostic Testing Devices
- 9.1.2. Treatment Equipment
- 9.2. Market Analysis, Insights and Forecast - by Types
- 9.2.1. Glucose Meters
- 9.2.2. Insulin Pumps
- 9.2.3. Blood Pressure Devices
- 9.2.4. Home Defibrillators
- 9.2.5. TENS Devices
- 9.1. Market Analysis, Insights and Forecast - by Application
- 10. Middle East & Africa Home Use Devices Analysis, Insights and Forecast, 2020-2032
- 10.1. Market Analysis, Insights and Forecast - by Application
- 10.1.1. Diagnostic Testing Devices
- 10.1.2. Treatment Equipment
- 10.2. Market Analysis, Insights and Forecast - by Types
- 10.2.1. Glucose Meters
- 10.2.2. Insulin Pumps
- 10.2.3. Blood Pressure Devices
- 10.2.4. Home Defibrillators
- 10.2.5. TENS Devices
- 10.1. Market Analysis, Insights and Forecast - by Application
- 11. Asia Pacific Home Use Devices Analysis, Insights and Forecast, 2020-2032
- 11.1. Market Analysis, Insights and Forecast - by Application
- 11.1.1. Diagnostic Testing Devices
- 11.1.2. Treatment Equipment
- 11.2. Market Analysis, Insights and Forecast - by Types
- 11.2.1. Glucose Meters
- 11.2.2. Insulin Pumps
- 11.2.3. Blood Pressure Devices
- 11.2.4. Home Defibrillators
- 11.2.5. TENS Devices
- 11.1. Market Analysis, Insights and Forecast - by Application
- 12. Competitive Analysis
- 12.1. Company Profiles
- 12.1.1 Roche
- 12.1.1.1. Company Overview
- 12.1.1.2. Products
- 12.1.1.3. Company Financials
- 12.1.1.4. SWOT Analysis
- 12.1.2 Johnson & Johnson
- 12.1.2.1. Company Overview
- 12.1.2.2. Products
- 12.1.2.3. Company Financials
- 12.1.2.4. SWOT Analysis
- 12.1.3 Bayer
- 12.1.3.1. Company Overview
- 12.1.3.2. Products
- 12.1.3.3. Company Financials
- 12.1.3.4. SWOT Analysis
- 12.1.4 Abbott
- 12.1.4.1. Company Overview
- 12.1.4.2. Products
- 12.1.4.3. Company Financials
- 12.1.4.4. SWOT Analysis
- 12.1.5 OMRON Healthcare India Pvt Ltd
- 12.1.5.1. Company Overview
- 12.1.5.2. Products
- 12.1.5.3. Company Financials
- 12.1.5.4. SWOT Analysis
- 12.1.6 ARKRAY
- 12.1.6.1. Company Overview
- 12.1.6.2. Products
- 12.1.6.3. Company Financials
- 12.1.6.4. SWOT Analysis
- 12.1.7 Inc.
- 12.1.7.1. Company Overview
- 12.1.7.2. Products
- 12.1.7.3. Company Financials
- 12.1.7.4. SWOT Analysis
- 12.1.8 Grace Medical
- 12.1.8.1. Company Overview
- 12.1.8.2. Products
- 12.1.8.3. Company Financials
- 12.1.8.4. SWOT Analysis
- 12.1.9 B. Braun Medical Inc.
- 12.1.9.1. Company Overview
- 12.1.9.2. Products
- 12.1.9.3. Company Financials
- 12.1.9.4. SWOT Analysis
- 12.1.10 I-SENS
- 12.1.10.1. Company Overview
- 12.1.10.2. Products
- 12.1.10.3. Company Financials
- 12.1.10.4. SWOT Analysis
- 12.1.11 Infopia Co.
- 12.1.11.1. Company Overview
- 12.1.11.2. Products
- 12.1.11.3. Company Financials
- 12.1.11.4. SWOT Analysis
- 12.1.12 Ltd.
- 12.1.12.1. Company Overview
- 12.1.12.2. Products
- 12.1.12.3. Company Financials
- 12.1.12.4. SWOT Analysis
- 12.1.13 Hainice Medical Inc
- 12.1.13.1. Company Overview
- 12.1.13.2. Products
- 12.1.13.3. Company Financials
- 12.1.13.4. SWOT Analysis
- 12.1.14 Mendor
- 12.1.14.1. Company Overview
- 12.1.14.2. Products
- 12.1.14.3. Company Financials
- 12.1.14.4. SWOT Analysis
- 12.1.15 All Medicus Co.
- 12.1.15.1. Company Overview
- 12.1.15.2. Products
- 12.1.15.3. Company Financials
- 12.1.15.4. SWOT Analysis
- 12.1.16 Ltd.
- 12.1.16.1. Company Overview
- 12.1.16.2. Products
- 12.1.16.3. Company Financials
- 12.1.16.4. SWOT Analysis
- 12.1.17 77 Elektronika Kft.
- 12.1.17.1. Company Overview
- 12.1.17.2. Products
- 12.1.17.3. Company Financials
- 12.1.17.4. SWOT Analysis
- 12.1.18 Delta
- 12.1.18.1. Company Overview
- 12.1.18.2. Products
- 12.1.18.3. Company Financials
- 12.1.18.4. SWOT Analysis
- 12.1.19 OK Biotech
- 12.1.19.1. Company Overview
- 12.1.19.2. Products
- 12.1.19.3. Company Financials
- 12.1.19.4. SWOT Analysis
- 12.1.20 MEDISANA AG
- 12.1.20.1. Company Overview
- 12.1.20.2. Products
- 12.1.20.3. Company Financials
- 12.1.20.4. SWOT Analysis
- 12.1.21 FIFTY 50
- 12.1.21.1. Company Overview
- 12.1.21.2. Products
- 12.1.21.3. Company Financials
- 12.1.21.4. SWOT Analysis
- 12.1.22 Nova Biomedical
- 12.1.22.1. Company Overview
- 12.1.22.2. Products
- 12.1.22.3. Company Financials
- 12.1.22.4. SWOT Analysis
- 12.1.23 Oak Tree Health
- 12.1.23.1. Company Overview
- 12.1.23.2. Products
- 12.1.23.3. Company Financials
- 12.1.23.4. SWOT Analysis
- 12.1.1 Roche
- 12.2. Market Entropy
- 12.2.1 Company's Key Areas Served
- 12.2.2 Recent Developments
- 12.3. Company Market Share Analysis 2025
- 12.3.1 Top 5 Companies Market Share Analysis
- 12.3.2 Top 3 Companies Market Share Analysis
- 12.4. List of Potential Customers
- 13. Research Methodology
List of Figures
- Figure 1: Global Home Use Devices Revenue Breakdown (undefined, %) by Region 2025 & 2033
- Figure 2: North America Home Use Devices Revenue (undefined), by Application 2025 & 2033
- Figure 3: North America Home Use Devices Revenue Share (%), by Application 2025 & 2033
- Figure 4: North America Home Use Devices Revenue (undefined), by Types 2025 & 2033
- Figure 5: North America Home Use Devices Revenue Share (%), by Types 2025 & 2033
- Figure 6: North America Home Use Devices Revenue (undefined), by Country 2025 & 2033
- Figure 7: North America Home Use Devices Revenue Share (%), by Country 2025 & 2033
- Figure 8: South America Home Use Devices Revenue (undefined), by Application 2025 & 2033
- Figure 9: South America Home Use Devices Revenue Share (%), by Application 2025 & 2033
- Figure 10: South America Home Use Devices Revenue (undefined), by Types 2025 & 2033
- Figure 11: South America Home Use Devices Revenue Share (%), by Types 2025 & 2033
- Figure 12: South America Home Use Devices Revenue (undefined), by Country 2025 & 2033
- Figure 13: South America Home Use Devices Revenue Share (%), by Country 2025 & 2033
- Figure 14: Europe Home Use Devices Revenue (undefined), by Application 2025 & 2033
- Figure 15: Europe Home Use Devices Revenue Share (%), by Application 2025 & 2033
- Figure 16: Europe Home Use Devices Revenue (undefined), by Types 2025 & 2033
- Figure 17: Europe Home Use Devices Revenue Share (%), by Types 2025 & 2033
- Figure 18: Europe Home Use Devices Revenue (undefined), by Country 2025 & 2033
- Figure 19: Europe Home Use Devices Revenue Share (%), by Country 2025 & 2033
- Figure 20: Middle East & Africa Home Use Devices Revenue (undefined), by Application 2025 & 2033
- Figure 21: Middle East & Africa Home Use Devices Revenue Share (%), by Application 2025 & 2033
- Figure 22: Middle East & Africa Home Use Devices Revenue (undefined), by Types 2025 & 2033
- Figure 23: Middle East & Africa Home Use Devices Revenue Share (%), by Types 2025 & 2033
- Figure 24: Middle East & Africa Home Use Devices Revenue (undefined), by Country 2025 & 2033
- Figure 25: Middle East & Africa Home Use Devices Revenue Share (%), by Country 2025 & 2033
- Figure 26: Asia Pacific Home Use Devices Revenue (undefined), by Application 2025 & 2033
- Figure 27: Asia Pacific Home Use Devices Revenue Share (%), by Application 2025 & 2033
- Figure 28: Asia Pacific Home Use Devices Revenue (undefined), by Types 2025 & 2033
- Figure 29: Asia Pacific Home Use Devices Revenue Share (%), by Types 2025 & 2033
- Figure 30: Asia Pacific Home Use Devices Revenue (undefined), by Country 2025 & 2033
- Figure 31: Asia Pacific Home Use Devices Revenue Share (%), by Country 2025 & 2033
List of Tables
- Table 1: Global Home Use Devices Revenue undefined Forecast, by Application 2020 & 2033
- Table 2: Global Home Use Devices Revenue undefined Forecast, by Types 2020 & 2033
- Table 3: Global Home Use Devices Revenue undefined Forecast, by Region 2020 & 2033
- Table 4: Global Home Use Devices Revenue undefined Forecast, by Application 2020 & 2033
- Table 5: Global Home Use Devices Revenue undefined Forecast, by Types 2020 & 2033
- Table 6: Global Home Use Devices Revenue undefined Forecast, by Country 2020 & 2033
- Table 7: United States Home Use Devices Revenue (undefined) Forecast, by Application 2020 & 2033
- Table 8: Canada Home Use Devices Revenue (undefined) Forecast, by Application 2020 & 2033
- Table 9: Mexico Home Use Devices Revenue (undefined) Forecast, by Application 2020 & 2033
- Table 10: Global Home Use Devices Revenue undefined Forecast, by Application 2020 & 2033
- Table 11: Global Home Use Devices Revenue undefined Forecast, by Types 2020 & 2033
- Table 12: Global Home Use Devices Revenue undefined Forecast, by Country 2020 & 2033
- Table 13: Brazil Home Use Devices Revenue (undefined) Forecast, by Application 2020 & 2033
- Table 14: Argentina Home Use Devices Revenue (undefined) Forecast, by Application 2020 & 2033
- Table 15: Rest of South America Home Use Devices Revenue (undefined) Forecast, by Application 2020 & 2033
- Table 16: Global Home Use Devices Revenue undefined Forecast, by Application 2020 & 2033
- Table 17: Global Home Use Devices Revenue undefined Forecast, by Types 2020 & 2033
- Table 18: Global Home Use Devices Revenue undefined Forecast, by Country 2020 & 2033
- Table 19: United Kingdom Home Use Devices Revenue (undefined) Forecast, by Application 2020 & 2033
- Table 20: Germany Home Use Devices Revenue (undefined) Forecast, by Application 2020 & 2033
- Table 21: France Home Use Devices Revenue (undefined) Forecast, by Application 2020 & 2033
- Table 22: Italy Home Use Devices Revenue (undefined) Forecast, by Application 2020 & 2033
- Table 23: Spain Home Use Devices Revenue (undefined) Forecast, by Application 2020 & 2033
- Table 24: Russia Home Use Devices Revenue (undefined) Forecast, by Application 2020 & 2033
- Table 25: Benelux Home Use Devices Revenue (undefined) Forecast, by Application 2020 & 2033
- Table 26: Nordics Home Use Devices Revenue (undefined) Forecast, by Application 2020 & 2033
- Table 27: Rest of Europe Home Use Devices Revenue (undefined) Forecast, by Application 2020 & 2033
- Table 28: Global Home Use Devices Revenue undefined Forecast, by Application 2020 & 2033
- Table 29: Global Home Use Devices Revenue undefined Forecast, by Types 2020 & 2033
- Table 30: Global Home Use Devices Revenue undefined Forecast, by Country 2020 & 2033
- Table 31: Turkey Home Use Devices Revenue (undefined) Forecast, by Application 2020 & 2033
- Table 32: Israel Home Use Devices Revenue (undefined) Forecast, by Application 2020 & 2033
- Table 33: GCC Home Use Devices Revenue (undefined) Forecast, by Application 2020 & 2033
- Table 34: North Africa Home Use Devices Revenue (undefined) Forecast, by Application 2020 & 2033
- Table 35: South Africa Home Use Devices Revenue (undefined) Forecast, by Application 2020 & 2033
- Table 36: Rest of Middle East & Africa Home Use Devices Revenue (undefined) Forecast, by Application 2020 & 2033
- Table 37: Global Home Use Devices Revenue undefined Forecast, by Application 2020 & 2033
- Table 38: Global Home Use Devices Revenue undefined Forecast, by Types 2020 & 2033
- Table 39: Global Home Use Devices Revenue undefined Forecast, by Country 2020 & 2033
- Table 40: China Home Use Devices Revenue (undefined) Forecast, by Application 2020 & 2033
- Table 41: India Home Use Devices Revenue (undefined) Forecast, by Application 2020 & 2033
- Table 42: Japan Home Use Devices Revenue (undefined) Forecast, by Application 2020 & 2033
- Table 43: South Korea Home Use Devices Revenue (undefined) Forecast, by Application 2020 & 2033
- Table 44: ASEAN Home Use Devices Revenue (undefined) Forecast, by Application 2020 & 2033
- Table 45: Oceania Home Use Devices Revenue (undefined) Forecast, by Application 2020 & 2033
- Table 46: Rest of Asia Pacific Home Use Devices Revenue (undefined) Forecast, by Application 2020 & 2033
Frequently Asked Questions
1. What is the projected Compound Annual Growth Rate (CAGR) of the Home Use Devices?
The projected CAGR is approximately 27%.
2. Which companies are prominent players in the Home Use Devices?
Key companies in the market include Roche, Johnson & Johnson, Bayer, Abbott, OMRON Healthcare India Pvt Ltd, ARKRAY, Inc., Grace Medical, B. Braun Medical Inc., I-SENS, Infopia Co., Ltd., Hainice Medical Inc, Mendor, All Medicus Co., Ltd., 77 Elektronika Kft., Delta, OK Biotech, MEDISANA AG, FIFTY 50, Nova Biomedical, Oak Tree Health.
3. What are the main segments of the Home Use Devices?
The market segments include Application, Types.
4. Can you provide details about the market size?
The market size is estimated to be USD XXX N/A as of 2022.
5. What are some drivers contributing to market growth?
N/A
6. What are the notable trends driving market growth?
N/A
7. Are there any restraints impacting market growth?
N/A
8. Can you provide examples of recent developments in the market?
N/A
9. What pricing options are available for accessing the report?
Pricing options include single-user, multi-user, and enterprise licenses priced at USD 2900.00, USD 4350.00, and USD 5800.00 respectively.
10. Is the market size provided in terms of value or volume?
The market size is provided in terms of value, measured in N/A.
11. Are there any specific market keywords associated with the report?
Yes, the market keyword associated with the report is "Home Use Devices," which aids in identifying and referencing the specific market segment covered.
12. How do I determine which pricing option suits my needs best?
The pricing options vary based on user requirements and access needs. Individual users may opt for single-user licenses, while businesses requiring broader access may choose multi-user or enterprise licenses for cost-effective access to the report.
13. Are there any additional resources or data provided in the Home Use Devices report?
While the report offers comprehensive insights, it's advisable to review the specific contents or supplementary materials provided to ascertain if additional resources or data are available.
14. How can I stay updated on further developments or reports in the Home Use Devices?
To stay informed about further developments, trends, and reports in the Home Use Devices, consider subscribing to industry newsletters, following relevant companies and organizations, or regularly checking reputable industry news sources and publications.
Methodology
Step 1 - Identification of Relevant Samples Size from Population Database


Step 2 - Approaches for Defining Global Market Size (Value, Volume* & Price*)

Note*: In applicable scenarios
Step 3 - Data Sources
Primary Research
- Web Analytics
- Survey Reports
- Research Institute
- Latest Research Reports
- Opinion Leaders
Secondary Research
- Annual Reports
- White Paper
- Latest Press Release
- Industry Association
- Paid Database
- Investor Presentations

Step 4 - Data Triangulation
Involves using different sources of information in order to increase the validity of a study
These sources are likely to be stakeholders in a program - participants, other researchers, program staff, other community members, and so on.
Then we put all data in single framework & apply various statistical tools to find out the dynamic on the market.
During the analysis stage, feedback from the stakeholder groups would be compared to determine areas of agreement as well as areas of divergence