

Key Insights
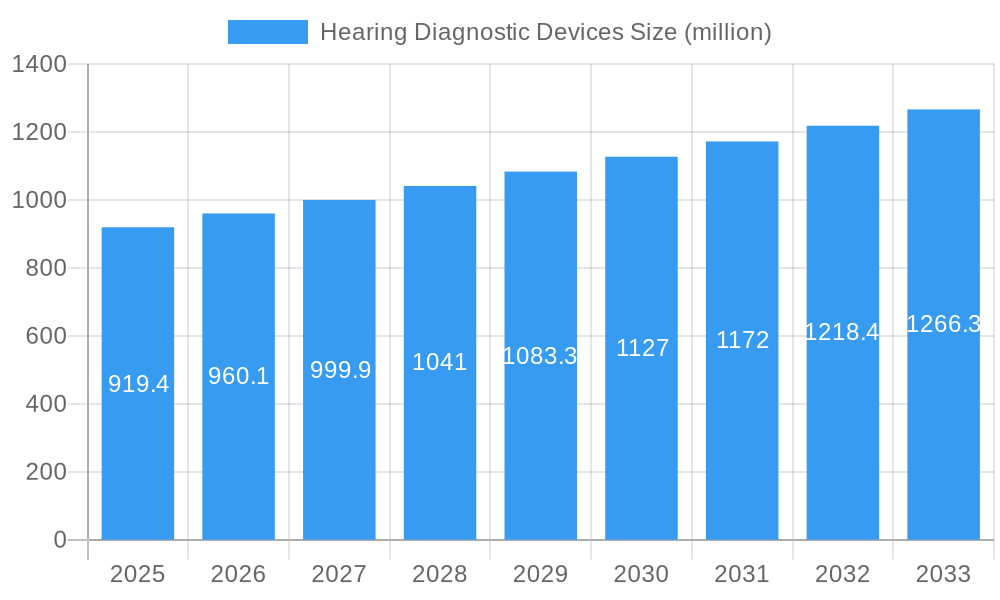
The global hearing diagnostic devices market is poised for robust expansion, projected to reach $9.08 billion by 2025, with a Compound Annual Growth Rate (CAGR) of 7.05%. This growth is fueled by the escalating prevalence of hearing loss across all demographics, continuous advancements in diagnostic technologies enhancing accuracy and efficiency, and a growing emphasis on early detection and intervention. The aging global population is a primary driver, as age-related hearing impairment is widespread. Technological innovations, including the integration of Artificial Intelligence (AI) and Machine Learning (ML) into diagnostic tools, are accelerating assessment speed and precision, leading to improved patient outcomes and market expansion. Additionally, increasing adoption of hearing healthcare programs and supportive government initiatives promoting early diagnosis and treatment are creating a favorable market environment.
Hearing Diagnostic Devices Market Size (In Billion)
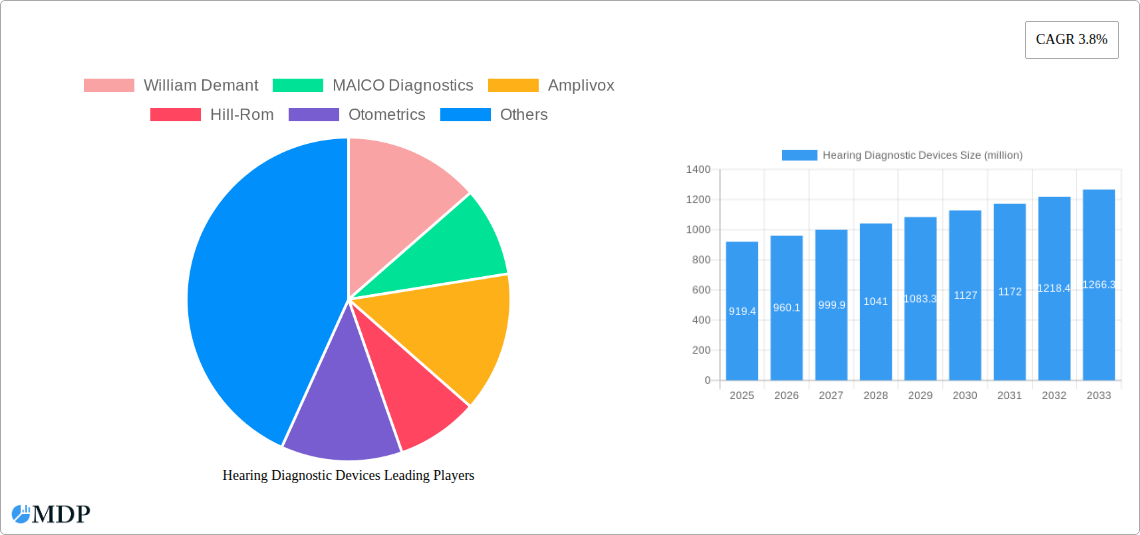
While the outlook is positive, potential challenges exist. The high cost of advanced diagnostic equipment may limit access and adoption, particularly in resource-limited areas. Variations in healthcare reimbursement policies globally can also impact market penetration. However, ongoing technological innovation, coupled with increasing affordability and accessibility of hearing diagnostic devices, is anticipated to overcome these hurdles, driving market growth throughout the forecast period (2025-2033). The competitive landscape features established companies such as William Demant, MAICO Diagnostics, and Otometrics, alongside innovative emerging players, shaping the market's evolution. Market segmentation is expected to encompass diverse device categories, including audiometers, tympanometers, and evoked potential systems, all contributing to the overall growth trajectory.
Hearing Diagnostic Devices Company Market Share
Hearing Diagnostic Devices Market Report: 2019-2033
Uncover the intricacies of the multi-million dollar Hearing Diagnostic Devices market with this comprehensive report. This in-depth analysis provides a detailed overview of market dynamics, industry trends, leading players, and future growth prospects. The report covers the period from 2019 to 2033, with a focus on the 2025-2033 forecast period. Benefiting industry stakeholders, investors, and market entrants, this report delivers actionable insights to navigate the complexities of this rapidly evolving sector.
Hearing Diagnostic Devices Market Dynamics & Concentration
The global hearing diagnostic devices market, valued at $XX million in 2024, is projected to reach $XX million by 2033, exhibiting a CAGR of XX%. Market concentration is moderately high, with key players like William Demant, Otometrics, and Natus Medical Incorporated holding significant market share. However, the market also witnesses the presence of several smaller, specialized companies.
Market Dynamics:
- Innovation Drivers: Advancements in digital signal processing, artificial intelligence (AI), and miniaturization are driving innovation. New devices offer improved accuracy, portability, and user-friendliness.
- Regulatory Frameworks: Stringent regulatory approvals and safety standards influence market growth, ensuring product efficacy and patient safety. Varying regulatory landscapes across different geographies impact market access and expansion strategies.
- Product Substitutes: While no direct substitutes exist for core diagnostic functionalities, advancements in other areas of healthcare (like telehealth) may partially impact market demand.
- End-User Trends: Growing awareness of hearing loss and increasing demand for early diagnosis are key growth drivers. The aging population, a significant demographic for hearing issues, further fuels market expansion. An increasing acceptance of hearing aids and other related technology helps support growth.
- M&A Activities: The market has seen XX M&A deals in the period 2019-2024, with larger players strategically acquiring smaller companies to expand their product portfolio and market reach. These mergers have led to increased competition and consolidation within the market, resulting in an increase in average deal size.
Hearing Diagnostic Devices Industry Trends & Analysis
The hearing diagnostic devices market is characterized by significant growth, driven by technological advancements, shifting consumer preferences, and a robust competitive landscape. The market's CAGR of XX% reflects the significant expansion. Market penetration of advanced diagnostic technologies is steadily increasing, particularly in developed regions.
- Technological Disruptions: AI-powered diagnostic tools are enhancing accuracy and efficiency, accelerating the market's growth trajectory. Wireless connectivity and cloud-based data management systems are improving accessibility and ease of use.
- Consumer Preferences: Consumers are increasingly demanding user-friendly, portable, and cost-effective devices, pushing manufacturers to innovate accordingly. Demand for personalized hearing care solutions based on individual needs is also on the rise.
- Competitive Dynamics: The market displays a mix of established players and emerging companies, leading to intense competition. Pricing strategies, product differentiation, and technological innovation are key competitive factors.
Leading Markets & Segments in Hearing Diagnostic Devices
The North American market holds a significant share of the global hearing diagnostic devices market, driven by factors such as a high prevalence of hearing loss, advanced healthcare infrastructure, and substantial investment in healthcare technology.
- Key Drivers in North America:
- Strong healthcare infrastructure and funding.
- High prevalence of age-related hearing loss.
- Rising awareness about hearing health and early detection.
- Favorable regulatory environment and reimbursement policies.
Europe follows North America as a major market, similarly driven by an aging population, advanced healthcare systems, and increasing awareness of hearing loss. Other regions, such as Asia-Pacific, are experiencing rapid growth fueled by rising disposable incomes and improving healthcare access.
Hearing Diagnostic Devices Product Developments
Recent product developments focus on integrating AI algorithms for improved diagnostic accuracy and automated analysis. Miniaturization and wireless connectivity are also key features in new devices, improving portability and ease of use. Manufacturers are emphasizing the development of personalized hearing care solutions tailored to individual patient needs. This strategy helps enhance market fit and competitiveness.
Key Drivers of Hearing Diagnostic Devices Growth
Several factors contribute to the market's growth. The aging global population is a primary driver, as age-related hearing loss is highly prevalent. Technological advancements, including AI integration and miniaturization, enhance diagnostic accuracy and user experience, fueling market expansion. Favorable regulatory environments and rising healthcare spending in several regions also play a vital role in boosting market growth.
Challenges in the Hearing Diagnostic Devices Market
The market faces challenges, including high device costs limiting access in some regions. The complex regulatory landscape and stringent approval processes can hinder market entry. Competition from established players can also impact smaller companies' growth. Supply chain disruptions, particularly in the wake of global events, can impact availability and pricing.
Emerging Opportunities in Hearing Diagnostic Devices
Expansion into emerging markets with growing healthcare infrastructure offers significant opportunities. The development of innovative diagnostic tools employing AI and machine learning holds promise. Strategic partnerships and collaborations between manufacturers and healthcare providers can accelerate market penetration and enhance patient access to improved hearing care.
Leading Players in the Hearing Diagnostic Devices Sector
- William Demant
- MAICO Diagnostics
- Amplivox
- Hill-Rom
- Otometrics
- Grason Stadler
- Interacoustics
- INVENTIS
- RION
- Natus Medical Incorporated
Key Milestones in Hearing Diagnostic Devices Industry
- 2020: Launch of AI-powered diagnostic software by William Demant.
- 2022: Acquisition of a smaller diagnostic company by Otometrics, expanding its product portfolio.
- 2023: Introduction of a new portable hearing testing device by Natus Medical Incorporated.
- 2024: Several key players introduced new software upgrades emphasizing personalized hearing care.
Strategic Outlook for Hearing Diagnostic Devices Market
The future of the hearing diagnostic devices market is bright, driven by continuous technological innovation, increasing awareness of hearing loss, and the expanding elderly population. Strategic partnerships, expansion into emerging markets, and the development of personalized solutions will be key factors in shaping the market's future landscape. The market is poised for continued strong growth, offering substantial opportunities for both established players and new entrants.
Hearing Diagnostic Devices Segmentation
-
1. Application
- 1.1. Hospital and Clinic
- 1.2. Household
- 1.3. Special Organization
-
2. Types
- 2.1. OAE
- 2.2. Audiometer
- 2.3. Otoscope
- 2.4. Tympanometer
- 2.5. Others
Hearing Diagnostic Devices Segmentation By Geography
-
1. North America
- 1.1. United States
- 1.2. Canada
- 1.3. Mexico
-
2. South America
- 2.1. Brazil
- 2.2. Argentina
- 2.3. Rest of South America
-
3. Europe
- 3.1. United Kingdom
- 3.2. Germany
- 3.3. France
- 3.4. Italy
- 3.5. Spain
- 3.6. Russia
- 3.7. Benelux
- 3.8. Nordics
- 3.9. Rest of Europe
-
4. Middle East & Africa
- 4.1. Turkey
- 4.2. Israel
- 4.3. GCC
- 4.4. North Africa
- 4.5. South Africa
- 4.6. Rest of Middle East & Africa
-
5. Asia Pacific
- 5.1. China
- 5.2. India
- 5.3. Japan
- 5.4. South Korea
- 5.5. ASEAN
- 5.6. Oceania
- 5.7. Rest of Asia Pacific

Hearing Diagnostic Devices Regional Market Share
Geographic Coverage of Hearing Diagnostic Devices
Hearing Diagnostic Devices REPORT HIGHLIGHTS
| Aspects | Details |
|---|---|
| Study Period | 2020-2034 |
| Base Year | 2025 |
| Estimated Year | 2026 |
| Forecast Period | 2026-2034 |
| Historical Period | 2020-2025 |
| Growth Rate | CAGR of 7.05% from 2020-2034 |
| Segmentation |
|
Table of Contents
- 1. Introduction
- 1.1. Research Scope
- 1.2. Market Segmentation
- 1.3. Research Objective
- 1.4. Definitions and Assumptions
- 2. Executive Summary
- 2.1. Market Snapshot
- 3. Market Dynamics
- 3.1. Market Drivers
- 3.2. Market Restrains
- 3.3. Market Trends
- 3.4. Market Opportunities
- 4. Market Factor Analysis
- 4.1. Porters Five Forces
- 4.1.1. Bargaining Power of Suppliers
- 4.1.2. Bargaining Power of Buyers
- 4.1.3. Threat of New Entrants
- 4.1.4. Threat of Substitutes
- 4.1.5. Competitive Rivalry
- 4.2. PESTEL analysis
- 4.3. BCG Analysis
- 4.3.1. Stars (High Growth, High Market Share)
- 4.3.2. Cash Cows (Low Growth, High Market Share)
- 4.3.3. Question Mark (High Growth, Low Market Share)
- 4.3.4. Dogs (Low Growth, Low Market Share)
- 4.4. Ansoff Matrix Analysis
- 4.5. Supply Chain Analysis
- 4.6. Regulatory Landscape
- 4.7. Current Market Potential and Opportunity Assessment (TAM–SAM–SOM Framework)
- 4.8. MDP Analyst Note
- 4.1. Porters Five Forces
- 5. Market Analysis, Insights and Forecast 2021-2033
- 5.1. Market Analysis, Insights and Forecast - by Application
- 5.1.1. Hospital and Clinic
- 5.1.2. Household
- 5.1.3. Special Organization
- 5.2. Market Analysis, Insights and Forecast - by Types
- 5.2.1. OAE
- 5.2.2. Audiometer
- 5.2.3. Otoscope
- 5.2.4. Tympanometer
- 5.2.5. Others
- 5.3. Market Analysis, Insights and Forecast - by Region
- 5.3.1. North America
- 5.3.2. South America
- 5.3.3. Europe
- 5.3.4. Middle East & Africa
- 5.3.5. Asia Pacific
- 5.1. Market Analysis, Insights and Forecast - by Application
- 6. Global Hearing Diagnostic Devices Analysis, Insights and Forecast, 2021-2033
- 6.1. Market Analysis, Insights and Forecast - by Application
- 6.1.1. Hospital and Clinic
- 6.1.2. Household
- 6.1.3. Special Organization
- 6.2. Market Analysis, Insights and Forecast - by Types
- 6.2.1. OAE
- 6.2.2. Audiometer
- 6.2.3. Otoscope
- 6.2.4. Tympanometer
- 6.2.5. Others
- 6.1. Market Analysis, Insights and Forecast - by Application
- 7. North America Hearing Diagnostic Devices Analysis, Insights and Forecast, 2020-2032
- 7.1. Market Analysis, Insights and Forecast - by Application
- 7.1.1. Hospital and Clinic
- 7.1.2. Household
- 7.1.3. Special Organization
- 7.2. Market Analysis, Insights and Forecast - by Types
- 7.2.1. OAE
- 7.2.2. Audiometer
- 7.2.3. Otoscope
- 7.2.4. Tympanometer
- 7.2.5. Others
- 7.1. Market Analysis, Insights and Forecast - by Application
- 8. South America Hearing Diagnostic Devices Analysis, Insights and Forecast, 2020-2032
- 8.1. Market Analysis, Insights and Forecast - by Application
- 8.1.1. Hospital and Clinic
- 8.1.2. Household
- 8.1.3. Special Organization
- 8.2. Market Analysis, Insights and Forecast - by Types
- 8.2.1. OAE
- 8.2.2. Audiometer
- 8.2.3. Otoscope
- 8.2.4. Tympanometer
- 8.2.5. Others
- 8.1. Market Analysis, Insights and Forecast - by Application
- 9. Europe Hearing Diagnostic Devices Analysis, Insights and Forecast, 2020-2032
- 9.1. Market Analysis, Insights and Forecast - by Application
- 9.1.1. Hospital and Clinic
- 9.1.2. Household
- 9.1.3. Special Organization
- 9.2. Market Analysis, Insights and Forecast - by Types
- 9.2.1. OAE
- 9.2.2. Audiometer
- 9.2.3. Otoscope
- 9.2.4. Tympanometer
- 9.2.5. Others
- 9.1. Market Analysis, Insights and Forecast - by Application
- 10. Middle East & Africa Hearing Diagnostic Devices Analysis, Insights and Forecast, 2020-2032
- 10.1. Market Analysis, Insights and Forecast - by Application
- 10.1.1. Hospital and Clinic
- 10.1.2. Household
- 10.1.3. Special Organization
- 10.2. Market Analysis, Insights and Forecast - by Types
- 10.2.1. OAE
- 10.2.2. Audiometer
- 10.2.3. Otoscope
- 10.2.4. Tympanometer
- 10.2.5. Others
- 10.1. Market Analysis, Insights and Forecast - by Application
- 11. Asia Pacific Hearing Diagnostic Devices Analysis, Insights and Forecast, 2020-2032
- 11.1. Market Analysis, Insights and Forecast - by Application
- 11.1.1. Hospital and Clinic
- 11.1.2. Household
- 11.1.3. Special Organization
- 11.2. Market Analysis, Insights and Forecast - by Types
- 11.2.1. OAE
- 11.2.2. Audiometer
- 11.2.3. Otoscope
- 11.2.4. Tympanometer
- 11.2.5. Others
- 11.1. Market Analysis, Insights and Forecast - by Application
- 12. Competitive Analysis
- 12.1. Company Profiles
- 12.1.1 William Demant
- 12.1.1.1. Company Overview
- 12.1.1.2. Products
- 12.1.1.3. Company Financials
- 12.1.1.4. SWOT Analysis
- 12.1.2 MAICO Diagnostics
- 12.1.2.1. Company Overview
- 12.1.2.2. Products
- 12.1.2.3. Company Financials
- 12.1.2.4. SWOT Analysis
- 12.1.3 Amplivox
- 12.1.3.1. Company Overview
- 12.1.3.2. Products
- 12.1.3.3. Company Financials
- 12.1.3.4. SWOT Analysis
- 12.1.4 Hill-Rom
- 12.1.4.1. Company Overview
- 12.1.4.2. Products
- 12.1.4.3. Company Financials
- 12.1.4.4. SWOT Analysis
- 12.1.5 Otometrics
- 12.1.5.1. Company Overview
- 12.1.5.2. Products
- 12.1.5.3. Company Financials
- 12.1.5.4. SWOT Analysis
- 12.1.6 Grason Stadler
- 12.1.6.1. Company Overview
- 12.1.6.2. Products
- 12.1.6.3. Company Financials
- 12.1.6.4. SWOT Analysis
- 12.1.7 Interacoustics
- 12.1.7.1. Company Overview
- 12.1.7.2. Products
- 12.1.7.3. Company Financials
- 12.1.7.4. SWOT Analysis
- 12.1.8 INVENTIS
- 12.1.8.1. Company Overview
- 12.1.8.2. Products
- 12.1.8.3. Company Financials
- 12.1.8.4. SWOT Analysis
- 12.1.9 RION
- 12.1.9.1. Company Overview
- 12.1.9.2. Products
- 12.1.9.3. Company Financials
- 12.1.9.4. SWOT Analysis
- 12.1.10 Natus Medical Incorporated
- 12.1.10.1. Company Overview
- 12.1.10.2. Products
- 12.1.10.3. Company Financials
- 12.1.10.4. SWOT Analysis
- 12.1.1 William Demant
- 12.2. Market Entropy
- 12.2.1 Company's Key Areas Served
- 12.2.2 Recent Developments
- 12.3. Company Market Share Analysis 2025
- 12.3.1 Top 5 Companies Market Share Analysis
- 12.3.2 Top 3 Companies Market Share Analysis
- 12.4. List of Potential Customers
- 13. Research Methodology
List of Figures
- Figure 1: Global Hearing Diagnostic Devices Revenue Breakdown (billion, %) by Region 2025 & 2033
- Figure 2: Global Hearing Diagnostic Devices Volume Breakdown (K, %) by Region 2025 & 2033
- Figure 3: North America Hearing Diagnostic Devices Revenue (billion), by Application 2025 & 2033
- Figure 4: North America Hearing Diagnostic Devices Volume (K), by Application 2025 & 2033
- Figure 5: North America Hearing Diagnostic Devices Revenue Share (%), by Application 2025 & 2033
- Figure 6: North America Hearing Diagnostic Devices Volume Share (%), by Application 2025 & 2033
- Figure 7: North America Hearing Diagnostic Devices Revenue (billion), by Types 2025 & 2033
- Figure 8: North America Hearing Diagnostic Devices Volume (K), by Types 2025 & 2033
- Figure 9: North America Hearing Diagnostic Devices Revenue Share (%), by Types 2025 & 2033
- Figure 10: North America Hearing Diagnostic Devices Volume Share (%), by Types 2025 & 2033
- Figure 11: North America Hearing Diagnostic Devices Revenue (billion), by Country 2025 & 2033
- Figure 12: North America Hearing Diagnostic Devices Volume (K), by Country 2025 & 2033
- Figure 13: North America Hearing Diagnostic Devices Revenue Share (%), by Country 2025 & 2033
- Figure 14: North America Hearing Diagnostic Devices Volume Share (%), by Country 2025 & 2033
- Figure 15: South America Hearing Diagnostic Devices Revenue (billion), by Application 2025 & 2033
- Figure 16: South America Hearing Diagnostic Devices Volume (K), by Application 2025 & 2033
- Figure 17: South America Hearing Diagnostic Devices Revenue Share (%), by Application 2025 & 2033
- Figure 18: South America Hearing Diagnostic Devices Volume Share (%), by Application 2025 & 2033
- Figure 19: South America Hearing Diagnostic Devices Revenue (billion), by Types 2025 & 2033
- Figure 20: South America Hearing Diagnostic Devices Volume (K), by Types 2025 & 2033
- Figure 21: South America Hearing Diagnostic Devices Revenue Share (%), by Types 2025 & 2033
- Figure 22: South America Hearing Diagnostic Devices Volume Share (%), by Types 2025 & 2033
- Figure 23: South America Hearing Diagnostic Devices Revenue (billion), by Country 2025 & 2033
- Figure 24: South America Hearing Diagnostic Devices Volume (K), by Country 2025 & 2033
- Figure 25: South America Hearing Diagnostic Devices Revenue Share (%), by Country 2025 & 2033
- Figure 26: South America Hearing Diagnostic Devices Volume Share (%), by Country 2025 & 2033
- Figure 27: Europe Hearing Diagnostic Devices Revenue (billion), by Application 2025 & 2033
- Figure 28: Europe Hearing Diagnostic Devices Volume (K), by Application 2025 & 2033
- Figure 29: Europe Hearing Diagnostic Devices Revenue Share (%), by Application 2025 & 2033
- Figure 30: Europe Hearing Diagnostic Devices Volume Share (%), by Application 2025 & 2033
- Figure 31: Europe Hearing Diagnostic Devices Revenue (billion), by Types 2025 & 2033
- Figure 32: Europe Hearing Diagnostic Devices Volume (K), by Types 2025 & 2033
- Figure 33: Europe Hearing Diagnostic Devices Revenue Share (%), by Types 2025 & 2033
- Figure 34: Europe Hearing Diagnostic Devices Volume Share (%), by Types 2025 & 2033
- Figure 35: Europe Hearing Diagnostic Devices Revenue (billion), by Country 2025 & 2033
- Figure 36: Europe Hearing Diagnostic Devices Volume (K), by Country 2025 & 2033
- Figure 37: Europe Hearing Diagnostic Devices Revenue Share (%), by Country 2025 & 2033
- Figure 38: Europe Hearing Diagnostic Devices Volume Share (%), by Country 2025 & 2033
- Figure 39: Middle East & Africa Hearing Diagnostic Devices Revenue (billion), by Application 2025 & 2033
- Figure 40: Middle East & Africa Hearing Diagnostic Devices Volume (K), by Application 2025 & 2033
- Figure 41: Middle East & Africa Hearing Diagnostic Devices Revenue Share (%), by Application 2025 & 2033
- Figure 42: Middle East & Africa Hearing Diagnostic Devices Volume Share (%), by Application 2025 & 2033
- Figure 43: Middle East & Africa Hearing Diagnostic Devices Revenue (billion), by Types 2025 & 2033
- Figure 44: Middle East & Africa Hearing Diagnostic Devices Volume (K), by Types 2025 & 2033
- Figure 45: Middle East & Africa Hearing Diagnostic Devices Revenue Share (%), by Types 2025 & 2033
- Figure 46: Middle East & Africa Hearing Diagnostic Devices Volume Share (%), by Types 2025 & 2033
- Figure 47: Middle East & Africa Hearing Diagnostic Devices Revenue (billion), by Country 2025 & 2033
- Figure 48: Middle East & Africa Hearing Diagnostic Devices Volume (K), by Country 2025 & 2033
- Figure 49: Middle East & Africa Hearing Diagnostic Devices Revenue Share (%), by Country 2025 & 2033
- Figure 50: Middle East & Africa Hearing Diagnostic Devices Volume Share (%), by Country 2025 & 2033
- Figure 51: Asia Pacific Hearing Diagnostic Devices Revenue (billion), by Application 2025 & 2033
- Figure 52: Asia Pacific Hearing Diagnostic Devices Volume (K), by Application 2025 & 2033
- Figure 53: Asia Pacific Hearing Diagnostic Devices Revenue Share (%), by Application 2025 & 2033
- Figure 54: Asia Pacific Hearing Diagnostic Devices Volume Share (%), by Application 2025 & 2033
- Figure 55: Asia Pacific Hearing Diagnostic Devices Revenue (billion), by Types 2025 & 2033
- Figure 56: Asia Pacific Hearing Diagnostic Devices Volume (K), by Types 2025 & 2033
- Figure 57: Asia Pacific Hearing Diagnostic Devices Revenue Share (%), by Types 2025 & 2033
- Figure 58: Asia Pacific Hearing Diagnostic Devices Volume Share (%), by Types 2025 & 2033
- Figure 59: Asia Pacific Hearing Diagnostic Devices Revenue (billion), by Country 2025 & 2033
- Figure 60: Asia Pacific Hearing Diagnostic Devices Volume (K), by Country 2025 & 2033
- Figure 61: Asia Pacific Hearing Diagnostic Devices Revenue Share (%), by Country 2025 & 2033
- Figure 62: Asia Pacific Hearing Diagnostic Devices Volume Share (%), by Country 2025 & 2033
List of Tables
- Table 1: Global Hearing Diagnostic Devices Revenue billion Forecast, by Application 2020 & 2033
- Table 2: Global Hearing Diagnostic Devices Volume K Forecast, by Application 2020 & 2033
- Table 3: Global Hearing Diagnostic Devices Revenue billion Forecast, by Types 2020 & 2033
- Table 4: Global Hearing Diagnostic Devices Volume K Forecast, by Types 2020 & 2033
- Table 5: Global Hearing Diagnostic Devices Revenue billion Forecast, by Region 2020 & 2033
- Table 6: Global Hearing Diagnostic Devices Volume K Forecast, by Region 2020 & 2033
- Table 7: Global Hearing Diagnostic Devices Revenue billion Forecast, by Application 2020 & 2033
- Table 8: Global Hearing Diagnostic Devices Volume K Forecast, by Application 2020 & 2033
- Table 9: Global Hearing Diagnostic Devices Revenue billion Forecast, by Types 2020 & 2033
- Table 10: Global Hearing Diagnostic Devices Volume K Forecast, by Types 2020 & 2033
- Table 11: Global Hearing Diagnostic Devices Revenue billion Forecast, by Country 2020 & 2033
- Table 12: Global Hearing Diagnostic Devices Volume K Forecast, by Country 2020 & 2033
- Table 13: United States Hearing Diagnostic Devices Revenue (billion) Forecast, by Application 2020 & 2033
- Table 14: United States Hearing Diagnostic Devices Volume (K) Forecast, by Application 2020 & 2033
- Table 15: Canada Hearing Diagnostic Devices Revenue (billion) Forecast, by Application 2020 & 2033
- Table 16: Canada Hearing Diagnostic Devices Volume (K) Forecast, by Application 2020 & 2033
- Table 17: Mexico Hearing Diagnostic Devices Revenue (billion) Forecast, by Application 2020 & 2033
- Table 18: Mexico Hearing Diagnostic Devices Volume (K) Forecast, by Application 2020 & 2033
- Table 19: Global Hearing Diagnostic Devices Revenue billion Forecast, by Application 2020 & 2033
- Table 20: Global Hearing Diagnostic Devices Volume K Forecast, by Application 2020 & 2033
- Table 21: Global Hearing Diagnostic Devices Revenue billion Forecast, by Types 2020 & 2033
- Table 22: Global Hearing Diagnostic Devices Volume K Forecast, by Types 2020 & 2033
- Table 23: Global Hearing Diagnostic Devices Revenue billion Forecast, by Country 2020 & 2033
- Table 24: Global Hearing Diagnostic Devices Volume K Forecast, by Country 2020 & 2033
- Table 25: Brazil Hearing Diagnostic Devices Revenue (billion) Forecast, by Application 2020 & 2033
- Table 26: Brazil Hearing Diagnostic Devices Volume (K) Forecast, by Application 2020 & 2033
- Table 27: Argentina Hearing Diagnostic Devices Revenue (billion) Forecast, by Application 2020 & 2033
- Table 28: Argentina Hearing Diagnostic Devices Volume (K) Forecast, by Application 2020 & 2033
- Table 29: Rest of South America Hearing Diagnostic Devices Revenue (billion) Forecast, by Application 2020 & 2033
- Table 30: Rest of South America Hearing Diagnostic Devices Volume (K) Forecast, by Application 2020 & 2033
- Table 31: Global Hearing Diagnostic Devices Revenue billion Forecast, by Application 2020 & 2033
- Table 32: Global Hearing Diagnostic Devices Volume K Forecast, by Application 2020 & 2033
- Table 33: Global Hearing Diagnostic Devices Revenue billion Forecast, by Types 2020 & 2033
- Table 34: Global Hearing Diagnostic Devices Volume K Forecast, by Types 2020 & 2033
- Table 35: Global Hearing Diagnostic Devices Revenue billion Forecast, by Country 2020 & 2033
- Table 36: Global Hearing Diagnostic Devices Volume K Forecast, by Country 2020 & 2033
- Table 37: United Kingdom Hearing Diagnostic Devices Revenue (billion) Forecast, by Application 2020 & 2033
- Table 38: United Kingdom Hearing Diagnostic Devices Volume (K) Forecast, by Application 2020 & 2033
- Table 39: Germany Hearing Diagnostic Devices Revenue (billion) Forecast, by Application 2020 & 2033
- Table 40: Germany Hearing Diagnostic Devices Volume (K) Forecast, by Application 2020 & 2033
- Table 41: France Hearing Diagnostic Devices Revenue (billion) Forecast, by Application 2020 & 2033
- Table 42: France Hearing Diagnostic Devices Volume (K) Forecast, by Application 2020 & 2033
- Table 43: Italy Hearing Diagnostic Devices Revenue (billion) Forecast, by Application 2020 & 2033
- Table 44: Italy Hearing Diagnostic Devices Volume (K) Forecast, by Application 2020 & 2033
- Table 45: Spain Hearing Diagnostic Devices Revenue (billion) Forecast, by Application 2020 & 2033
- Table 46: Spain Hearing Diagnostic Devices Volume (K) Forecast, by Application 2020 & 2033
- Table 47: Russia Hearing Diagnostic Devices Revenue (billion) Forecast, by Application 2020 & 2033
- Table 48: Russia Hearing Diagnostic Devices Volume (K) Forecast, by Application 2020 & 2033
- Table 49: Benelux Hearing Diagnostic Devices Revenue (billion) Forecast, by Application 2020 & 2033
- Table 50: Benelux Hearing Diagnostic Devices Volume (K) Forecast, by Application 2020 & 2033
- Table 51: Nordics Hearing Diagnostic Devices Revenue (billion) Forecast, by Application 2020 & 2033
- Table 52: Nordics Hearing Diagnostic Devices Volume (K) Forecast, by Application 2020 & 2033
- Table 53: Rest of Europe Hearing Diagnostic Devices Revenue (billion) Forecast, by Application 2020 & 2033
- Table 54: Rest of Europe Hearing Diagnostic Devices Volume (K) Forecast, by Application 2020 & 2033
- Table 55: Global Hearing Diagnostic Devices Revenue billion Forecast, by Application 2020 & 2033
- Table 56: Global Hearing Diagnostic Devices Volume K Forecast, by Application 2020 & 2033
- Table 57: Global Hearing Diagnostic Devices Revenue billion Forecast, by Types 2020 & 2033
- Table 58: Global Hearing Diagnostic Devices Volume K Forecast, by Types 2020 & 2033
- Table 59: Global Hearing Diagnostic Devices Revenue billion Forecast, by Country 2020 & 2033
- Table 60: Global Hearing Diagnostic Devices Volume K Forecast, by Country 2020 & 2033
- Table 61: Turkey Hearing Diagnostic Devices Revenue (billion) Forecast, by Application 2020 & 2033
- Table 62: Turkey Hearing Diagnostic Devices Volume (K) Forecast, by Application 2020 & 2033
- Table 63: Israel Hearing Diagnostic Devices Revenue (billion) Forecast, by Application 2020 & 2033
- Table 64: Israel Hearing Diagnostic Devices Volume (K) Forecast, by Application 2020 & 2033
- Table 65: GCC Hearing Diagnostic Devices Revenue (billion) Forecast, by Application 2020 & 2033
- Table 66: GCC Hearing Diagnostic Devices Volume (K) Forecast, by Application 2020 & 2033
- Table 67: North Africa Hearing Diagnostic Devices Revenue (billion) Forecast, by Application 2020 & 2033
- Table 68: North Africa Hearing Diagnostic Devices Volume (K) Forecast, by Application 2020 & 2033
- Table 69: South Africa Hearing Diagnostic Devices Revenue (billion) Forecast, by Application 2020 & 2033
- Table 70: South Africa Hearing Diagnostic Devices Volume (K) Forecast, by Application 2020 & 2033
- Table 71: Rest of Middle East & Africa Hearing Diagnostic Devices Revenue (billion) Forecast, by Application 2020 & 2033
- Table 72: Rest of Middle East & Africa Hearing Diagnostic Devices Volume (K) Forecast, by Application 2020 & 2033
- Table 73: Global Hearing Diagnostic Devices Revenue billion Forecast, by Application 2020 & 2033
- Table 74: Global Hearing Diagnostic Devices Volume K Forecast, by Application 2020 & 2033
- Table 75: Global Hearing Diagnostic Devices Revenue billion Forecast, by Types 2020 & 2033
- Table 76: Global Hearing Diagnostic Devices Volume K Forecast, by Types 2020 & 2033
- Table 77: Global Hearing Diagnostic Devices Revenue billion Forecast, by Country 2020 & 2033
- Table 78: Global Hearing Diagnostic Devices Volume K Forecast, by Country 2020 & 2033
- Table 79: China Hearing Diagnostic Devices Revenue (billion) Forecast, by Application 2020 & 2033
- Table 80: China Hearing Diagnostic Devices Volume (K) Forecast, by Application 2020 & 2033
- Table 81: India Hearing Diagnostic Devices Revenue (billion) Forecast, by Application 2020 & 2033
- Table 82: India Hearing Diagnostic Devices Volume (K) Forecast, by Application 2020 & 2033
- Table 83: Japan Hearing Diagnostic Devices Revenue (billion) Forecast, by Application 2020 & 2033
- Table 84: Japan Hearing Diagnostic Devices Volume (K) Forecast, by Application 2020 & 2033
- Table 85: South Korea Hearing Diagnostic Devices Revenue (billion) Forecast, by Application 2020 & 2033
- Table 86: South Korea Hearing Diagnostic Devices Volume (K) Forecast, by Application 2020 & 2033
- Table 87: ASEAN Hearing Diagnostic Devices Revenue (billion) Forecast, by Application 2020 & 2033
- Table 88: ASEAN Hearing Diagnostic Devices Volume (K) Forecast, by Application 2020 & 2033
- Table 89: Oceania Hearing Diagnostic Devices Revenue (billion) Forecast, by Application 2020 & 2033
- Table 90: Oceania Hearing Diagnostic Devices Volume (K) Forecast, by Application 2020 & 2033
- Table 91: Rest of Asia Pacific Hearing Diagnostic Devices Revenue (billion) Forecast, by Application 2020 & 2033
- Table 92: Rest of Asia Pacific Hearing Diagnostic Devices Volume (K) Forecast, by Application 2020 & 2033
Frequently Asked Questions
1. What is the projected Compound Annual Growth Rate (CAGR) of the Hearing Diagnostic Devices?
The projected CAGR is approximately 7.05%.
2. Which companies are prominent players in the Hearing Diagnostic Devices?
Key companies in the market include William Demant, MAICO Diagnostics, Amplivox, Hill-Rom, Otometrics, Grason Stadler, Interacoustics, INVENTIS, RION, Natus Medical Incorporated.
3. What are the main segments of the Hearing Diagnostic Devices?
The market segments include Application, Types.
4. Can you provide details about the market size?
The market size is estimated to be USD 9.08 billion as of 2022.
5. What are some drivers contributing to market growth?
N/A
6. What are the notable trends driving market growth?
N/A
7. Are there any restraints impacting market growth?
N/A
8. Can you provide examples of recent developments in the market?
N/A
9. What pricing options are available for accessing the report?
Pricing options include single-user, multi-user, and enterprise licenses priced at USD 3950.00, USD 5925.00, and USD 7900.00 respectively.
10. Is the market size provided in terms of value or volume?
The market size is provided in terms of value, measured in billion and volume, measured in K.
11. Are there any specific market keywords associated with the report?
Yes, the market keyword associated with the report is "Hearing Diagnostic Devices," which aids in identifying and referencing the specific market segment covered.
12. How do I determine which pricing option suits my needs best?
The pricing options vary based on user requirements and access needs. Individual users may opt for single-user licenses, while businesses requiring broader access may choose multi-user or enterprise licenses for cost-effective access to the report.
13. Are there any additional resources or data provided in the Hearing Diagnostic Devices report?
While the report offers comprehensive insights, it's advisable to review the specific contents or supplementary materials provided to ascertain if additional resources or data are available.
14. How can I stay updated on further developments or reports in the Hearing Diagnostic Devices?
To stay informed about further developments, trends, and reports in the Hearing Diagnostic Devices, consider subscribing to industry newsletters, following relevant companies and organizations, or regularly checking reputable industry news sources and publications.
Methodology
Step 1 - Identification of Relevant Samples Size from Population Database


Step 2 - Approaches for Defining Global Market Size (Value, Volume* & Price*)

Note*: In applicable scenarios
Step 3 - Data Sources
Primary Research
- Web Analytics
- Survey Reports
- Research Institute
- Latest Research Reports
- Opinion Leaders
Secondary Research
- Annual Reports
- White Paper
- Latest Press Release
- Industry Association
- Paid Database
- Investor Presentations

Step 4 - Data Triangulation
Involves using different sources of information in order to increase the validity of a study
These sources are likely to be stakeholders in a program - participants, other researchers, program staff, other community members, and so on.
Then we put all data in single framework & apply various statistical tools to find out the dynamic on the market.
During the analysis stage, feedback from the stakeholder groups would be compared to determine areas of agreement as well as areas of divergence