

Key Insights
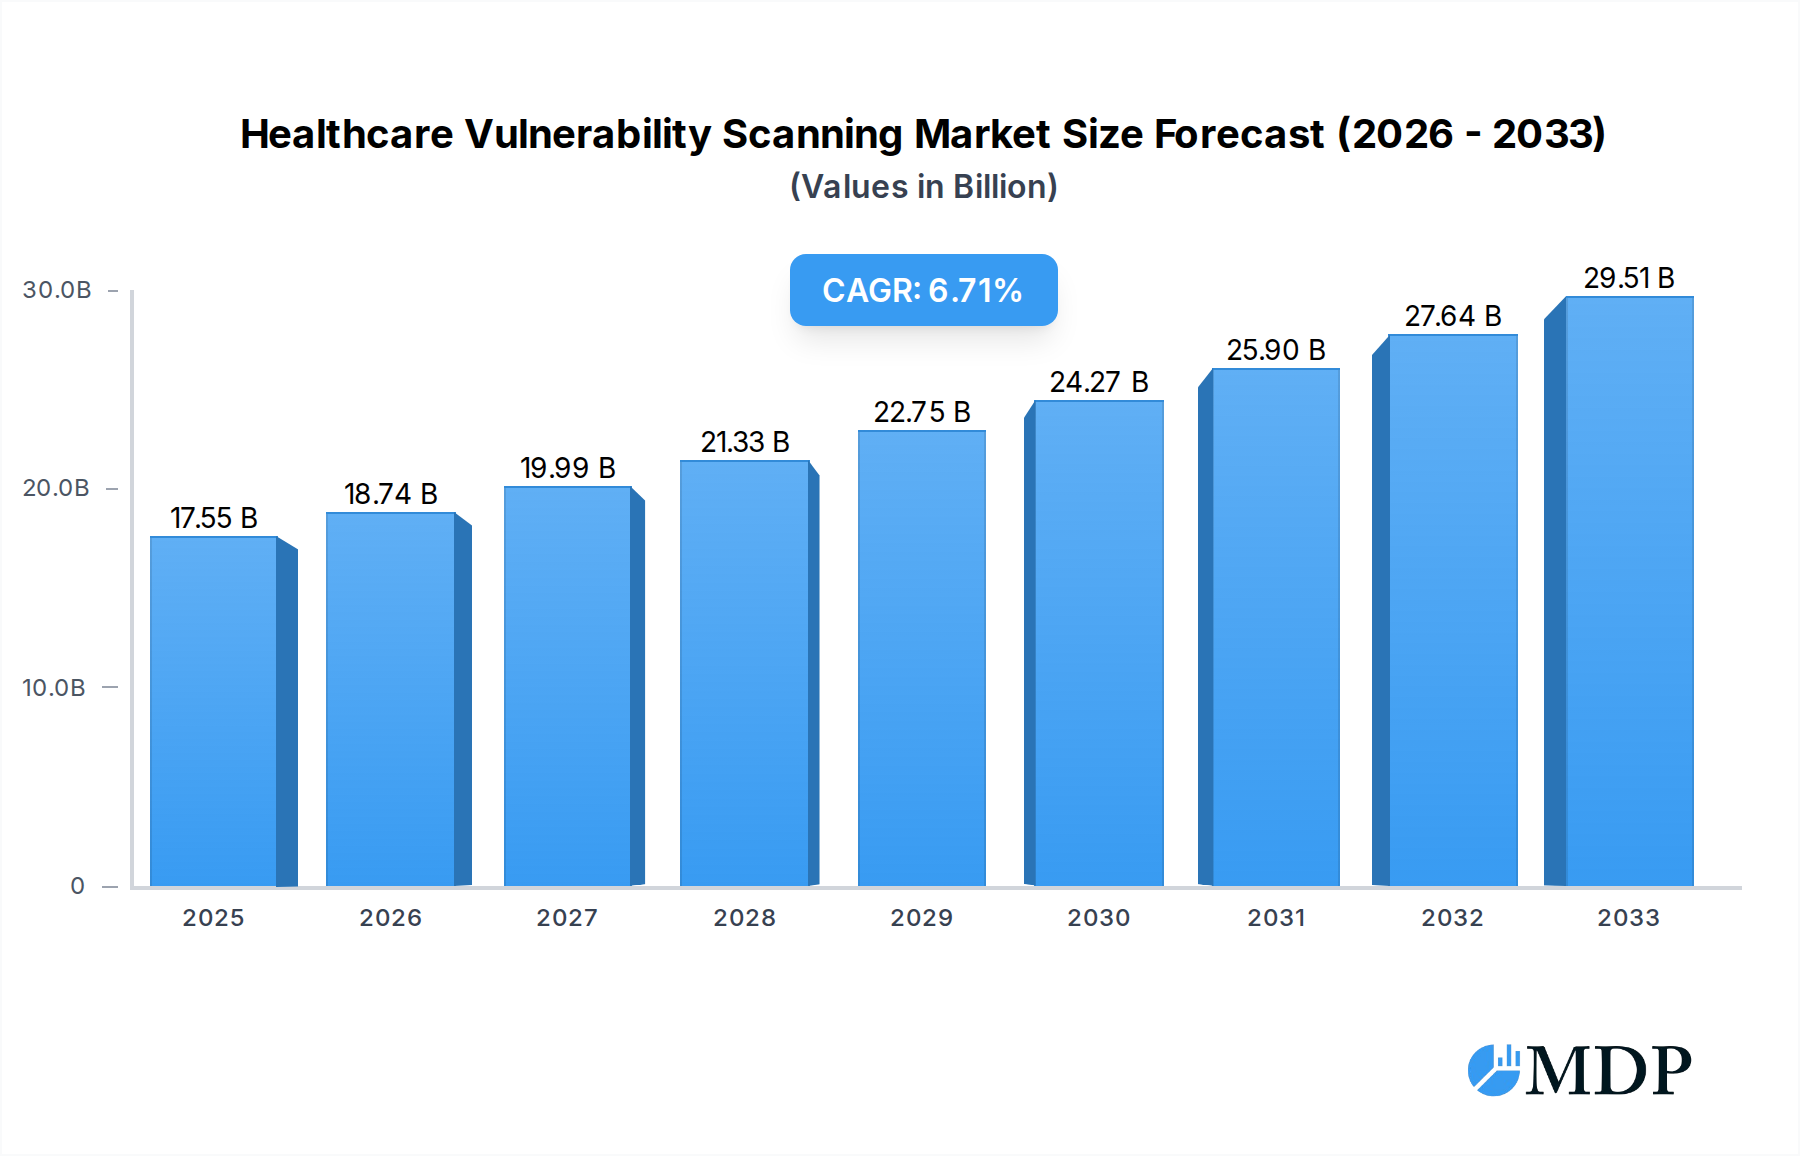
The global Healthcare Vulnerability Scanning market is poised for robust expansion, estimated to reach $17.55 billion in 2025, and is projected to grow at a substantial Compound Annual Growth Rate (CAGR) of 6.6% through 2033. This upward trajectory is driven by a confluence of critical factors, primarily the escalating need to safeguard sensitive patient data within the increasingly digitized healthcare ecosystem. The surge in cyberattacks targeting healthcare organizations, coupled with stringent regulatory mandates like HIPAA and GDPR, is compelling providers to invest heavily in advanced vulnerability scanning solutions. These solutions are crucial for identifying and mitigating potential security weaknesses before they can be exploited, thereby ensuring the integrity, confidentiality, and availability of electronic health records (EHRs) and other vital patient information. Furthermore, the growing adoption of telehealth, IoT devices in healthcare, and cloud-based platforms introduces new attack vectors, necessitating continuous and comprehensive vulnerability assessments.

Healthcare Vulnerability Scanning Market Size (In Billion)
The market is segmented by application, with Healthcare Providers and Hospitals emerging as the leading adopters, driven by the direct responsibility they bear for patient data security and operational continuity. Diagnostic Centers and Health Recovery Centres also represent significant segments, albeit with varying degrees of investment depending on their size and technological infrastructure. The "Others" category encompasses smaller clinics and research institutions that are increasingly recognizing the imperative of robust cybersecurity. In terms of types, both Software Type and Hardware Type solutions are crucial, with software offering advanced scanning capabilities and automation, while hardware provides specialized security appliances. The competitive landscape is characterized by the presence of established cybersecurity giants like Symantec, IBM, and Cisco, alongside specialized healthcare security vendors, all vying to offer comprehensive, scalable, and compliant vulnerability scanning solutions to meet the diverse needs of the healthcare industry.
Healthcare Vulnerability Scanning Company Market Share
Healthcare Vulnerability Scanning Market: A Comprehensive Analysis (2019-2033)
This in-depth report provides a billion-dollar analysis of the global Healthcare Vulnerability Scanning market, offering critical insights for industry stakeholders, cybersecurity professionals, and decision-makers. Covering the period from 2019 to 2033, with a base and estimated year of 2025, this report delves into market dynamics, industry trends, leading segments, product developments, growth drivers, challenges, emerging opportunities, key players, and strategic outlook. Leveraging high-traffic keywords and actionable intelligence, this report is designed to maximize search visibility and guide strategic planning in this rapidly evolving sector.
Healthcare Vulnerability Scanning Market Dynamics & Concentration
The Healthcare Vulnerability Scanning market, valued at approximately $20 billion in the base year 2025, exhibits a moderate level of concentration. Key innovation drivers include the escalating sophistication of cyber threats targeting sensitive patient data and the increasing adoption of connected medical devices and electronic health records (EHRs). Regulatory frameworks, such as HIPAA in the United States and GDPR in Europe, mandate robust security measures, significantly influencing market demand for effective vulnerability scanning solutions. Product substitutes, while present in the form of broader cybersecurity suites, often lack the specialized focus required for healthcare's unique regulatory and operational landscape. End-user trends indicate a growing reliance on cloud-based scanning solutions for scalability and cost-effectiveness, alongside a demand for automated and integrated vulnerability management platforms. Mergers and acquisitions (M&A) activity has been consistent, with an estimated 15 significant deals in the historical period (2019-2024), indicating consolidation and strategic expansion by leading players aiming to enhance their portfolios and market reach. Market share distribution shows a significant portion held by a few key players, with Symantec, Cisco, and IBM collectively accounting for an estimated 45% of the market.
Healthcare Vulnerability Scanning Industry Trends & Analysis
The global Healthcare Vulnerability Scanning market is projected for substantial growth, driven by the ever-present threat of data breaches and ransomware attacks within the healthcare sector. The projected Compound Annual Growth Rate (CAGR) for the forecast period 2025–2033 is an impressive 18.5%. Market penetration continues to rise as healthcare organizations increasingly recognize the indispensable nature of proactive security measures. Technological disruptions are at the forefront, with the integration of Artificial Intelligence (AI) and Machine Learning (ML) into scanning tools enabling more sophisticated threat detection and predictive analysis. The shift towards a more interconnected healthcare ecosystem, with the proliferation of the Internet of Medical Things (IoMT), presents new attack vectors that necessitate advanced vulnerability assessment capabilities. Consumer preferences are leaning towards solutions offering real-time monitoring, automated remediation workflows, and comprehensive compliance reporting. Competitive dynamics are characterized by intense innovation, with companies investing heavily in R&D to offer advanced features and superior threat intelligence. The estimated market size for 2025 stands at $22 billion, projected to reach over $80 billion by 2033. The increasing regulatory scrutiny and the rising cost of data breaches, which can amount to billions of dollars per incident for healthcare organizations, further fuel this market's expansion.
Leading Markets & Segments in Healthcare Vulnerability Scanning
The North America region currently dominates the Healthcare Vulnerability Scanning market, with the United States as its leading country, representing an estimated 40% of the global market share. This dominance is attributed to robust regulatory mandates, a high adoption rate of digital health technologies, and a greater awareness of cybersecurity risks among healthcare providers.
Key drivers for this regional dominance include:
- Stringent Regulatory Frameworks: HIPAA (Health Insurance Portability and Accountability Act) compliance remains a primary concern, forcing healthcare organizations to invest in comprehensive vulnerability management solutions.
- Technological Advigance and Adoption: The US healthcare system is at the forefront of adopting EHRs, telemedicine, and IoMT devices, creating a larger attack surface that necessitates advanced scanning capabilities.
- High Value of Protected Health Information (PHI): The immense value of PHI on the black market makes US healthcare organizations a prime target for cybercriminals, driving demand for proactive security measures.
- Significant Healthcare Spending: The substantial investment in healthcare infrastructure and services in the US translates to a larger budget allocation for cybersecurity solutions.
Within the Application segment, Healthcare Providers represent the largest market share, followed by Hospitals. This is due to their direct handling of patient data and the critical nature of their operations.
- Healthcare Providers: This segment encompasses a wide range of entities, including large hospital networks, clinics, and physician practices, all of which handle vast amounts of sensitive patient information.
- Hospitals: As central hubs for patient care, hospitals are critical infrastructure with complex IT environments and a high volume of data flow, making them prime targets and thus high spenders on vulnerability scanning.
- Healthcare Manufacturers and Healthcare Distributors also show significant growth, driven by the need to secure their supply chains and proprietary product information.
In terms of Types, the Software Type segment holds the predominant market share.
- Software Type: This includes vulnerability management platforms, network scanners, application security testing tools, and cloud-based security solutions. The flexibility, scalability, and continuous update capabilities of software solutions make them highly attractive.
- Hardware Type: While less dominant, hardware solutions such as dedicated security appliances and intrusion detection systems play a supporting role in comprehensive security architectures.
Healthcare Vulnerability Scanning Product Developments
Product innovation in Healthcare Vulnerability Scanning is rapidly advancing, focusing on AI-powered threat detection, automated remediation, and cloud-native solutions. Companies are developing integrated platforms that provide real-time visibility into an organization's attack surface, enabling proactive identification and mitigation of vulnerabilities before they can be exploited. Key competitive advantages lie in the ability to offer specialized scanning for IoMT devices, secure compliance with evolving healthcare regulations, and provide actionable intelligence to security teams. The market is witnessing a trend towards more intelligent, context-aware scanning that prioritizes risks based on potential impact to patient care and data integrity.
Key Drivers of Healthcare Vulnerability Scanning Growth
Several key factors are propelling the growth of the Healthcare Vulnerability Scanning market. The increasing volume and sophistication of cyberattacks targeting healthcare organizations, leading to data breaches and operational disruptions, are primary drivers. The growing adoption of interconnected medical devices (IoMT) and the expansion of telehealth services have created a significantly larger attack surface, demanding more robust scanning solutions. Furthermore, stringent regulatory mandates, such as HIPAA and GDPR, compel healthcare entities to implement and maintain effective vulnerability management programs. Economic factors, including the high cost of data breaches and the potential for reputational damage, further incentivize investment in proactive cybersecurity measures.
Challenges in the Healthcare Vulnerability Scanning Market
Despite the robust growth, the Healthcare Vulnerability Scanning market faces several challenges. Regulatory hurdles, including the complexity of interpreting and complying with evolving data privacy laws across different jurisdictions, can be a significant barrier. Supply chain issues, particularly concerning the secure integration of third-party medical devices and software, present ongoing vulnerabilities. Competitive pressures, while driving innovation, also lead to pricing challenges and the need for continuous investment in R&D to stay ahead of evolving threats. The sheer volume of data and the legacy IT infrastructure present in many healthcare organizations can also complicate the implementation and effectiveness of scanning solutions, leading to an estimated 10% increase in implementation costs due to legacy system integration.
Emerging Opportunities in Healthcare Vulnerability Scanning
Emerging opportunities in the Healthcare Vulnerability Scanning market are abundant, driven by continuous technological breakthroughs and strategic market expansion. The integration of advanced AI and machine learning for predictive threat intelligence offers a significant avenue for growth, enabling proactive identification of zero-day vulnerabilities. Strategic partnerships between cybersecurity firms and healthcare technology providers are crucial for developing specialized solutions tailored to the unique needs of the sector. The increasing adoption of cloud-based vulnerability management services presents opportunities for scalability and cost-effectiveness, particularly for smaller healthcare providers. Furthermore, the growing focus on patient safety and the ethical implications of data security are creating a demand for comprehensive and transparent vulnerability management solutions.
Leading Players in the Healthcare Vulnerability Scanning Sector
- Symantec
- Intel Security
- IBM
- Cisco
- Trend Micro
- Dell
- Check Point
- Juniper Networks
- Kaspersky
- Hewlett Packard
- Microsoft
- Huawei
- Palo Alto Networks
- FireEye
- AT&T Cybersecurity
- AVG Technologies
- Fortinet
- ESET
- Venustech
- H3C Technologies
- NSFOCUS
Key Milestones in Healthcare Vulnerability Scanning Industry
- 2019: Increased regulatory scrutiny on healthcare data protection post-GDPR implementation, driving demand for enhanced vulnerability scanning.
- 2020: Widespread adoption of remote work and telehealth due to the COVID-19 pandemic, leading to new cybersecurity challenges and increased focus on network vulnerability scanning.
- 2021: Major ransomware attacks targeting healthcare systems highlighted the critical need for robust vulnerability management and incident response capabilities.
- 2022: Advancements in AI and ML began to be integrated into vulnerability scanning tools for more intelligent threat detection.
- 2023: Growing concern over IoMT device security led to the development of specialized scanning solutions for connected medical equipment.
- 2024: Consolidation trends in the cybersecurity market continued, with strategic acquisitions aimed at expanding vulnerability scanning portfolios.
- 2025 (Estimated): Increased adoption of cloud-based vulnerability management platforms for enhanced scalability and cost-efficiency.
Strategic Outlook for Healthcare Vulnerability Scanning Market
The strategic outlook for the Healthcare Vulnerability Scanning market remains exceptionally strong, driven by sustained cyber threats and the digital transformation of healthcare. Future growth will be accelerated by the ongoing integration of AI and ML for proactive threat prediction and automated remediation, as well as the development of specialized solutions for IoMT and cloud environments. Strategic partnerships and a focus on compliance-driven security will be paramount. Companies that can offer comprehensive, integrated, and easily deployable vulnerability management solutions tailored to the unique needs of healthcare organizations will be best positioned to capture market share and drive innovation in this critical sector. The estimated market potential for strategic acquisitions and market expansion activities is projected to exceed $50 billion in the forecast period.
Healthcare Vulnerability Scanning Segmentation
-
1. Application
- 1.1. Healthcare Manufacturers
- 1.2. Healthcare Providers
- 1.3. Healthcare Distributors
- 1.4. Hospital
- 1.5. Diagnostics Center
- 1.6. Health Recovery Centre
- 1.7. Others
-
2. Types
- 2.1. Software Type
- 2.2. Hardware Type
Healthcare Vulnerability Scanning Segmentation By Geography
-
1. North America
- 1.1. United States
- 1.2. Canada
- 1.3. Mexico
-
2. South America
- 2.1. Brazil
- 2.2. Argentina
- 2.3. Rest of South America
-
3. Europe
- 3.1. United Kingdom
- 3.2. Germany
- 3.3. France
- 3.4. Italy
- 3.5. Spain
- 3.6. Russia
- 3.7. Benelux
- 3.8. Nordics
- 3.9. Rest of Europe
-
4. Middle East & Africa
- 4.1. Turkey
- 4.2. Israel
- 4.3. GCC
- 4.4. North Africa
- 4.5. South Africa
- 4.6. Rest of Middle East & Africa
-
5. Asia Pacific
- 5.1. China
- 5.2. India
- 5.3. Japan
- 5.4. South Korea
- 5.5. ASEAN
- 5.6. Oceania
- 5.7. Rest of Asia Pacific
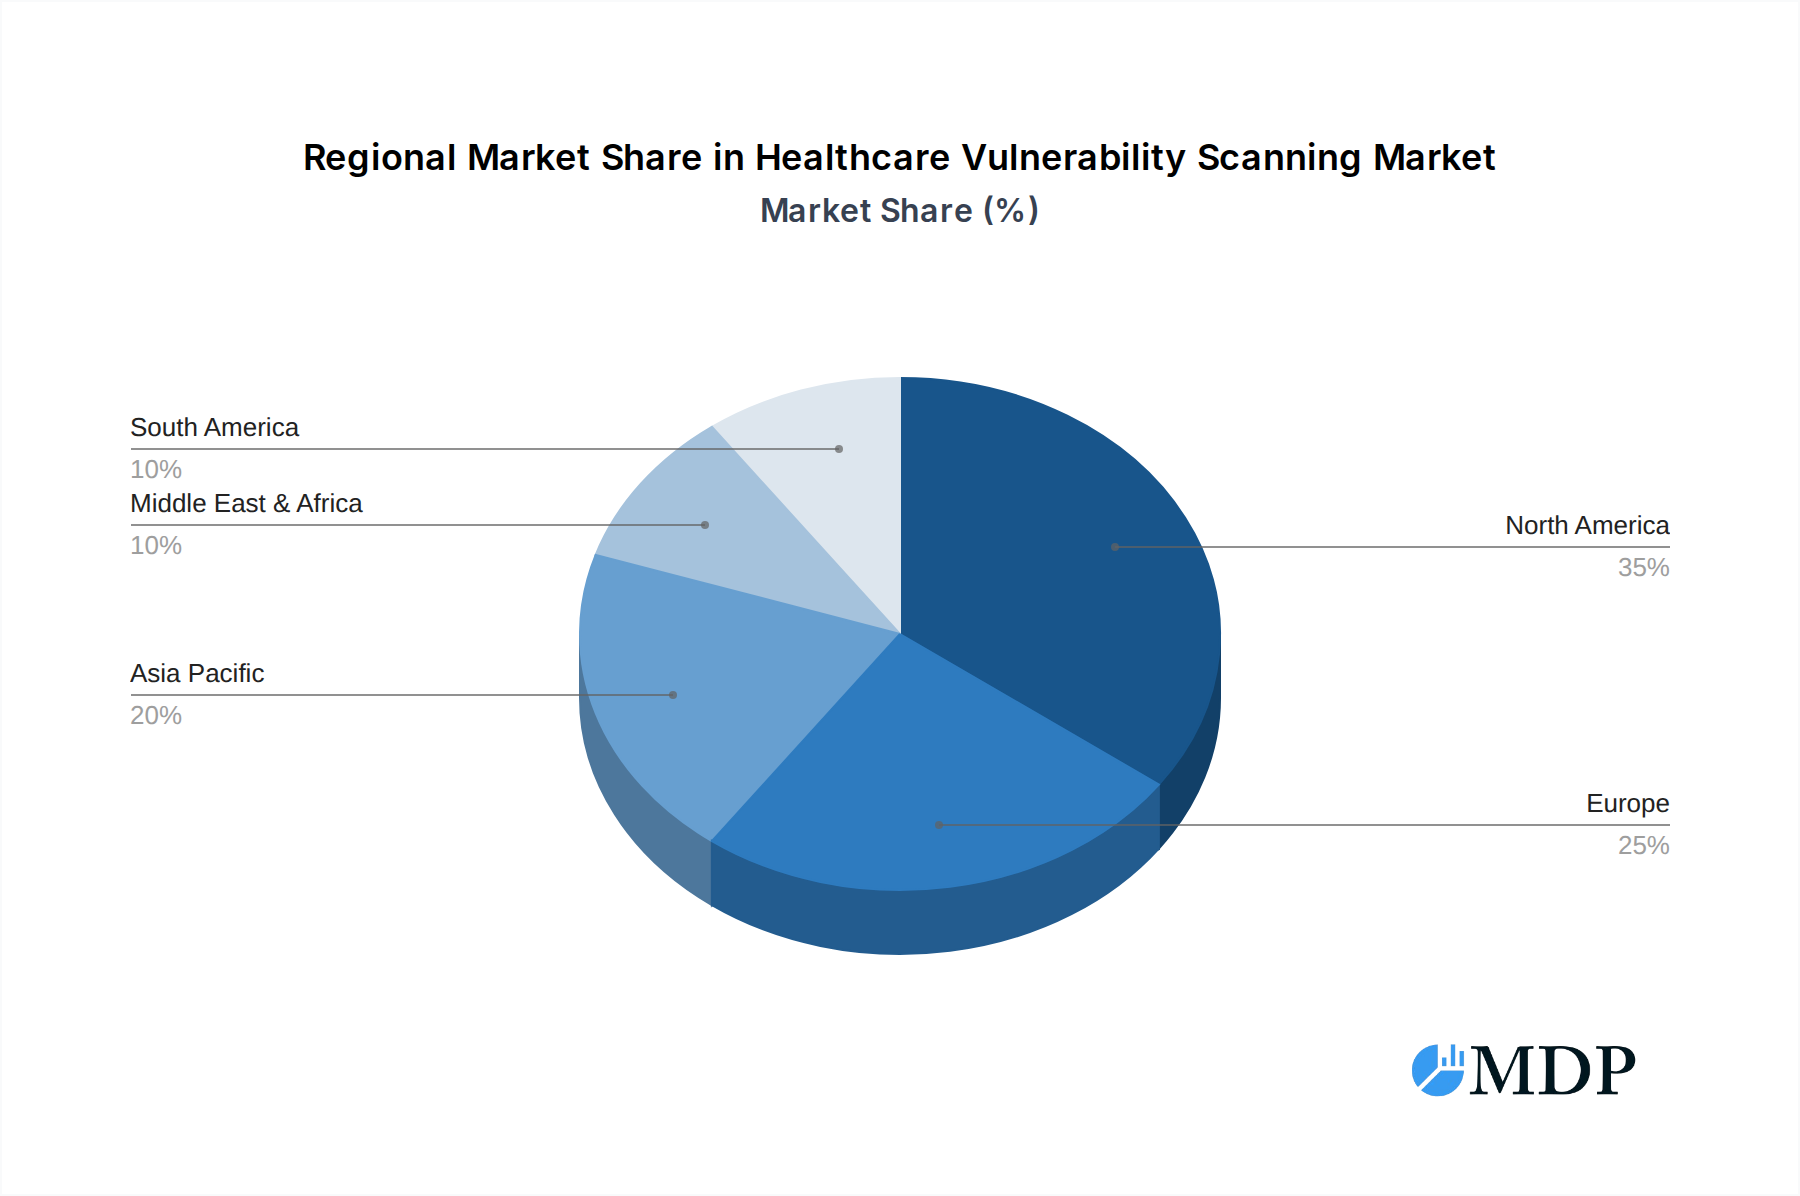
Healthcare Vulnerability Scanning Regional Market Share
Geographic Coverage of Healthcare Vulnerability Scanning
Healthcare Vulnerability Scanning REPORT HIGHLIGHTS
| Aspects | Details |
|---|---|
| Study Period | 2020-2034 |
| Base Year | 2025 |
| Estimated Year | 2026 |
| Forecast Period | 2026-2034 |
| Historical Period | 2020-2025 |
| Growth Rate | CAGR of 6.6% from 2020-2034 |
| Segmentation |
|
Table of Contents
- 1. Introduction
- 1.1. Research Scope
- 1.2. Market Segmentation
- 1.3. Research Methodology
- 1.4. Definitions and Assumptions
- 2. Executive Summary
- 2.1. Introduction
- 3. Market Dynamics
- 3.1. Introduction
- 3.2. Market Drivers
- 3.3. Market Restrains
- 3.4. Market Trends
- 4. Market Factor Analysis
- 4.1. Porters Five Forces
- 4.2. Supply/Value Chain
- 4.3. PESTEL analysis
- 4.4. Market Entropy
- 4.5. Patent/Trademark Analysis
- 5. Global Healthcare Vulnerability Scanning Analysis, Insights and Forecast, 2020-2032
- 5.1. Market Analysis, Insights and Forecast - by Application
- 5.1.1. Healthcare Manufacturers
- 5.1.2. Healthcare Providers
- 5.1.3. Healthcare Distributors
- 5.1.4. Hospital
- 5.1.5. Diagnostics Center
- 5.1.6. Health Recovery Centre
- 5.1.7. Others
- 5.2. Market Analysis, Insights and Forecast - by Types
- 5.2.1. Software Type
- 5.2.2. Hardware Type
- 5.3. Market Analysis, Insights and Forecast - by Region
- 5.3.1. North America
- 5.3.2. South America
- 5.3.3. Europe
- 5.3.4. Middle East & Africa
- 5.3.5. Asia Pacific
- 5.1. Market Analysis, Insights and Forecast - by Application
- 6. North America Healthcare Vulnerability Scanning Analysis, Insights and Forecast, 2020-2032
- 6.1. Market Analysis, Insights and Forecast - by Application
- 6.1.1. Healthcare Manufacturers
- 6.1.2. Healthcare Providers
- 6.1.3. Healthcare Distributors
- 6.1.4. Hospital
- 6.1.5. Diagnostics Center
- 6.1.6. Health Recovery Centre
- 6.1.7. Others
- 6.2. Market Analysis, Insights and Forecast - by Types
- 6.2.1. Software Type
- 6.2.2. Hardware Type
- 6.1. Market Analysis, Insights and Forecast - by Application
- 7. South America Healthcare Vulnerability Scanning Analysis, Insights and Forecast, 2020-2032
- 7.1. Market Analysis, Insights and Forecast - by Application
- 7.1.1. Healthcare Manufacturers
- 7.1.2. Healthcare Providers
- 7.1.3. Healthcare Distributors
- 7.1.4. Hospital
- 7.1.5. Diagnostics Center
- 7.1.6. Health Recovery Centre
- 7.1.7. Others
- 7.2. Market Analysis, Insights and Forecast - by Types
- 7.2.1. Software Type
- 7.2.2. Hardware Type
- 7.1. Market Analysis, Insights and Forecast - by Application
- 8. Europe Healthcare Vulnerability Scanning Analysis, Insights and Forecast, 2020-2032
- 8.1. Market Analysis, Insights and Forecast - by Application
- 8.1.1. Healthcare Manufacturers
- 8.1.2. Healthcare Providers
- 8.1.3. Healthcare Distributors
- 8.1.4. Hospital
- 8.1.5. Diagnostics Center
- 8.1.6. Health Recovery Centre
- 8.1.7. Others
- 8.2. Market Analysis, Insights and Forecast - by Types
- 8.2.1. Software Type
- 8.2.2. Hardware Type
- 8.1. Market Analysis, Insights and Forecast - by Application
- 9. Middle East & Africa Healthcare Vulnerability Scanning Analysis, Insights and Forecast, 2020-2032
- 9.1. Market Analysis, Insights and Forecast - by Application
- 9.1.1. Healthcare Manufacturers
- 9.1.2. Healthcare Providers
- 9.1.3. Healthcare Distributors
- 9.1.4. Hospital
- 9.1.5. Diagnostics Center
- 9.1.6. Health Recovery Centre
- 9.1.7. Others
- 9.2. Market Analysis, Insights and Forecast - by Types
- 9.2.1. Software Type
- 9.2.2. Hardware Type
- 9.1. Market Analysis, Insights and Forecast - by Application
- 10. Asia Pacific Healthcare Vulnerability Scanning Analysis, Insights and Forecast, 2020-2032
- 10.1. Market Analysis, Insights and Forecast - by Application
- 10.1.1. Healthcare Manufacturers
- 10.1.2. Healthcare Providers
- 10.1.3. Healthcare Distributors
- 10.1.4. Hospital
- 10.1.5. Diagnostics Center
- 10.1.6. Health Recovery Centre
- 10.1.7. Others
- 10.2. Market Analysis, Insights and Forecast - by Types
- 10.2.1. Software Type
- 10.2.2. Hardware Type
- 10.1. Market Analysis, Insights and Forecast - by Application
- 11. Competitive Analysis
- 11.1. Global Market Share Analysis 2025
- 11.2. Company Profiles
- 11.2.1 Symantec
- 11.2.1.1. Overview
- 11.2.1.2. Products
- 11.2.1.3. SWOT Analysis
- 11.2.1.4. Recent Developments
- 11.2.1.5. Financials (Based on Availability)
- 11.2.2 Intel Security
- 11.2.2.1. Overview
- 11.2.2.2. Products
- 11.2.2.3. SWOT Analysis
- 11.2.2.4. Recent Developments
- 11.2.2.5. Financials (Based on Availability)
- 11.2.3 IBM
- 11.2.3.1. Overview
- 11.2.3.2. Products
- 11.2.3.3. SWOT Analysis
- 11.2.3.4. Recent Developments
- 11.2.3.5. Financials (Based on Availability)
- 11.2.4 Cisco
- 11.2.4.1. Overview
- 11.2.4.2. Products
- 11.2.4.3. SWOT Analysis
- 11.2.4.4. Recent Developments
- 11.2.4.5. Financials (Based on Availability)
- 11.2.5 Trend Micro
- 11.2.5.1. Overview
- 11.2.5.2. Products
- 11.2.5.3. SWOT Analysis
- 11.2.5.4. Recent Developments
- 11.2.5.5. Financials (Based on Availability)
- 11.2.6 Dell
- 11.2.6.1. Overview
- 11.2.6.2. Products
- 11.2.6.3. SWOT Analysis
- 11.2.6.4. Recent Developments
- 11.2.6.5. Financials (Based on Availability)
- 11.2.7 Check Point
- 11.2.7.1. Overview
- 11.2.7.2. Products
- 11.2.7.3. SWOT Analysis
- 11.2.7.4. Recent Developments
- 11.2.7.5. Financials (Based on Availability)
- 11.2.8 Juniper Networks
- 11.2.8.1. Overview
- 11.2.8.2. Products
- 11.2.8.3. SWOT Analysis
- 11.2.8.4. Recent Developments
- 11.2.8.5. Financials (Based on Availability)
- 11.2.9 Kaspersky
- 11.2.9.1. Overview
- 11.2.9.2. Products
- 11.2.9.3. SWOT Analysis
- 11.2.9.4. Recent Developments
- 11.2.9.5. Financials (Based on Availability)
- 11.2.10 Hewlett Packard
- 11.2.10.1. Overview
- 11.2.10.2. Products
- 11.2.10.3. SWOT Analysis
- 11.2.10.4. Recent Developments
- 11.2.10.5. Financials (Based on Availability)
- 11.2.11 Microsoft
- 11.2.11.1. Overview
- 11.2.11.2. Products
- 11.2.11.3. SWOT Analysis
- 11.2.11.4. Recent Developments
- 11.2.11.5. Financials (Based on Availability)
- 11.2.12 Huawei
- 11.2.12.1. Overview
- 11.2.12.2. Products
- 11.2.12.3. SWOT Analysis
- 11.2.12.4. Recent Developments
- 11.2.12.5. Financials (Based on Availability)
- 11.2.13 Palo Alto Networks
- 11.2.13.1. Overview
- 11.2.13.2. Products
- 11.2.13.3. SWOT Analysis
- 11.2.13.4. Recent Developments
- 11.2.13.5. Financials (Based on Availability)
- 11.2.14 FireEye
- 11.2.14.1. Overview
- 11.2.14.2. Products
- 11.2.14.3. SWOT Analysis
- 11.2.14.4. Recent Developments
- 11.2.14.5. Financials (Based on Availability)
- 11.2.15 AT&T Cybersecurity
- 11.2.15.1. Overview
- 11.2.15.2. Products
- 11.2.15.3. SWOT Analysis
- 11.2.15.4. Recent Developments
- 11.2.15.5. Financials (Based on Availability)
- 11.2.16 AVG Technologies
- 11.2.16.1. Overview
- 11.2.16.2. Products
- 11.2.16.3. SWOT Analysis
- 11.2.16.4. Recent Developments
- 11.2.16.5. Financials (Based on Availability)
- 11.2.17 Fortinet
- 11.2.17.1. Overview
- 11.2.17.2. Products
- 11.2.17.3. SWOT Analysis
- 11.2.17.4. Recent Developments
- 11.2.17.5. Financials (Based on Availability)
- 11.2.18 ESET
- 11.2.18.1. Overview
- 11.2.18.2. Products
- 11.2.18.3. SWOT Analysis
- 11.2.18.4. Recent Developments
- 11.2.18.5. Financials (Based on Availability)
- 11.2.19 Venustech
- 11.2.19.1. Overview
- 11.2.19.2. Products
- 11.2.19.3. SWOT Analysis
- 11.2.19.4. Recent Developments
- 11.2.19.5. Financials (Based on Availability)
- 11.2.20 H3C Technologies
- 11.2.20.1. Overview
- 11.2.20.2. Products
- 11.2.20.3. SWOT Analysis
- 11.2.20.4. Recent Developments
- 11.2.20.5. Financials (Based on Availability)
- 11.2.21 NSFOCUS
- 11.2.21.1. Overview
- 11.2.21.2. Products
- 11.2.21.3. SWOT Analysis
- 11.2.21.4. Recent Developments
- 11.2.21.5. Financials (Based on Availability)
- 11.2.1 Symantec
List of Figures
- Figure 1: Global Healthcare Vulnerability Scanning Revenue Breakdown (undefined, %) by Region 2025 & 2033
- Figure 2: North America Healthcare Vulnerability Scanning Revenue (undefined), by Application 2025 & 2033
- Figure 3: North America Healthcare Vulnerability Scanning Revenue Share (%), by Application 2025 & 2033
- Figure 4: North America Healthcare Vulnerability Scanning Revenue (undefined), by Types 2025 & 2033
- Figure 5: North America Healthcare Vulnerability Scanning Revenue Share (%), by Types 2025 & 2033
- Figure 6: North America Healthcare Vulnerability Scanning Revenue (undefined), by Country 2025 & 2033
- Figure 7: North America Healthcare Vulnerability Scanning Revenue Share (%), by Country 2025 & 2033
- Figure 8: South America Healthcare Vulnerability Scanning Revenue (undefined), by Application 2025 & 2033
- Figure 9: South America Healthcare Vulnerability Scanning Revenue Share (%), by Application 2025 & 2033
- Figure 10: South America Healthcare Vulnerability Scanning Revenue (undefined), by Types 2025 & 2033
- Figure 11: South America Healthcare Vulnerability Scanning Revenue Share (%), by Types 2025 & 2033
- Figure 12: South America Healthcare Vulnerability Scanning Revenue (undefined), by Country 2025 & 2033
- Figure 13: South America Healthcare Vulnerability Scanning Revenue Share (%), by Country 2025 & 2033
- Figure 14: Europe Healthcare Vulnerability Scanning Revenue (undefined), by Application 2025 & 2033
- Figure 15: Europe Healthcare Vulnerability Scanning Revenue Share (%), by Application 2025 & 2033
- Figure 16: Europe Healthcare Vulnerability Scanning Revenue (undefined), by Types 2025 & 2033
- Figure 17: Europe Healthcare Vulnerability Scanning Revenue Share (%), by Types 2025 & 2033
- Figure 18: Europe Healthcare Vulnerability Scanning Revenue (undefined), by Country 2025 & 2033
- Figure 19: Europe Healthcare Vulnerability Scanning Revenue Share (%), by Country 2025 & 2033
- Figure 20: Middle East & Africa Healthcare Vulnerability Scanning Revenue (undefined), by Application 2025 & 2033
- Figure 21: Middle East & Africa Healthcare Vulnerability Scanning Revenue Share (%), by Application 2025 & 2033
- Figure 22: Middle East & Africa Healthcare Vulnerability Scanning Revenue (undefined), by Types 2025 & 2033
- Figure 23: Middle East & Africa Healthcare Vulnerability Scanning Revenue Share (%), by Types 2025 & 2033
- Figure 24: Middle East & Africa Healthcare Vulnerability Scanning Revenue (undefined), by Country 2025 & 2033
- Figure 25: Middle East & Africa Healthcare Vulnerability Scanning Revenue Share (%), by Country 2025 & 2033
- Figure 26: Asia Pacific Healthcare Vulnerability Scanning Revenue (undefined), by Application 2025 & 2033
- Figure 27: Asia Pacific Healthcare Vulnerability Scanning Revenue Share (%), by Application 2025 & 2033
- Figure 28: Asia Pacific Healthcare Vulnerability Scanning Revenue (undefined), by Types 2025 & 2033
- Figure 29: Asia Pacific Healthcare Vulnerability Scanning Revenue Share (%), by Types 2025 & 2033
- Figure 30: Asia Pacific Healthcare Vulnerability Scanning Revenue (undefined), by Country 2025 & 2033
- Figure 31: Asia Pacific Healthcare Vulnerability Scanning Revenue Share (%), by Country 2025 & 2033
List of Tables
- Table 1: Global Healthcare Vulnerability Scanning Revenue undefined Forecast, by Application 2020 & 2033
- Table 2: Global Healthcare Vulnerability Scanning Revenue undefined Forecast, by Types 2020 & 2033
- Table 3: Global Healthcare Vulnerability Scanning Revenue undefined Forecast, by Region 2020 & 2033
- Table 4: Global Healthcare Vulnerability Scanning Revenue undefined Forecast, by Application 2020 & 2033
- Table 5: Global Healthcare Vulnerability Scanning Revenue undefined Forecast, by Types 2020 & 2033
- Table 6: Global Healthcare Vulnerability Scanning Revenue undefined Forecast, by Country 2020 & 2033
- Table 7: United States Healthcare Vulnerability Scanning Revenue (undefined) Forecast, by Application 2020 & 2033
- Table 8: Canada Healthcare Vulnerability Scanning Revenue (undefined) Forecast, by Application 2020 & 2033
- Table 9: Mexico Healthcare Vulnerability Scanning Revenue (undefined) Forecast, by Application 2020 & 2033
- Table 10: Global Healthcare Vulnerability Scanning Revenue undefined Forecast, by Application 2020 & 2033
- Table 11: Global Healthcare Vulnerability Scanning Revenue undefined Forecast, by Types 2020 & 2033
- Table 12: Global Healthcare Vulnerability Scanning Revenue undefined Forecast, by Country 2020 & 2033
- Table 13: Brazil Healthcare Vulnerability Scanning Revenue (undefined) Forecast, by Application 2020 & 2033
- Table 14: Argentina Healthcare Vulnerability Scanning Revenue (undefined) Forecast, by Application 2020 & 2033
- Table 15: Rest of South America Healthcare Vulnerability Scanning Revenue (undefined) Forecast, by Application 2020 & 2033
- Table 16: Global Healthcare Vulnerability Scanning Revenue undefined Forecast, by Application 2020 & 2033
- Table 17: Global Healthcare Vulnerability Scanning Revenue undefined Forecast, by Types 2020 & 2033
- Table 18: Global Healthcare Vulnerability Scanning Revenue undefined Forecast, by Country 2020 & 2033
- Table 19: United Kingdom Healthcare Vulnerability Scanning Revenue (undefined) Forecast, by Application 2020 & 2033
- Table 20: Germany Healthcare Vulnerability Scanning Revenue (undefined) Forecast, by Application 2020 & 2033
- Table 21: France Healthcare Vulnerability Scanning Revenue (undefined) Forecast, by Application 2020 & 2033
- Table 22: Italy Healthcare Vulnerability Scanning Revenue (undefined) Forecast, by Application 2020 & 2033
- Table 23: Spain Healthcare Vulnerability Scanning Revenue (undefined) Forecast, by Application 2020 & 2033
- Table 24: Russia Healthcare Vulnerability Scanning Revenue (undefined) Forecast, by Application 2020 & 2033
- Table 25: Benelux Healthcare Vulnerability Scanning Revenue (undefined) Forecast, by Application 2020 & 2033
- Table 26: Nordics Healthcare Vulnerability Scanning Revenue (undefined) Forecast, by Application 2020 & 2033
- Table 27: Rest of Europe Healthcare Vulnerability Scanning Revenue (undefined) Forecast, by Application 2020 & 2033
- Table 28: Global Healthcare Vulnerability Scanning Revenue undefined Forecast, by Application 2020 & 2033
- Table 29: Global Healthcare Vulnerability Scanning Revenue undefined Forecast, by Types 2020 & 2033
- Table 30: Global Healthcare Vulnerability Scanning Revenue undefined Forecast, by Country 2020 & 2033
- Table 31: Turkey Healthcare Vulnerability Scanning Revenue (undefined) Forecast, by Application 2020 & 2033
- Table 32: Israel Healthcare Vulnerability Scanning Revenue (undefined) Forecast, by Application 2020 & 2033
- Table 33: GCC Healthcare Vulnerability Scanning Revenue (undefined) Forecast, by Application 2020 & 2033
- Table 34: North Africa Healthcare Vulnerability Scanning Revenue (undefined) Forecast, by Application 2020 & 2033
- Table 35: South Africa Healthcare Vulnerability Scanning Revenue (undefined) Forecast, by Application 2020 & 2033
- Table 36: Rest of Middle East & Africa Healthcare Vulnerability Scanning Revenue (undefined) Forecast, by Application 2020 & 2033
- Table 37: Global Healthcare Vulnerability Scanning Revenue undefined Forecast, by Application 2020 & 2033
- Table 38: Global Healthcare Vulnerability Scanning Revenue undefined Forecast, by Types 2020 & 2033
- Table 39: Global Healthcare Vulnerability Scanning Revenue undefined Forecast, by Country 2020 & 2033
- Table 40: China Healthcare Vulnerability Scanning Revenue (undefined) Forecast, by Application 2020 & 2033
- Table 41: India Healthcare Vulnerability Scanning Revenue (undefined) Forecast, by Application 2020 & 2033
- Table 42: Japan Healthcare Vulnerability Scanning Revenue (undefined) Forecast, by Application 2020 & 2033
- Table 43: South Korea Healthcare Vulnerability Scanning Revenue (undefined) Forecast, by Application 2020 & 2033
- Table 44: ASEAN Healthcare Vulnerability Scanning Revenue (undefined) Forecast, by Application 2020 & 2033
- Table 45: Oceania Healthcare Vulnerability Scanning Revenue (undefined) Forecast, by Application 2020 & 2033
- Table 46: Rest of Asia Pacific Healthcare Vulnerability Scanning Revenue (undefined) Forecast, by Application 2020 & 2033
Frequently Asked Questions
1. What is the projected Compound Annual Growth Rate (CAGR) of the Healthcare Vulnerability Scanning?
The projected CAGR is approximately 6.6%.
2. Which companies are prominent players in the Healthcare Vulnerability Scanning?
Key companies in the market include Symantec, Intel Security, IBM, Cisco, Trend Micro, Dell, Check Point, Juniper Networks, Kaspersky, Hewlett Packard, Microsoft, Huawei, Palo Alto Networks, FireEye, AT&T Cybersecurity, AVG Technologies, Fortinet, ESET, Venustech, H3C Technologies, NSFOCUS.
3. What are the main segments of the Healthcare Vulnerability Scanning?
The market segments include Application, Types.
4. Can you provide details about the market size?
The market size is estimated to be USD XXX N/A as of 2022.
5. What are some drivers contributing to market growth?
N/A
6. What are the notable trends driving market growth?
N/A
7. Are there any restraints impacting market growth?
N/A
8. Can you provide examples of recent developments in the market?
N/A
9. What pricing options are available for accessing the report?
Pricing options include single-user, multi-user, and enterprise licenses priced at USD 4900.00, USD 7350.00, and USD 9800.00 respectively.
10. Is the market size provided in terms of value or volume?
The market size is provided in terms of value, measured in N/A.
11. Are there any specific market keywords associated with the report?
Yes, the market keyword associated with the report is "Healthcare Vulnerability Scanning," which aids in identifying and referencing the specific market segment covered.
12. How do I determine which pricing option suits my needs best?
The pricing options vary based on user requirements and access needs. Individual users may opt for single-user licenses, while businesses requiring broader access may choose multi-user or enterprise licenses for cost-effective access to the report.
13. Are there any additional resources or data provided in the Healthcare Vulnerability Scanning report?
While the report offers comprehensive insights, it's advisable to review the specific contents or supplementary materials provided to ascertain if additional resources or data are available.
14. How can I stay updated on further developments or reports in the Healthcare Vulnerability Scanning?
To stay informed about further developments, trends, and reports in the Healthcare Vulnerability Scanning, consider subscribing to industry newsletters, following relevant companies and organizations, or regularly checking reputable industry news sources and publications.
Methodology
Step 1 - Identification of Relevant Samples Size from Population Database


Step 2 - Approaches for Defining Global Market Size (Value, Volume* & Price*)

Note*: In applicable scenarios
Step 3 - Data Sources
Primary Research
- Web Analytics
- Survey Reports
- Research Institute
- Latest Research Reports
- Opinion Leaders
Secondary Research
- Annual Reports
- White Paper
- Latest Press Release
- Industry Association
- Paid Database
- Investor Presentations

Step 4 - Data Triangulation
Involves using different sources of information in order to increase the validity of a study
These sources are likely to be stakeholders in a program - participants, other researchers, program staff, other community members, and so on.
Then we put all data in single framework & apply various statistical tools to find out the dynamic on the market.
During the analysis stage, feedback from the stakeholder groups would be compared to determine areas of agreement as well as areas of divergence