

Key Insights
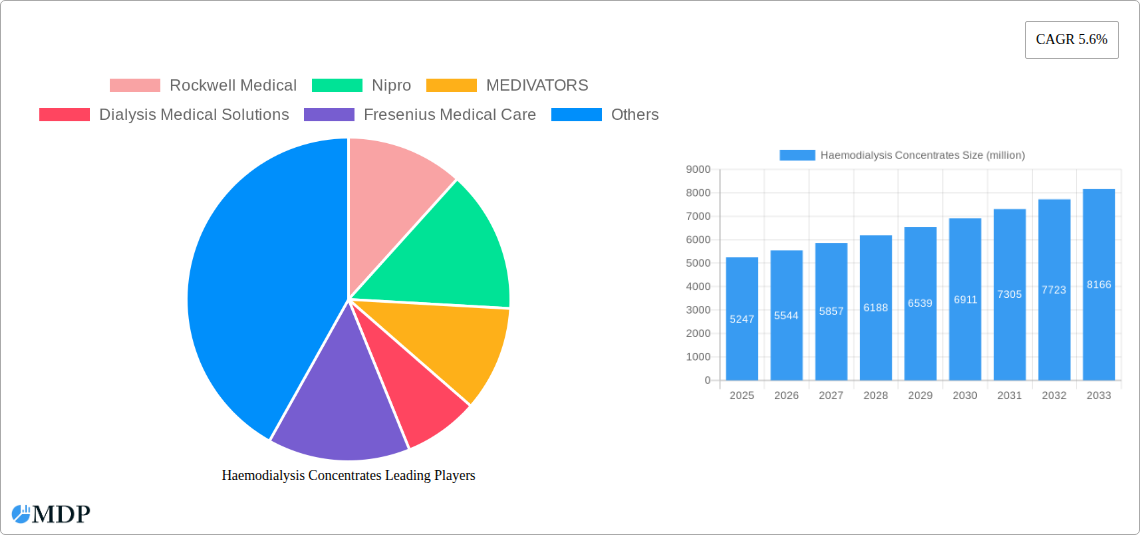
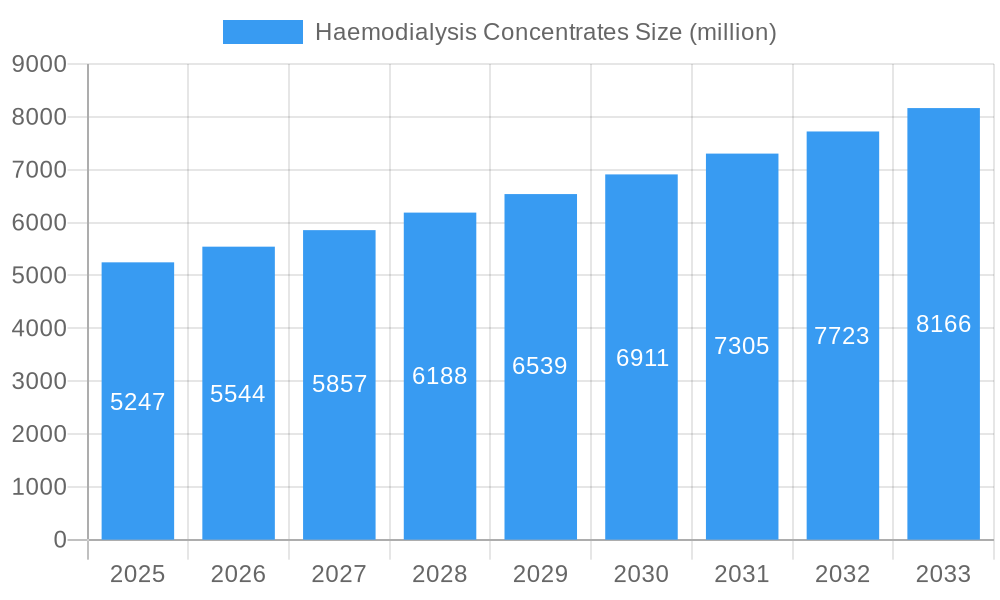
The global Haemodialysis Concentrates market is poised for robust growth, projected to reach an estimated $5247 million by 2025, exhibiting a Compound Annual Growth Rate (CAGR) of 5.6% through 2033. This expansion is primarily fueled by the increasing prevalence of chronic kidney disease (CKD) and end-stage renal disease (ESRD) worldwide, necessitating a greater demand for haemodialysis. Furthermore, advancements in dialysis technology and the growing adoption of home haemodialysis are significant drivers, offering greater convenience and improved patient outcomes. The market is segmented into key applications, including Dialysis Centers and Home Dialysis, with Dialysis Centers currently holding a dominant share due to established infrastructure and higher patient volumes. However, the Home Dialysis segment is anticipated to witness accelerated growth as patient preference shifts towards more personalized and accessible treatment options.
Haemodialysis Concentrates Market Size (In Billion)
The market's trajectory is also influenced by supportive government initiatives aimed at improving kidney care access and affordability, alongside a rising awareness regarding the importance of timely diagnosis and treatment of kidney ailments. Key trends include the development of specialized haemodialysis concentrates tailored to specific patient needs, such as those with diabetes-related CKD, and a focus on enhancing the safety and efficacy of these solutions. While the market benefits from strong demand, potential restraints such as stringent regulatory approvals for new product formulations and the high cost of advanced dialysis equipment could pose challenges. Despite these, the sustained increase in the aging population, a demographic highly susceptible to kidney-related conditions, coupled with ongoing innovation from leading companies like Fresenius Medical Care, Baxter, and B. Braun, will continue to propel the Haemodialysis Concentrates market forward.
Haemodialysis Concentrates Company Market Share
Unlocking the Future of Renal Care: A Comprehensive Report on the Haemodialysis Concentrates Market
This in-depth market research report provides a definitive analysis of the global Haemodialysis Concentrates market, a critical component in the treatment of chronic kidney disease (CKD) and end-stage renal disease (ESRD). Spanning a comprehensive study period from 2019 to 2033, with a base year of 2025 and a detailed forecast period of 2025–2033, this report offers unparalleled insights into market dynamics, key trends, leading players, and future opportunities. With an estimated xx million market size in 2025, this report is essential for stakeholders seeking to navigate the evolving landscape of dialysis solutions.
Haemodialysis Concentrates Market Dynamics & Concentration
The Haemodialysis Concentrates market exhibits a moderately concentrated landscape, with key players like Fresenius Medical Care and Baxter holding significant market share, estimated at over 30% combined in 2024. Innovation drivers are primarily focused on enhancing patient safety, optimizing dialysate composition for improved patient outcomes, and developing more cost-effective solutions. Regulatory frameworks, such as stringent FDA approvals and European CE marking, play a crucial role in market entry and product development. Product substitutes are limited, with the primary alternative being peritoneal dialysis, but haemodialysis remains the predominant modality for a vast patient population. End-user trends indicate a growing demand for home dialysis solutions, requiring specialized concentrate formulations. Merger and acquisition activities are observed, with an estimated 15 M&A deals in the historical period (2019-2024), indicating strategic consolidation and expansion by major players.
Haemodialysis Concentrates Industry Trends & Analysis
The global Haemodialysis Concentrates market is projected for robust growth, driven by an increasing prevalence of chronic kidney disease worldwide. Factors such as an aging global population, rising rates of diabetes and hypertension – key contributors to kidney failure – and advancements in dialysis technology are significantly fueling market expansion. The compound annual growth rate (CAGR) is estimated at xx% during the forecast period. Technological disruptions are emerging in the form of personalized dialysate formulations, novel concentrate ingredients offering enhanced therapeutic benefits, and improved concentrate delivery systems to minimize errors and streamline workflows in dialysis centers. Consumer preferences are leaning towards increased patient comfort, reduced side effects, and greater autonomy, leading to a surge in demand for home haemodialysis solutions, which is projected to achieve xx% market penetration by 2033. Competitive dynamics are characterized by a blend of established global manufacturers and emerging regional players, each vying for market share through product innovation, strategic partnerships, and competitive pricing. The market penetration of advanced haemodialysis concentrates is steadily increasing, reflecting a growing awareness and adoption of premium products offering superior efficacy and safety profiles.
Leading Markets & Segments in Haemodialysis Concentrates
The Dialysis Center segment is the dominant application within the haemodialysis concentrates market, accounting for an estimated xx% of the total market value in 2025. This dominance is driven by the established infrastructure and widespread availability of dialysis centers globally, catering to the majority of haemodialysis patients. Within regions, North America is a leading market, projected to hold a xx% market share in 2025, owing to high CKD prevalence, advanced healthcare systems, and significant healthcare expenditure.
Dominance Drivers in Dialysis Centers:
- High Patient Volume: The sheer number of patients requiring haemodialysis treatment in clinical settings.
- Technological Integration: Dialysis centers are early adopters of advanced haemodialysis machines and concentrate delivery systems.
- Reimbursement Policies: Favorable reimbursement structures for dialysis treatments in developed nations.
- Skilled Workforce: Availability of trained nephrologists and dialysis technicians.
Dominance Drivers in North America:
- Prevalence of Chronic Diseases: High rates of diabetes and hypertension, primary causes of ESRD.
- Healthcare Expenditure: Robust healthcare spending, enabling access to advanced treatments.
- Technological Advancements: Early adoption and development of innovative dialysis technologies.
- Government Initiatives: Public health programs focused on managing chronic diseases.
Among concentrate types, Bicarbonate Concentrates are estimated to capture a larger market share, approximately xx% in 2025, due to their widespread use in standard haemodialysis protocols for buffering acid-base imbalances. However, the Home Dialysis segment for both bicarbonate and acid concentrates is witnessing significant growth, driven by patient preference for convenience and reduced healthcare costs.
Haemodialysis Concentrates Product Developments
Recent product developments in the haemodialysis concentrates market focus on enhancing patient safety and efficacy. Innovations include the introduction of hypertonic and hypotonic concentrates tailored to specific patient needs, as well as concentrates incorporating novel electrolyte compositions for improved uraemic toxin removal and electrolyte balance. Companies are also developing ready-to-use, single-bag concentrates to minimize preparation errors in dialysis centers and home settings. These advancements offer competitive advantages by improving patient outcomes, reducing the risk of complications, and streamlining the dialysis process, thus meeting the evolving demands of the healthcare industry.
Key Drivers of Haemodialysis Concentrates Growth
Several key factors are propelling the growth of the haemodialysis concentrates market. The escalating global burden of chronic kidney disease, fueled by an aging population and the rising incidence of lifestyle-related diseases like diabetes and hypertension, directly translates to an increased demand for dialysis treatments. Advancements in medical technology are leading to more sophisticated haemodialysis machines and dialysate formulations, improving patient outcomes and driving the adoption of premium concentrate products. Furthermore, favorable government initiatives and reimbursement policies in many countries are supporting access to dialysis care, thus expanding the market. The growing preference for home haemodialysis solutions also presents a significant growth catalyst, necessitating the development and distribution of specialized, user-friendly concentrates.
Challenges in the Haemodialysis Concentrates Market
The haemodialysis concentrates market faces several challenges that can impede its growth trajectory. Stringent regulatory approvals for new concentrate formulations and manufacturing processes can lead to extended product development timelines and increased costs. Supply chain disruptions, particularly in sourcing raw materials and ensuring timely delivery of concentrates, pose a significant risk, especially in the wake of global health crises. Intense competition among manufacturers can lead to price pressures, impacting profit margins. Moreover, the need for specialized training for healthcare professionals and patients in home dialysis settings can create adoption barriers for advanced concentrate systems, requiring continuous educational efforts to overcome.
Emerging Opportunities in Haemodialysis Concentrates
Emerging opportunities in the haemodialysis concentrates market are primarily driven by technological breakthroughs and evolving patient care models. The development of personalized dialysate solutions tailored to individual patient metabolic profiles and comorbidities represents a significant frontier. Advancements in nanotechnology and drug delivery systems could lead to concentrates with enhanced therapeutic functionalities, such as targeted drug delivery during dialysis. Strategic partnerships between concentrate manufacturers and dialysis equipment providers can foster integrated solutions that optimize the entire dialysis process. Furthermore, expansion into emerging economies with increasing healthcare access and rising CKD prevalence presents substantial market growth potential, requiring localized product development and distribution strategies.
Leading Players in the Haemodialysis Concentrates Sector
- Rockwell Medical
- Nipro
- MEDIVATORS
- Dialysis Medical Solutions
- Fresenius Medical Care
- Baxter
- B. Braun
- Renacon Pharma
- Surni Group
- Weigao Group
- BIOLIGHT
- Taishikang
Key Milestones in Haemodialysis Concentrates Industry
- 2019: Introduction of advanced bicarbonate concentrates with enhanced buffer capacity.
- 2020: Increased focus on developing concentrates suitable for home dialysis due to the COVID-19 pandemic.
- 2021: Launch of novel electrolyte formulations aimed at improving patient outcomes and reducing complications.
- 2022: Significant M&A activity as larger companies sought to expand their product portfolios and market reach.
- 2023: Development of ready-to-use, single-bag concentrates to streamline clinical operations.
- 2024: Growing investment in research and development for personalized dialysate solutions.
Strategic Outlook for Haemodialysis Concentrates Market
The strategic outlook for the haemodialysis concentrates market is overwhelmingly positive, driven by a confluence of factors promising sustained growth and innovation. The increasing global prevalence of chronic kidney disease, coupled with advancements in dialysis technology, will continue to fuel demand for high-quality concentrates. The shift towards home haemodialysis presents a significant expansion avenue, requiring manufacturers to develop user-friendly and efficacious products for this segment. Strategic focus on research and development for personalized dialysate formulations, alongside potential for strategic collaborations and market expansion into underserved regions, will be crucial for companies aiming to capitalize on the substantial future potential of this vital healthcare sector.
Haemodialysis Concentrates Segmentation
-
1. Application
- 1.1. Dialysis Center
- 1.2. Home Dialysis
- 1.3. Others
-
2. Types
- 2.1. Bicarbonate Concentrates
- 2.2. Acid Concentrates
Haemodialysis Concentrates Segmentation By Geography
-
1. North America
- 1.1. United States
- 1.2. Canada
- 1.3. Mexico
-
2. South America
- 2.1. Brazil
- 2.2. Argentina
- 2.3. Rest of South America
-
3. Europe
- 3.1. United Kingdom
- 3.2. Germany
- 3.3. France
- 3.4. Italy
- 3.5. Spain
- 3.6. Russia
- 3.7. Benelux
- 3.8. Nordics
- 3.9. Rest of Europe
-
4. Middle East & Africa
- 4.1. Turkey
- 4.2. Israel
- 4.3. GCC
- 4.4. North Africa
- 4.5. South Africa
- 4.6. Rest of Middle East & Africa
-
5. Asia Pacific
- 5.1. China
- 5.2. India
- 5.3. Japan
- 5.4. South Korea
- 5.5. ASEAN
- 5.6. Oceania
- 5.7. Rest of Asia Pacific
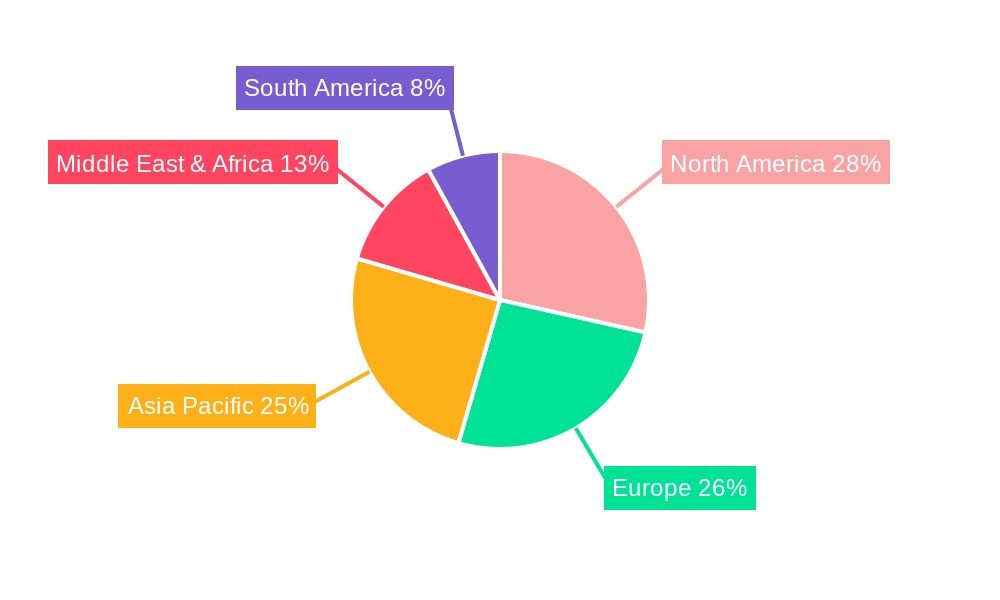
Haemodialysis Concentrates Regional Market Share
Geographic Coverage of Haemodialysis Concentrates
Haemodialysis Concentrates REPORT HIGHLIGHTS
| Aspects | Details |
|---|---|
| Study Period | 2020-2034 |
| Base Year | 2025 |
| Estimated Year | 2026 |
| Forecast Period | 2026-2034 |
| Historical Period | 2020-2025 |
| Growth Rate | CAGR of 5.6% from 2020-2034 |
| Segmentation |
|
Table of Contents
- 1. Introduction
- 1.1. Research Scope
- 1.2. Market Segmentation
- 1.3. Research Objective
- 1.4. Definitions and Assumptions
- 2. Executive Summary
- 2.1. Market Snapshot
- 3. Market Dynamics
- 3.1. Market Drivers
- 3.2. Market Restrains
- 3.3. Market Trends
- 3.4. Market Opportunities
- 4. Market Factor Analysis
- 4.1. Porters Five Forces
- 4.1.1. Bargaining Power of Suppliers
- 4.1.2. Bargaining Power of Buyers
- 4.1.3. Threat of New Entrants
- 4.1.4. Threat of Substitutes
- 4.1.5. Competitive Rivalry
- 4.2. PESTEL analysis
- 4.3. BCG Analysis
- 4.3.1. Stars (High Growth, High Market Share)
- 4.3.2. Cash Cows (Low Growth, High Market Share)
- 4.3.3. Question Mark (High Growth, Low Market Share)
- 4.3.4. Dogs (Low Growth, Low Market Share)
- 4.4. Ansoff Matrix Analysis
- 4.5. Supply Chain Analysis
- 4.6. Regulatory Landscape
- 4.7. Current Market Potential and Opportunity Assessment (TAM–SAM–SOM Framework)
- 4.8. MDP Analyst Note
- 4.1. Porters Five Forces
- 5. Market Analysis, Insights and Forecast 2021-2033
- 5.1. Market Analysis, Insights and Forecast - by Application
- 5.1.1. Dialysis Center
- 5.1.2. Home Dialysis
- 5.1.3. Others
- 5.2. Market Analysis, Insights and Forecast - by Types
- 5.2.1. Bicarbonate Concentrates
- 5.2.2. Acid Concentrates
- 5.3. Market Analysis, Insights and Forecast - by Region
- 5.3.1. North America
- 5.3.2. South America
- 5.3.3. Europe
- 5.3.4. Middle East & Africa
- 5.3.5. Asia Pacific
- 5.1. Market Analysis, Insights and Forecast - by Application
- 6. Global Haemodialysis Concentrates Analysis, Insights and Forecast, 2021-2033
- 6.1. Market Analysis, Insights and Forecast - by Application
- 6.1.1. Dialysis Center
- 6.1.2. Home Dialysis
- 6.1.3. Others
- 6.2. Market Analysis, Insights and Forecast - by Types
- 6.2.1. Bicarbonate Concentrates
- 6.2.2. Acid Concentrates
- 6.1. Market Analysis, Insights and Forecast - by Application
- 7. North America Haemodialysis Concentrates Analysis, Insights and Forecast, 2020-2032
- 7.1. Market Analysis, Insights and Forecast - by Application
- 7.1.1. Dialysis Center
- 7.1.2. Home Dialysis
- 7.1.3. Others
- 7.2. Market Analysis, Insights and Forecast - by Types
- 7.2.1. Bicarbonate Concentrates
- 7.2.2. Acid Concentrates
- 7.1. Market Analysis, Insights and Forecast - by Application
- 8. South America Haemodialysis Concentrates Analysis, Insights and Forecast, 2020-2032
- 8.1. Market Analysis, Insights and Forecast - by Application
- 8.1.1. Dialysis Center
- 8.1.2. Home Dialysis
- 8.1.3. Others
- 8.2. Market Analysis, Insights and Forecast - by Types
- 8.2.1. Bicarbonate Concentrates
- 8.2.2. Acid Concentrates
- 8.1. Market Analysis, Insights and Forecast - by Application
- 9. Europe Haemodialysis Concentrates Analysis, Insights and Forecast, 2020-2032
- 9.1. Market Analysis, Insights and Forecast - by Application
- 9.1.1. Dialysis Center
- 9.1.2. Home Dialysis
- 9.1.3. Others
- 9.2. Market Analysis, Insights and Forecast - by Types
- 9.2.1. Bicarbonate Concentrates
- 9.2.2. Acid Concentrates
- 9.1. Market Analysis, Insights and Forecast - by Application
- 10. Middle East & Africa Haemodialysis Concentrates Analysis, Insights and Forecast, 2020-2032
- 10.1. Market Analysis, Insights and Forecast - by Application
- 10.1.1. Dialysis Center
- 10.1.2. Home Dialysis
- 10.1.3. Others
- 10.2. Market Analysis, Insights and Forecast - by Types
- 10.2.1. Bicarbonate Concentrates
- 10.2.2. Acid Concentrates
- 10.1. Market Analysis, Insights and Forecast - by Application
- 11. Asia Pacific Haemodialysis Concentrates Analysis, Insights and Forecast, 2020-2032
- 11.1. Market Analysis, Insights and Forecast - by Application
- 11.1.1. Dialysis Center
- 11.1.2. Home Dialysis
- 11.1.3. Others
- 11.2. Market Analysis, Insights and Forecast - by Types
- 11.2.1. Bicarbonate Concentrates
- 11.2.2. Acid Concentrates
- 11.1. Market Analysis, Insights and Forecast - by Application
- 12. Competitive Analysis
- 12.1. Company Profiles
- 12.1.1 Rockwell Medical
- 12.1.1.1. Company Overview
- 12.1.1.2. Products
- 12.1.1.3. Company Financials
- 12.1.1.4. SWOT Analysis
- 12.1.2 Nipro
- 12.1.2.1. Company Overview
- 12.1.2.2. Products
- 12.1.2.3. Company Financials
- 12.1.2.4. SWOT Analysis
- 12.1.3 MEDIVATORS
- 12.1.3.1. Company Overview
- 12.1.3.2. Products
- 12.1.3.3. Company Financials
- 12.1.3.4. SWOT Analysis
- 12.1.4 Dialysis Medical Solutions
- 12.1.4.1. Company Overview
- 12.1.4.2. Products
- 12.1.4.3. Company Financials
- 12.1.4.4. SWOT Analysis
- 12.1.5 Fresenius Medical Care
- 12.1.5.1. Company Overview
- 12.1.5.2. Products
- 12.1.5.3. Company Financials
- 12.1.5.4. SWOT Analysis
- 12.1.6 Baxter
- 12.1.6.1. Company Overview
- 12.1.6.2. Products
- 12.1.6.3. Company Financials
- 12.1.6.4. SWOT Analysis
- 12.1.7 B. Braun
- 12.1.7.1. Company Overview
- 12.1.7.2. Products
- 12.1.7.3. Company Financials
- 12.1.7.4. SWOT Analysis
- 12.1.8 Renacon Pharma
- 12.1.8.1. Company Overview
- 12.1.8.2. Products
- 12.1.8.3. Company Financials
- 12.1.8.4. SWOT Analysis
- 12.1.9 Surni Group
- 12.1.9.1. Company Overview
- 12.1.9.2. Products
- 12.1.9.3. Company Financials
- 12.1.9.4. SWOT Analysis
- 12.1.10 Weigao Group
- 12.1.10.1. Company Overview
- 12.1.10.2. Products
- 12.1.10.3. Company Financials
- 12.1.10.4. SWOT Analysis
- 12.1.11 BIOLIGHT
- 12.1.11.1. Company Overview
- 12.1.11.2. Products
- 12.1.11.3. Company Financials
- 12.1.11.4. SWOT Analysis
- 12.1.12 Taishikang
- 12.1.12.1. Company Overview
- 12.1.12.2. Products
- 12.1.12.3. Company Financials
- 12.1.12.4. SWOT Analysis
- 12.1.1 Rockwell Medical
- 12.2. Market Entropy
- 12.2.1 Company's Key Areas Served
- 12.2.2 Recent Developments
- 12.3. Company Market Share Analysis 2025
- 12.3.1 Top 5 Companies Market Share Analysis
- 12.3.2 Top 3 Companies Market Share Analysis
- 12.4. List of Potential Customers
- 13. Research Methodology
List of Figures
- Figure 1: Global Haemodialysis Concentrates Revenue Breakdown (million, %) by Region 2025 & 2033
- Figure 2: Global Haemodialysis Concentrates Volume Breakdown (K, %) by Region 2025 & 2033
- Figure 3: North America Haemodialysis Concentrates Revenue (million), by Application 2025 & 2033
- Figure 4: North America Haemodialysis Concentrates Volume (K), by Application 2025 & 2033
- Figure 5: North America Haemodialysis Concentrates Revenue Share (%), by Application 2025 & 2033
- Figure 6: North America Haemodialysis Concentrates Volume Share (%), by Application 2025 & 2033
- Figure 7: North America Haemodialysis Concentrates Revenue (million), by Types 2025 & 2033
- Figure 8: North America Haemodialysis Concentrates Volume (K), by Types 2025 & 2033
- Figure 9: North America Haemodialysis Concentrates Revenue Share (%), by Types 2025 & 2033
- Figure 10: North America Haemodialysis Concentrates Volume Share (%), by Types 2025 & 2033
- Figure 11: North America Haemodialysis Concentrates Revenue (million), by Country 2025 & 2033
- Figure 12: North America Haemodialysis Concentrates Volume (K), by Country 2025 & 2033
- Figure 13: North America Haemodialysis Concentrates Revenue Share (%), by Country 2025 & 2033
- Figure 14: North America Haemodialysis Concentrates Volume Share (%), by Country 2025 & 2033
- Figure 15: South America Haemodialysis Concentrates Revenue (million), by Application 2025 & 2033
- Figure 16: South America Haemodialysis Concentrates Volume (K), by Application 2025 & 2033
- Figure 17: South America Haemodialysis Concentrates Revenue Share (%), by Application 2025 & 2033
- Figure 18: South America Haemodialysis Concentrates Volume Share (%), by Application 2025 & 2033
- Figure 19: South America Haemodialysis Concentrates Revenue (million), by Types 2025 & 2033
- Figure 20: South America Haemodialysis Concentrates Volume (K), by Types 2025 & 2033
- Figure 21: South America Haemodialysis Concentrates Revenue Share (%), by Types 2025 & 2033
- Figure 22: South America Haemodialysis Concentrates Volume Share (%), by Types 2025 & 2033
- Figure 23: South America Haemodialysis Concentrates Revenue (million), by Country 2025 & 2033
- Figure 24: South America Haemodialysis Concentrates Volume (K), by Country 2025 & 2033
- Figure 25: South America Haemodialysis Concentrates Revenue Share (%), by Country 2025 & 2033
- Figure 26: South America Haemodialysis Concentrates Volume Share (%), by Country 2025 & 2033
- Figure 27: Europe Haemodialysis Concentrates Revenue (million), by Application 2025 & 2033
- Figure 28: Europe Haemodialysis Concentrates Volume (K), by Application 2025 & 2033
- Figure 29: Europe Haemodialysis Concentrates Revenue Share (%), by Application 2025 & 2033
- Figure 30: Europe Haemodialysis Concentrates Volume Share (%), by Application 2025 & 2033
- Figure 31: Europe Haemodialysis Concentrates Revenue (million), by Types 2025 & 2033
- Figure 32: Europe Haemodialysis Concentrates Volume (K), by Types 2025 & 2033
- Figure 33: Europe Haemodialysis Concentrates Revenue Share (%), by Types 2025 & 2033
- Figure 34: Europe Haemodialysis Concentrates Volume Share (%), by Types 2025 & 2033
- Figure 35: Europe Haemodialysis Concentrates Revenue (million), by Country 2025 & 2033
- Figure 36: Europe Haemodialysis Concentrates Volume (K), by Country 2025 & 2033
- Figure 37: Europe Haemodialysis Concentrates Revenue Share (%), by Country 2025 & 2033
- Figure 38: Europe Haemodialysis Concentrates Volume Share (%), by Country 2025 & 2033
- Figure 39: Middle East & Africa Haemodialysis Concentrates Revenue (million), by Application 2025 & 2033
- Figure 40: Middle East & Africa Haemodialysis Concentrates Volume (K), by Application 2025 & 2033
- Figure 41: Middle East & Africa Haemodialysis Concentrates Revenue Share (%), by Application 2025 & 2033
- Figure 42: Middle East & Africa Haemodialysis Concentrates Volume Share (%), by Application 2025 & 2033
- Figure 43: Middle East & Africa Haemodialysis Concentrates Revenue (million), by Types 2025 & 2033
- Figure 44: Middle East & Africa Haemodialysis Concentrates Volume (K), by Types 2025 & 2033
- Figure 45: Middle East & Africa Haemodialysis Concentrates Revenue Share (%), by Types 2025 & 2033
- Figure 46: Middle East & Africa Haemodialysis Concentrates Volume Share (%), by Types 2025 & 2033
- Figure 47: Middle East & Africa Haemodialysis Concentrates Revenue (million), by Country 2025 & 2033
- Figure 48: Middle East & Africa Haemodialysis Concentrates Volume (K), by Country 2025 & 2033
- Figure 49: Middle East & Africa Haemodialysis Concentrates Revenue Share (%), by Country 2025 & 2033
- Figure 50: Middle East & Africa Haemodialysis Concentrates Volume Share (%), by Country 2025 & 2033
- Figure 51: Asia Pacific Haemodialysis Concentrates Revenue (million), by Application 2025 & 2033
- Figure 52: Asia Pacific Haemodialysis Concentrates Volume (K), by Application 2025 & 2033
- Figure 53: Asia Pacific Haemodialysis Concentrates Revenue Share (%), by Application 2025 & 2033
- Figure 54: Asia Pacific Haemodialysis Concentrates Volume Share (%), by Application 2025 & 2033
- Figure 55: Asia Pacific Haemodialysis Concentrates Revenue (million), by Types 2025 & 2033
- Figure 56: Asia Pacific Haemodialysis Concentrates Volume (K), by Types 2025 & 2033
- Figure 57: Asia Pacific Haemodialysis Concentrates Revenue Share (%), by Types 2025 & 2033
- Figure 58: Asia Pacific Haemodialysis Concentrates Volume Share (%), by Types 2025 & 2033
- Figure 59: Asia Pacific Haemodialysis Concentrates Revenue (million), by Country 2025 & 2033
- Figure 60: Asia Pacific Haemodialysis Concentrates Volume (K), by Country 2025 & 2033
- Figure 61: Asia Pacific Haemodialysis Concentrates Revenue Share (%), by Country 2025 & 2033
- Figure 62: Asia Pacific Haemodialysis Concentrates Volume Share (%), by Country 2025 & 2033
List of Tables
- Table 1: Global Haemodialysis Concentrates Revenue million Forecast, by Application 2020 & 2033
- Table 2: Global Haemodialysis Concentrates Volume K Forecast, by Application 2020 & 2033
- Table 3: Global Haemodialysis Concentrates Revenue million Forecast, by Types 2020 & 2033
- Table 4: Global Haemodialysis Concentrates Volume K Forecast, by Types 2020 & 2033
- Table 5: Global Haemodialysis Concentrates Revenue million Forecast, by Region 2020 & 2033
- Table 6: Global Haemodialysis Concentrates Volume K Forecast, by Region 2020 & 2033
- Table 7: Global Haemodialysis Concentrates Revenue million Forecast, by Application 2020 & 2033
- Table 8: Global Haemodialysis Concentrates Volume K Forecast, by Application 2020 & 2033
- Table 9: Global Haemodialysis Concentrates Revenue million Forecast, by Types 2020 & 2033
- Table 10: Global Haemodialysis Concentrates Volume K Forecast, by Types 2020 & 2033
- Table 11: Global Haemodialysis Concentrates Revenue million Forecast, by Country 2020 & 2033
- Table 12: Global Haemodialysis Concentrates Volume K Forecast, by Country 2020 & 2033
- Table 13: United States Haemodialysis Concentrates Revenue (million) Forecast, by Application 2020 & 2033
- Table 14: United States Haemodialysis Concentrates Volume (K) Forecast, by Application 2020 & 2033
- Table 15: Canada Haemodialysis Concentrates Revenue (million) Forecast, by Application 2020 & 2033
- Table 16: Canada Haemodialysis Concentrates Volume (K) Forecast, by Application 2020 & 2033
- Table 17: Mexico Haemodialysis Concentrates Revenue (million) Forecast, by Application 2020 & 2033
- Table 18: Mexico Haemodialysis Concentrates Volume (K) Forecast, by Application 2020 & 2033
- Table 19: Global Haemodialysis Concentrates Revenue million Forecast, by Application 2020 & 2033
- Table 20: Global Haemodialysis Concentrates Volume K Forecast, by Application 2020 & 2033
- Table 21: Global Haemodialysis Concentrates Revenue million Forecast, by Types 2020 & 2033
- Table 22: Global Haemodialysis Concentrates Volume K Forecast, by Types 2020 & 2033
- Table 23: Global Haemodialysis Concentrates Revenue million Forecast, by Country 2020 & 2033
- Table 24: Global Haemodialysis Concentrates Volume K Forecast, by Country 2020 & 2033
- Table 25: Brazil Haemodialysis Concentrates Revenue (million) Forecast, by Application 2020 & 2033
- Table 26: Brazil Haemodialysis Concentrates Volume (K) Forecast, by Application 2020 & 2033
- Table 27: Argentina Haemodialysis Concentrates Revenue (million) Forecast, by Application 2020 & 2033
- Table 28: Argentina Haemodialysis Concentrates Volume (K) Forecast, by Application 2020 & 2033
- Table 29: Rest of South America Haemodialysis Concentrates Revenue (million) Forecast, by Application 2020 & 2033
- Table 30: Rest of South America Haemodialysis Concentrates Volume (K) Forecast, by Application 2020 & 2033
- Table 31: Global Haemodialysis Concentrates Revenue million Forecast, by Application 2020 & 2033
- Table 32: Global Haemodialysis Concentrates Volume K Forecast, by Application 2020 & 2033
- Table 33: Global Haemodialysis Concentrates Revenue million Forecast, by Types 2020 & 2033
- Table 34: Global Haemodialysis Concentrates Volume K Forecast, by Types 2020 & 2033
- Table 35: Global Haemodialysis Concentrates Revenue million Forecast, by Country 2020 & 2033
- Table 36: Global Haemodialysis Concentrates Volume K Forecast, by Country 2020 & 2033
- Table 37: United Kingdom Haemodialysis Concentrates Revenue (million) Forecast, by Application 2020 & 2033
- Table 38: United Kingdom Haemodialysis Concentrates Volume (K) Forecast, by Application 2020 & 2033
- Table 39: Germany Haemodialysis Concentrates Revenue (million) Forecast, by Application 2020 & 2033
- Table 40: Germany Haemodialysis Concentrates Volume (K) Forecast, by Application 2020 & 2033
- Table 41: France Haemodialysis Concentrates Revenue (million) Forecast, by Application 2020 & 2033
- Table 42: France Haemodialysis Concentrates Volume (K) Forecast, by Application 2020 & 2033
- Table 43: Italy Haemodialysis Concentrates Revenue (million) Forecast, by Application 2020 & 2033
- Table 44: Italy Haemodialysis Concentrates Volume (K) Forecast, by Application 2020 & 2033
- Table 45: Spain Haemodialysis Concentrates Revenue (million) Forecast, by Application 2020 & 2033
- Table 46: Spain Haemodialysis Concentrates Volume (K) Forecast, by Application 2020 & 2033
- Table 47: Russia Haemodialysis Concentrates Revenue (million) Forecast, by Application 2020 & 2033
- Table 48: Russia Haemodialysis Concentrates Volume (K) Forecast, by Application 2020 & 2033
- Table 49: Benelux Haemodialysis Concentrates Revenue (million) Forecast, by Application 2020 & 2033
- Table 50: Benelux Haemodialysis Concentrates Volume (K) Forecast, by Application 2020 & 2033
- Table 51: Nordics Haemodialysis Concentrates Revenue (million) Forecast, by Application 2020 & 2033
- Table 52: Nordics Haemodialysis Concentrates Volume (K) Forecast, by Application 2020 & 2033
- Table 53: Rest of Europe Haemodialysis Concentrates Revenue (million) Forecast, by Application 2020 & 2033
- Table 54: Rest of Europe Haemodialysis Concentrates Volume (K) Forecast, by Application 2020 & 2033
- Table 55: Global Haemodialysis Concentrates Revenue million Forecast, by Application 2020 & 2033
- Table 56: Global Haemodialysis Concentrates Volume K Forecast, by Application 2020 & 2033
- Table 57: Global Haemodialysis Concentrates Revenue million Forecast, by Types 2020 & 2033
- Table 58: Global Haemodialysis Concentrates Volume K Forecast, by Types 2020 & 2033
- Table 59: Global Haemodialysis Concentrates Revenue million Forecast, by Country 2020 & 2033
- Table 60: Global Haemodialysis Concentrates Volume K Forecast, by Country 2020 & 2033
- Table 61: Turkey Haemodialysis Concentrates Revenue (million) Forecast, by Application 2020 & 2033
- Table 62: Turkey Haemodialysis Concentrates Volume (K) Forecast, by Application 2020 & 2033
- Table 63: Israel Haemodialysis Concentrates Revenue (million) Forecast, by Application 2020 & 2033
- Table 64: Israel Haemodialysis Concentrates Volume (K) Forecast, by Application 2020 & 2033
- Table 65: GCC Haemodialysis Concentrates Revenue (million) Forecast, by Application 2020 & 2033
- Table 66: GCC Haemodialysis Concentrates Volume (K) Forecast, by Application 2020 & 2033
- Table 67: North Africa Haemodialysis Concentrates Revenue (million) Forecast, by Application 2020 & 2033
- Table 68: North Africa Haemodialysis Concentrates Volume (K) Forecast, by Application 2020 & 2033
- Table 69: South Africa Haemodialysis Concentrates Revenue (million) Forecast, by Application 2020 & 2033
- Table 70: South Africa Haemodialysis Concentrates Volume (K) Forecast, by Application 2020 & 2033
- Table 71: Rest of Middle East & Africa Haemodialysis Concentrates Revenue (million) Forecast, by Application 2020 & 2033
- Table 72: Rest of Middle East & Africa Haemodialysis Concentrates Volume (K) Forecast, by Application 2020 & 2033
- Table 73: Global Haemodialysis Concentrates Revenue million Forecast, by Application 2020 & 2033
- Table 74: Global Haemodialysis Concentrates Volume K Forecast, by Application 2020 & 2033
- Table 75: Global Haemodialysis Concentrates Revenue million Forecast, by Types 2020 & 2033
- Table 76: Global Haemodialysis Concentrates Volume K Forecast, by Types 2020 & 2033
- Table 77: Global Haemodialysis Concentrates Revenue million Forecast, by Country 2020 & 2033
- Table 78: Global Haemodialysis Concentrates Volume K Forecast, by Country 2020 & 2033
- Table 79: China Haemodialysis Concentrates Revenue (million) Forecast, by Application 2020 & 2033
- Table 80: China Haemodialysis Concentrates Volume (K) Forecast, by Application 2020 & 2033
- Table 81: India Haemodialysis Concentrates Revenue (million) Forecast, by Application 2020 & 2033
- Table 82: India Haemodialysis Concentrates Volume (K) Forecast, by Application 2020 & 2033
- Table 83: Japan Haemodialysis Concentrates Revenue (million) Forecast, by Application 2020 & 2033
- Table 84: Japan Haemodialysis Concentrates Volume (K) Forecast, by Application 2020 & 2033
- Table 85: South Korea Haemodialysis Concentrates Revenue (million) Forecast, by Application 2020 & 2033
- Table 86: South Korea Haemodialysis Concentrates Volume (K) Forecast, by Application 2020 & 2033
- Table 87: ASEAN Haemodialysis Concentrates Revenue (million) Forecast, by Application 2020 & 2033
- Table 88: ASEAN Haemodialysis Concentrates Volume (K) Forecast, by Application 2020 & 2033
- Table 89: Oceania Haemodialysis Concentrates Revenue (million) Forecast, by Application 2020 & 2033
- Table 90: Oceania Haemodialysis Concentrates Volume (K) Forecast, by Application 2020 & 2033
- Table 91: Rest of Asia Pacific Haemodialysis Concentrates Revenue (million) Forecast, by Application 2020 & 2033
- Table 92: Rest of Asia Pacific Haemodialysis Concentrates Volume (K) Forecast, by Application 2020 & 2033
Frequently Asked Questions
1. What is the projected Compound Annual Growth Rate (CAGR) of the Haemodialysis Concentrates?
The projected CAGR is approximately 5.6%.
2. Which companies are prominent players in the Haemodialysis Concentrates?
Key companies in the market include Rockwell Medical, Nipro, MEDIVATORS, Dialysis Medical Solutions, Fresenius Medical Care, Baxter, B. Braun, Renacon Pharma, Surni Group, Weigao Group, BIOLIGHT, Taishikang.
3. What are the main segments of the Haemodialysis Concentrates?
The market segments include Application, Types.
4. Can you provide details about the market size?
The market size is estimated to be USD 5247 million as of 2022.
5. What are some drivers contributing to market growth?
N/A
6. What are the notable trends driving market growth?
N/A
7. Are there any restraints impacting market growth?
N/A
8. Can you provide examples of recent developments in the market?
N/A
9. What pricing options are available for accessing the report?
Pricing options include single-user, multi-user, and enterprise licenses priced at USD 3950.00, USD 5925.00, and USD 7900.00 respectively.
10. Is the market size provided in terms of value or volume?
The market size is provided in terms of value, measured in million and volume, measured in K.
11. Are there any specific market keywords associated with the report?
Yes, the market keyword associated with the report is "Haemodialysis Concentrates," which aids in identifying and referencing the specific market segment covered.
12. How do I determine which pricing option suits my needs best?
The pricing options vary based on user requirements and access needs. Individual users may opt for single-user licenses, while businesses requiring broader access may choose multi-user or enterprise licenses for cost-effective access to the report.
13. Are there any additional resources or data provided in the Haemodialysis Concentrates report?
While the report offers comprehensive insights, it's advisable to review the specific contents or supplementary materials provided to ascertain if additional resources or data are available.
14. How can I stay updated on further developments or reports in the Haemodialysis Concentrates?
To stay informed about further developments, trends, and reports in the Haemodialysis Concentrates, consider subscribing to industry newsletters, following relevant companies and organizations, or regularly checking reputable industry news sources and publications.
Methodology
Step 1 - Identification of Relevant Samples Size from Population Database


Step 2 - Approaches for Defining Global Market Size (Value, Volume* & Price*)

Note*: In applicable scenarios
Step 3 - Data Sources
Primary Research
- Web Analytics
- Survey Reports
- Research Institute
- Latest Research Reports
- Opinion Leaders
Secondary Research
- Annual Reports
- White Paper
- Latest Press Release
- Industry Association
- Paid Database
- Investor Presentations

Step 4 - Data Triangulation
Involves using different sources of information in order to increase the validity of a study
These sources are likely to be stakeholders in a program - participants, other researchers, program staff, other community members, and so on.
Then we put all data in single framework & apply various statistical tools to find out the dynamic on the market.
During the analysis stage, feedback from the stakeholder groups would be compared to determine areas of agreement as well as areas of divergence