

Key Insights
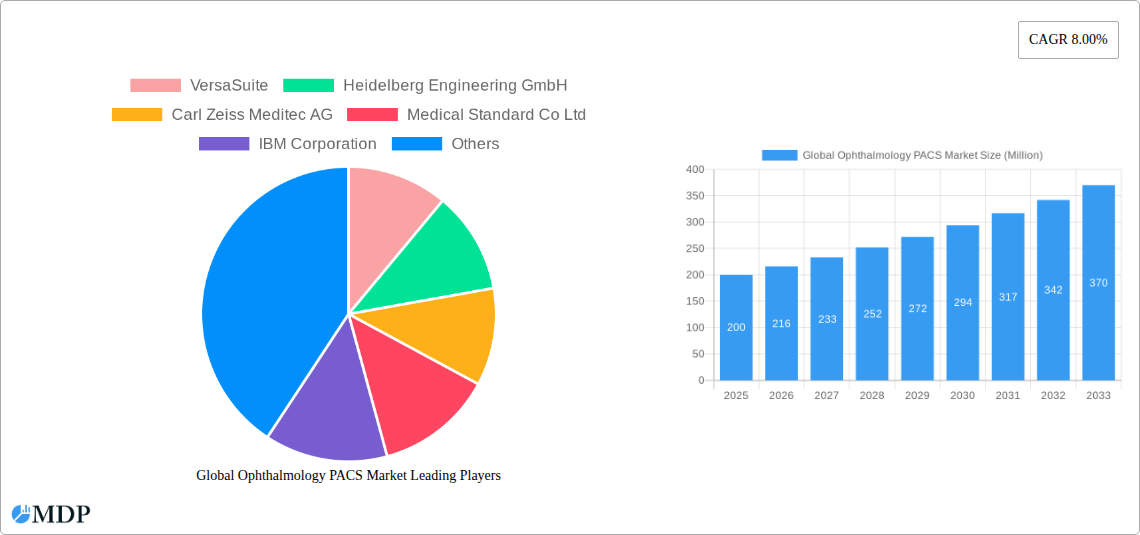
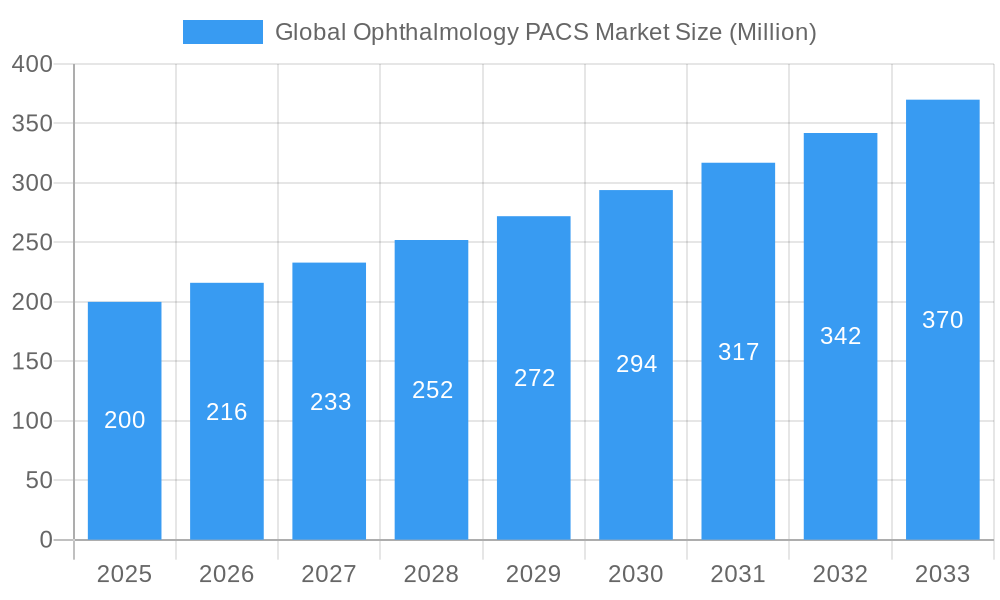
The global Ophthalmology Picture Archiving and Communication System (PACS) market is poised for significant expansion, driven by the escalating prevalence of eye conditions, advancements in PACS technology, and the growing need for efficient image management in ophthalmology. With a current market size estimated at 184.4 million in the base year of 2025, the market is projected to achieve a Compound Annual Growth Rate (CAGR) of 8.4% from 2025 to 2033. Key growth drivers include the integration of PACS into ophthalmic workflows, enhancing diagnostic accuracy and operational efficiency, and the increasing adoption of scalable, cost-effective, and remotely accessible cloud-based PACS solutions. The trend towards minimally invasive procedures and advanced imaging modalities further propels market growth. Integrated PACS systems are favored, offering comprehensive solutions for diverse imaging needs. North America is anticipated to lead the market due to high technology adoption and advanced healthcare infrastructure, while the Asia-Pacific region shows promising growth, fueled by expanding healthcare facilities and rising awareness of eye health. Potential challenges include high initial investment costs and the need for skilled personnel.
Global Ophthalmology PACS Market Market Size (In Million)
The competitive environment features a mix of established and emerging players focusing on strategic collaborations, innovation, and product differentiation. Leading companies are developing advanced ophthalmology PACS solutions, with market consolidation expected to increase. The long-term outlook remains positive, supported by continuous technological progress, growing healthcare expenditure, and the increasing demand for sophisticated image management in ophthalmology. User-friendly interfaces, superior image quality, and robust data security will be critical for future market development.
Global Ophthalmology PACS Market Company Market Share
Global Ophthalmology PACS Market Report: 2019-2033
This comprehensive report provides a detailed analysis of the Global Ophthalmology PACS Market, offering invaluable insights for industry stakeholders, investors, and strategic decision-makers. Covering the period 2019-2033, with a focus on 2025, this report unveils market dynamics, trends, and future growth potential. The market is segmented by type (Integrated PACS, Standalone PACS), delivery model (Cloud-Based, On-Premise), and end-user (Hospitals & Clinics, Ambulatory Surgical Centers). Key players like VersaSuite, Heidelberg Engineering GmbH, Carl Zeiss Meditec AG, Medical Standard Co Ltd, IBM Corporation, Agfa-Gevaert N V, Visbion Limited, and Sonomed Escalon are profiled, providing a holistic view of the competitive landscape. The report’s extensive data and analysis will empower you to make informed decisions and capitalize on emerging opportunities within this rapidly evolving market. The projected market value is xx Million in 2025.
Global Ophthalmology PACS Market Market Dynamics & Concentration
The global Ophthalmology PACS market exhibits a moderately concentrated landscape, with a few major players holding significant market share. The market share of the top 5 players is estimated to be around xx%. Innovation is a key driver, fueled by advancements in image processing, AI-powered diagnostics, and cloud-based solutions. Stringent regulatory frameworks concerning data privacy and security influence market growth and adoption rates. While no direct substitutes exist, alternative solutions like standalone image management systems present competitive pressure. End-user trends reflect increasing adoption of PACS systems for improved workflow efficiency, enhanced diagnostic capabilities, and better patient care. Mergers and acquisitions (M&A) activity in the ophthalmology technology sector has been moderate, with approximately xx M&A deals reported between 2019 and 2024.
- Market Concentration: Moderately concentrated, top 5 players hold ~xx% market share.
- Innovation Drivers: AI-powered diagnostics, cloud-based solutions, advanced image processing.
- Regulatory Landscape: Stringent data privacy and security regulations.
- Product Substitutes: Limited direct substitutes; competitive pressure from standalone systems.
- End-User Trends: Growing demand for efficient workflow, enhanced diagnostics, improved patient care.
- M&A Activity: Approximately xx M&A deals between 2019 and 2024.
Global Ophthalmology PACS Market Industry Trends & Analysis
The global Ophthalmology PACS market is experiencing robust growth, driven by increasing prevalence of ophthalmic diseases, rising demand for advanced diagnostic tools, and technological advancements. The market is projected to grow at a CAGR of xx% during the forecast period (2025-2033). Technological disruptions, such as the integration of AI and machine learning for automated image analysis, are significantly impacting market dynamics. Consumer preferences are shifting towards cloud-based PACS solutions due to their scalability, accessibility, and cost-effectiveness. Competitive dynamics are marked by continuous innovation, strategic partnerships, and increasing market penetration by both established players and emerging companies. Market penetration for cloud-based PACS systems is projected to reach xx% by 2033.
Leading Markets & Segments in Global Ophthalmology PACS Market
The North American region currently dominates the global Ophthalmology PACS market, driven by factors such as high healthcare expenditure, advanced healthcare infrastructure, and a significant number of ophthalmology practices. Within the market segmentation:
- Type: Integrated PACS systems currently hold a larger market share than standalone PACS due to their comprehensive functionalities.
- Delivery Model: The Cloud-Based model is gaining rapid traction, exceeding On-Premise adoption driven by flexibility and reduced IT infrastructure costs.
- End-User: Hospitals & Clinics represent the largest end-user segment, driven by high patient volumes and the need for efficient image management.
Key Drivers:
- North America: High healthcare expenditure, advanced infrastructure, large number of ophthalmology practices.
- Integrated PACS: Comprehensive functionalities, improved workflow efficiency.
- Cloud-Based Model: Scalability, accessibility, reduced IT infrastructure costs.
- Hospitals & Clinics: High patient volumes, need for efficient image management.
Global Ophthalmology PACS Market Product Developments
Recent product innovations focus on enhancing image quality, improving diagnostic accuracy through AI integration, and streamlining workflow efficiency. Cloud-based platforms are becoming increasingly sophisticated, offering remote access, advanced analytics, and robust security features. Key competitive advantages include superior image processing capabilities, user-friendly interfaces, and seamless integration with other ophthalmic devices. These advancements directly improve the accuracy and speed of diagnosis, ultimately benefiting patient care.
Key Drivers of Global Ophthalmology PACS Market Growth
Several factors contribute to the market's growth trajectory:
- Technological Advancements: AI-driven image analysis, cloud computing, improved image quality.
- Economic Growth: Increased healthcare spending in developing economies drives demand.
- Regulatory Support: Initiatives promoting digital healthcare adoption and data interoperability.
Challenges in the Global Ophthalmology PACS Market Market
The market faces challenges including:
- High Initial Investment Costs: Implementation of PACS systems can require substantial upfront investments, potentially deterring smaller practices.
- Data Security Concerns: Protecting sensitive patient data is paramount, requiring robust security measures.
- Integration Complexity: Seamless integration with existing hospital systems can be technically challenging.
Emerging Opportunities in Global Ophthalmology PACS Market
The integration of AI and machine learning into PACS systems presents significant opportunities for enhanced diagnostics and workflow automation. Strategic partnerships between PACS vendors and ophthalmology clinics can unlock new market segments and drive adoption. Expansion into emerging economies with growing healthcare infrastructure also holds immense potential for market growth.
Leading Players in the Global Ophthalmology PACS Market Sector
- VersaSuite
- Heidelberg Engineering GmbH
- Carl Zeiss Meditec AG
- Medical Standard Co Ltd
- IBM Corporation
- Agfa-Gevaert N V
- Visbion Limited
- Sonomed Escalon
Key Milestones in Global Ophthalmology PACS Market Industry
- May 2022: OMNY Health partnered with community-based ophthalmology practices to launch a real-world data ecosystem, fostering collaborative research.
- April 2022: ZEISS Medical Technology's QUATERA 700 phaco technology received FDA approval, enhancing surgical workflow efficiency.
Strategic Outlook for Global Ophthalmology PACS Market Market
The future of the Ophthalmology PACS market looks promising, driven by continuous technological innovation, increasing demand for efficient healthcare solutions, and the expansion of tele-ophthalmology. Strategic partnerships, investments in AI-powered diagnostics, and expansion into untapped markets will be key growth accelerators. The market is poised for significant expansion in the coming years, presenting lucrative opportunities for both established players and new entrants.
Global Ophthalmology PACS Market Segmentation
-
1. Type
- 1.1. Integrated PACS
- 1.2. Standalone PACS
-
2. Delivery Model
- 2.1. Cloud-Based Model
- 2.2. On-Premise Model
-
3. End User
- 3.1. Hospitals & Clinics
- 3.2. Ambulatory Surgical Centers
Global Ophthalmology PACS Market Segmentation By Geography
-
1. North America
- 1.1. United States
- 1.2. Canada
- 1.3. Mexico
-
2. Europe
- 2.1. Germany
- 2.2. United Kingdom
- 2.3. France
- 2.4. Italy
- 2.5. Spain
- 2.6. Rest of Europe
-
3. Asia Pacific
- 3.1. China
- 3.2. Japan
- 3.3. India
- 3.4. Australia
- 3.5. South Korea
- 3.6. Rest of Asia Pacific
-
4. Middle East and Africa
- 4.1. GCC
- 4.2. South Africa
- 4.3. Rest of Middle East and Africa
-
5. South America
- 5.1. Brazil
- 5.2. Argentina
- 5.3. Rest of South America
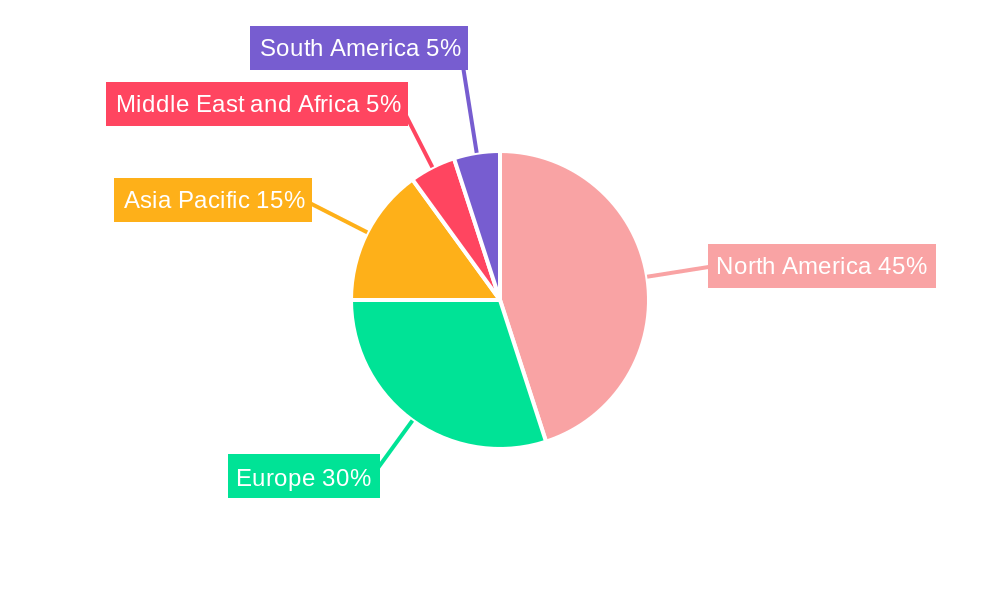
Global Ophthalmology PACS Market Regional Market Share
Geographic Coverage of Global Ophthalmology PACS Market
Global Ophthalmology PACS Market REPORT HIGHLIGHTS
| Aspects | Details |
|---|---|
| Study Period | 2020-2034 |
| Base Year | 2025 |
| Estimated Year | 2026 |
| Forecast Period | 2026-2034 |
| Historical Period | 2020-2025 |
| Growth Rate | CAGR of 8.4% from 2020-2034 |
| Segmentation |
|
Table of Contents
- 1. Introduction
- 1.1. Research Scope
- 1.2. Market Segmentation
- 1.3. Research Objective
- 1.4. Definitions and Assumptions
- 2. Executive Summary
- 2.1. Market Snapshot
- 3. Market Dynamics
- 3.1. Market Drivers
- 3.2. Market Restrains
- 3.3. Market Trends
- 3.4. Market Opportunities
- 4. Market Factor Analysis
- 4.1. Porters Five Forces
- 4.1.1. Bargaining Power of Suppliers
- 4.1.2. Bargaining Power of Buyers
- 4.1.3. Threat of New Entrants
- 4.1.4. Threat of Substitutes
- 4.1.5. Competitive Rivalry
- 4.2. PESTEL analysis
- 4.3. BCG Analysis
- 4.3.1. Stars (High Growth, High Market Share)
- 4.3.2. Cash Cows (Low Growth, High Market Share)
- 4.3.3. Question Mark (High Growth, Low Market Share)
- 4.3.4. Dogs (Low Growth, Low Market Share)
- 4.4. Ansoff Matrix Analysis
- 4.5. Supply Chain Analysis
- 4.6. Regulatory Landscape
- 4.7. Current Market Potential and Opportunity Assessment (TAM–SAM–SOM Framework)
- 4.8. MDP Analyst Note
- 4.1. Porters Five Forces
- 5. Market Analysis, Insights and Forecast 2021-2033
- 5.1. Market Analysis, Insights and Forecast - by Type
- 5.1.1. Integrated PACS
- 5.1.2. Standalone PACS
- 5.2. Market Analysis, Insights and Forecast - by Delivery Model
- 5.2.1. Cloud-Based Model
- 5.2.2. On-Premise Model
- 5.3. Market Analysis, Insights and Forecast - by End User
- 5.3.1. Hospitals & Clinics
- 5.3.2. Ambulatory Surgical Centers
- 5.4. Market Analysis, Insights and Forecast - by Region
- 5.4.1. North America
- 5.4.2. Europe
- 5.4.3. Asia Pacific
- 5.4.4. Middle East and Africa
- 5.4.5. South America
- 5.1. Market Analysis, Insights and Forecast - by Type
- 6. Global Ophthalmology PACS Market Analysis, Insights and Forecast, 2021-2033
- 6.1. Market Analysis, Insights and Forecast - by Type
- 6.1.1. Integrated PACS
- 6.1.2. Standalone PACS
- 6.2. Market Analysis, Insights and Forecast - by Delivery Model
- 6.2.1. Cloud-Based Model
- 6.2.2. On-Premise Model
- 6.3. Market Analysis, Insights and Forecast - by End User
- 6.3.1. Hospitals & Clinics
- 6.3.2. Ambulatory Surgical Centers
- 6.1. Market Analysis, Insights and Forecast - by Type
- 7. North America Global Ophthalmology PACS Market Analysis, Insights and Forecast, 2020-2032
- 7.1. Market Analysis, Insights and Forecast - by Type
- 7.1.1. Integrated PACS
- 7.1.2. Standalone PACS
- 7.2. Market Analysis, Insights and Forecast - by Delivery Model
- 7.2.1. Cloud-Based Model
- 7.2.2. On-Premise Model
- 7.3. Market Analysis, Insights and Forecast - by End User
- 7.3.1. Hospitals & Clinics
- 7.3.2. Ambulatory Surgical Centers
- 7.1. Market Analysis, Insights and Forecast - by Type
- 8. Europe Global Ophthalmology PACS Market Analysis, Insights and Forecast, 2020-2032
- 8.1. Market Analysis, Insights and Forecast - by Type
- 8.1.1. Integrated PACS
- 8.1.2. Standalone PACS
- 8.2. Market Analysis, Insights and Forecast - by Delivery Model
- 8.2.1. Cloud-Based Model
- 8.2.2. On-Premise Model
- 8.3. Market Analysis, Insights and Forecast - by End User
- 8.3.1. Hospitals & Clinics
- 8.3.2. Ambulatory Surgical Centers
- 8.1. Market Analysis, Insights and Forecast - by Type
- 9. Asia Pacific Global Ophthalmology PACS Market Analysis, Insights and Forecast, 2020-2032
- 9.1. Market Analysis, Insights and Forecast - by Type
- 9.1.1. Integrated PACS
- 9.1.2. Standalone PACS
- 9.2. Market Analysis, Insights and Forecast - by Delivery Model
- 9.2.1. Cloud-Based Model
- 9.2.2. On-Premise Model
- 9.3. Market Analysis, Insights and Forecast - by End User
- 9.3.1. Hospitals & Clinics
- 9.3.2. Ambulatory Surgical Centers
- 9.1. Market Analysis, Insights and Forecast - by Type
- 10. Middle East and Africa Global Ophthalmology PACS Market Analysis, Insights and Forecast, 2020-2032
- 10.1. Market Analysis, Insights and Forecast - by Type
- 10.1.1. Integrated PACS
- 10.1.2. Standalone PACS
- 10.2. Market Analysis, Insights and Forecast - by Delivery Model
- 10.2.1. Cloud-Based Model
- 10.2.2. On-Premise Model
- 10.3. Market Analysis, Insights and Forecast - by End User
- 10.3.1. Hospitals & Clinics
- 10.3.2. Ambulatory Surgical Centers
- 10.1. Market Analysis, Insights and Forecast - by Type
- 11. South America Global Ophthalmology PACS Market Analysis, Insights and Forecast, 2020-2032
- 11.1. Market Analysis, Insights and Forecast - by Type
- 11.1.1. Integrated PACS
- 11.1.2. Standalone PACS
- 11.2. Market Analysis, Insights and Forecast - by Delivery Model
- 11.2.1. Cloud-Based Model
- 11.2.2. On-Premise Model
- 11.3. Market Analysis, Insights and Forecast - by End User
- 11.3.1. Hospitals & Clinics
- 11.3.2. Ambulatory Surgical Centers
- 11.1. Market Analysis, Insights and Forecast - by Type
- 12. Competitive Analysis
- 12.1. Company Profiles
- 12.1.1 VersaSuite
- 12.1.1.1. Company Overview
- 12.1.1.2. Products
- 12.1.1.3. Company Financials
- 12.1.1.4. SWOT Analysis
- 12.1.2 Heidelberg Engineering GmbH
- 12.1.2.1. Company Overview
- 12.1.2.2. Products
- 12.1.2.3. Company Financials
- 12.1.2.4. SWOT Analysis
- 12.1.3 Carl Zeiss Meditec AG
- 12.1.3.1. Company Overview
- 12.1.3.2. Products
- 12.1.3.3. Company Financials
- 12.1.3.4. SWOT Analysis
- 12.1.4 Medical Standard Co Ltd
- 12.1.4.1. Company Overview
- 12.1.4.2. Products
- 12.1.4.3. Company Financials
- 12.1.4.4. SWOT Analysis
- 12.1.5 IBM Corporation
- 12.1.5.1. Company Overview
- 12.1.5.2. Products
- 12.1.5.3. Company Financials
- 12.1.5.4. SWOT Analysis
- 12.1.6 Agfa-Gevaert N V
- 12.1.6.1. Company Overview
- 12.1.6.2. Products
- 12.1.6.3. Company Financials
- 12.1.6.4. SWOT Analysis
- 12.1.7 Visbion Limited
- 12.1.7.1. Company Overview
- 12.1.7.2. Products
- 12.1.7.3. Company Financials
- 12.1.7.4. SWOT Analysis
- 12.1.8 Sonomed Escalon
- 12.1.8.1. Company Overview
- 12.1.8.2. Products
- 12.1.8.3. Company Financials
- 12.1.8.4. SWOT Analysis
- 12.1.1 VersaSuite
- 12.2. Market Entropy
- 12.2.1 Company's Key Areas Served
- 12.2.2 Recent Developments
- 12.3. Company Market Share Analysis 2025
- 12.3.1 Top 5 Companies Market Share Analysis
- 12.3.2 Top 3 Companies Market Share Analysis
- 12.4. List of Potential Customers
- 13. Research Methodology
List of Figures
- Figure 1: Global Global Ophthalmology PACS Market Revenue Breakdown (million, %) by Region 2025 & 2033
- Figure 2: Global Global Ophthalmology PACS Market Volume Breakdown (K Unit, %) by Region 2025 & 2033
- Figure 3: North America Global Ophthalmology PACS Market Revenue (million), by Type 2025 & 2033
- Figure 4: North America Global Ophthalmology PACS Market Volume (K Unit), by Type 2025 & 2033
- Figure 5: North America Global Ophthalmology PACS Market Revenue Share (%), by Type 2025 & 2033
- Figure 6: North America Global Ophthalmology PACS Market Volume Share (%), by Type 2025 & 2033
- Figure 7: North America Global Ophthalmology PACS Market Revenue (million), by Delivery Model 2025 & 2033
- Figure 8: North America Global Ophthalmology PACS Market Volume (K Unit), by Delivery Model 2025 & 2033
- Figure 9: North America Global Ophthalmology PACS Market Revenue Share (%), by Delivery Model 2025 & 2033
- Figure 10: North America Global Ophthalmology PACS Market Volume Share (%), by Delivery Model 2025 & 2033
- Figure 11: North America Global Ophthalmology PACS Market Revenue (million), by End User 2025 & 2033
- Figure 12: North America Global Ophthalmology PACS Market Volume (K Unit), by End User 2025 & 2033
- Figure 13: North America Global Ophthalmology PACS Market Revenue Share (%), by End User 2025 & 2033
- Figure 14: North America Global Ophthalmology PACS Market Volume Share (%), by End User 2025 & 2033
- Figure 15: North America Global Ophthalmology PACS Market Revenue (million), by Country 2025 & 2033
- Figure 16: North America Global Ophthalmology PACS Market Volume (K Unit), by Country 2025 & 2033
- Figure 17: North America Global Ophthalmology PACS Market Revenue Share (%), by Country 2025 & 2033
- Figure 18: North America Global Ophthalmology PACS Market Volume Share (%), by Country 2025 & 2033
- Figure 19: Europe Global Ophthalmology PACS Market Revenue (million), by Type 2025 & 2033
- Figure 20: Europe Global Ophthalmology PACS Market Volume (K Unit), by Type 2025 & 2033
- Figure 21: Europe Global Ophthalmology PACS Market Revenue Share (%), by Type 2025 & 2033
- Figure 22: Europe Global Ophthalmology PACS Market Volume Share (%), by Type 2025 & 2033
- Figure 23: Europe Global Ophthalmology PACS Market Revenue (million), by Delivery Model 2025 & 2033
- Figure 24: Europe Global Ophthalmology PACS Market Volume (K Unit), by Delivery Model 2025 & 2033
- Figure 25: Europe Global Ophthalmology PACS Market Revenue Share (%), by Delivery Model 2025 & 2033
- Figure 26: Europe Global Ophthalmology PACS Market Volume Share (%), by Delivery Model 2025 & 2033
- Figure 27: Europe Global Ophthalmology PACS Market Revenue (million), by End User 2025 & 2033
- Figure 28: Europe Global Ophthalmology PACS Market Volume (K Unit), by End User 2025 & 2033
- Figure 29: Europe Global Ophthalmology PACS Market Revenue Share (%), by End User 2025 & 2033
- Figure 30: Europe Global Ophthalmology PACS Market Volume Share (%), by End User 2025 & 2033
- Figure 31: Europe Global Ophthalmology PACS Market Revenue (million), by Country 2025 & 2033
- Figure 32: Europe Global Ophthalmology PACS Market Volume (K Unit), by Country 2025 & 2033
- Figure 33: Europe Global Ophthalmology PACS Market Revenue Share (%), by Country 2025 & 2033
- Figure 34: Europe Global Ophthalmology PACS Market Volume Share (%), by Country 2025 & 2033
- Figure 35: Asia Pacific Global Ophthalmology PACS Market Revenue (million), by Type 2025 & 2033
- Figure 36: Asia Pacific Global Ophthalmology PACS Market Volume (K Unit), by Type 2025 & 2033
- Figure 37: Asia Pacific Global Ophthalmology PACS Market Revenue Share (%), by Type 2025 & 2033
- Figure 38: Asia Pacific Global Ophthalmology PACS Market Volume Share (%), by Type 2025 & 2033
- Figure 39: Asia Pacific Global Ophthalmology PACS Market Revenue (million), by Delivery Model 2025 & 2033
- Figure 40: Asia Pacific Global Ophthalmology PACS Market Volume (K Unit), by Delivery Model 2025 & 2033
- Figure 41: Asia Pacific Global Ophthalmology PACS Market Revenue Share (%), by Delivery Model 2025 & 2033
- Figure 42: Asia Pacific Global Ophthalmology PACS Market Volume Share (%), by Delivery Model 2025 & 2033
- Figure 43: Asia Pacific Global Ophthalmology PACS Market Revenue (million), by End User 2025 & 2033
- Figure 44: Asia Pacific Global Ophthalmology PACS Market Volume (K Unit), by End User 2025 & 2033
- Figure 45: Asia Pacific Global Ophthalmology PACS Market Revenue Share (%), by End User 2025 & 2033
- Figure 46: Asia Pacific Global Ophthalmology PACS Market Volume Share (%), by End User 2025 & 2033
- Figure 47: Asia Pacific Global Ophthalmology PACS Market Revenue (million), by Country 2025 & 2033
- Figure 48: Asia Pacific Global Ophthalmology PACS Market Volume (K Unit), by Country 2025 & 2033
- Figure 49: Asia Pacific Global Ophthalmology PACS Market Revenue Share (%), by Country 2025 & 2033
- Figure 50: Asia Pacific Global Ophthalmology PACS Market Volume Share (%), by Country 2025 & 2033
- Figure 51: Middle East and Africa Global Ophthalmology PACS Market Revenue (million), by Type 2025 & 2033
- Figure 52: Middle East and Africa Global Ophthalmology PACS Market Volume (K Unit), by Type 2025 & 2033
- Figure 53: Middle East and Africa Global Ophthalmology PACS Market Revenue Share (%), by Type 2025 & 2033
- Figure 54: Middle East and Africa Global Ophthalmology PACS Market Volume Share (%), by Type 2025 & 2033
- Figure 55: Middle East and Africa Global Ophthalmology PACS Market Revenue (million), by Delivery Model 2025 & 2033
- Figure 56: Middle East and Africa Global Ophthalmology PACS Market Volume (K Unit), by Delivery Model 2025 & 2033
- Figure 57: Middle East and Africa Global Ophthalmology PACS Market Revenue Share (%), by Delivery Model 2025 & 2033
- Figure 58: Middle East and Africa Global Ophthalmology PACS Market Volume Share (%), by Delivery Model 2025 & 2033
- Figure 59: Middle East and Africa Global Ophthalmology PACS Market Revenue (million), by End User 2025 & 2033
- Figure 60: Middle East and Africa Global Ophthalmology PACS Market Volume (K Unit), by End User 2025 & 2033
- Figure 61: Middle East and Africa Global Ophthalmology PACS Market Revenue Share (%), by End User 2025 & 2033
- Figure 62: Middle East and Africa Global Ophthalmology PACS Market Volume Share (%), by End User 2025 & 2033
- Figure 63: Middle East and Africa Global Ophthalmology PACS Market Revenue (million), by Country 2025 & 2033
- Figure 64: Middle East and Africa Global Ophthalmology PACS Market Volume (K Unit), by Country 2025 & 2033
- Figure 65: Middle East and Africa Global Ophthalmology PACS Market Revenue Share (%), by Country 2025 & 2033
- Figure 66: Middle East and Africa Global Ophthalmology PACS Market Volume Share (%), by Country 2025 & 2033
- Figure 67: South America Global Ophthalmology PACS Market Revenue (million), by Type 2025 & 2033
- Figure 68: South America Global Ophthalmology PACS Market Volume (K Unit), by Type 2025 & 2033
- Figure 69: South America Global Ophthalmology PACS Market Revenue Share (%), by Type 2025 & 2033
- Figure 70: South America Global Ophthalmology PACS Market Volume Share (%), by Type 2025 & 2033
- Figure 71: South America Global Ophthalmology PACS Market Revenue (million), by Delivery Model 2025 & 2033
- Figure 72: South America Global Ophthalmology PACS Market Volume (K Unit), by Delivery Model 2025 & 2033
- Figure 73: South America Global Ophthalmology PACS Market Revenue Share (%), by Delivery Model 2025 & 2033
- Figure 74: South America Global Ophthalmology PACS Market Volume Share (%), by Delivery Model 2025 & 2033
- Figure 75: South America Global Ophthalmology PACS Market Revenue (million), by End User 2025 & 2033
- Figure 76: South America Global Ophthalmology PACS Market Volume (K Unit), by End User 2025 & 2033
- Figure 77: South America Global Ophthalmology PACS Market Revenue Share (%), by End User 2025 & 2033
- Figure 78: South America Global Ophthalmology PACS Market Volume Share (%), by End User 2025 & 2033
- Figure 79: South America Global Ophthalmology PACS Market Revenue (million), by Country 2025 & 2033
- Figure 80: South America Global Ophthalmology PACS Market Volume (K Unit), by Country 2025 & 2033
- Figure 81: South America Global Ophthalmology PACS Market Revenue Share (%), by Country 2025 & 2033
- Figure 82: South America Global Ophthalmology PACS Market Volume Share (%), by Country 2025 & 2033
List of Tables
- Table 1: Global Ophthalmology PACS Market Revenue million Forecast, by Type 2020 & 2033
- Table 2: Global Ophthalmology PACS Market Volume K Unit Forecast, by Type 2020 & 2033
- Table 3: Global Ophthalmology PACS Market Revenue million Forecast, by Delivery Model 2020 & 2033
- Table 4: Global Ophthalmology PACS Market Volume K Unit Forecast, by Delivery Model 2020 & 2033
- Table 5: Global Ophthalmology PACS Market Revenue million Forecast, by End User 2020 & 2033
- Table 6: Global Ophthalmology PACS Market Volume K Unit Forecast, by End User 2020 & 2033
- Table 7: Global Ophthalmology PACS Market Revenue million Forecast, by Region 2020 & 2033
- Table 8: Global Ophthalmology PACS Market Volume K Unit Forecast, by Region 2020 & 2033
- Table 9: Global Ophthalmology PACS Market Revenue million Forecast, by Type 2020 & 2033
- Table 10: Global Ophthalmology PACS Market Volume K Unit Forecast, by Type 2020 & 2033
- Table 11: Global Ophthalmology PACS Market Revenue million Forecast, by Delivery Model 2020 & 2033
- Table 12: Global Ophthalmology PACS Market Volume K Unit Forecast, by Delivery Model 2020 & 2033
- Table 13: Global Ophthalmology PACS Market Revenue million Forecast, by End User 2020 & 2033
- Table 14: Global Ophthalmology PACS Market Volume K Unit Forecast, by End User 2020 & 2033
- Table 15: Global Ophthalmology PACS Market Revenue million Forecast, by Country 2020 & 2033
- Table 16: Global Ophthalmology PACS Market Volume K Unit Forecast, by Country 2020 & 2033
- Table 17: United States Global Ophthalmology PACS Market Revenue (million) Forecast, by Application 2020 & 2033
- Table 18: United States Global Ophthalmology PACS Market Volume (K Unit) Forecast, by Application 2020 & 2033
- Table 19: Canada Global Ophthalmology PACS Market Revenue (million) Forecast, by Application 2020 & 2033
- Table 20: Canada Global Ophthalmology PACS Market Volume (K Unit) Forecast, by Application 2020 & 2033
- Table 21: Mexico Global Ophthalmology PACS Market Revenue (million) Forecast, by Application 2020 & 2033
- Table 22: Mexico Global Ophthalmology PACS Market Volume (K Unit) Forecast, by Application 2020 & 2033
- Table 23: Global Ophthalmology PACS Market Revenue million Forecast, by Type 2020 & 2033
- Table 24: Global Ophthalmology PACS Market Volume K Unit Forecast, by Type 2020 & 2033
- Table 25: Global Ophthalmology PACS Market Revenue million Forecast, by Delivery Model 2020 & 2033
- Table 26: Global Ophthalmology PACS Market Volume K Unit Forecast, by Delivery Model 2020 & 2033
- Table 27: Global Ophthalmology PACS Market Revenue million Forecast, by End User 2020 & 2033
- Table 28: Global Ophthalmology PACS Market Volume K Unit Forecast, by End User 2020 & 2033
- Table 29: Global Ophthalmology PACS Market Revenue million Forecast, by Country 2020 & 2033
- Table 30: Global Ophthalmology PACS Market Volume K Unit Forecast, by Country 2020 & 2033
- Table 31: Germany Global Ophthalmology PACS Market Revenue (million) Forecast, by Application 2020 & 2033
- Table 32: Germany Global Ophthalmology PACS Market Volume (K Unit) Forecast, by Application 2020 & 2033
- Table 33: United Kingdom Global Ophthalmology PACS Market Revenue (million) Forecast, by Application 2020 & 2033
- Table 34: United Kingdom Global Ophthalmology PACS Market Volume (K Unit) Forecast, by Application 2020 & 2033
- Table 35: France Global Ophthalmology PACS Market Revenue (million) Forecast, by Application 2020 & 2033
- Table 36: France Global Ophthalmology PACS Market Volume (K Unit) Forecast, by Application 2020 & 2033
- Table 37: Italy Global Ophthalmology PACS Market Revenue (million) Forecast, by Application 2020 & 2033
- Table 38: Italy Global Ophthalmology PACS Market Volume (K Unit) Forecast, by Application 2020 & 2033
- Table 39: Spain Global Ophthalmology PACS Market Revenue (million) Forecast, by Application 2020 & 2033
- Table 40: Spain Global Ophthalmology PACS Market Volume (K Unit) Forecast, by Application 2020 & 2033
- Table 41: Rest of Europe Global Ophthalmology PACS Market Revenue (million) Forecast, by Application 2020 & 2033
- Table 42: Rest of Europe Global Ophthalmology PACS Market Volume (K Unit) Forecast, by Application 2020 & 2033
- Table 43: Global Ophthalmology PACS Market Revenue million Forecast, by Type 2020 & 2033
- Table 44: Global Ophthalmology PACS Market Volume K Unit Forecast, by Type 2020 & 2033
- Table 45: Global Ophthalmology PACS Market Revenue million Forecast, by Delivery Model 2020 & 2033
- Table 46: Global Ophthalmology PACS Market Volume K Unit Forecast, by Delivery Model 2020 & 2033
- Table 47: Global Ophthalmology PACS Market Revenue million Forecast, by End User 2020 & 2033
- Table 48: Global Ophthalmology PACS Market Volume K Unit Forecast, by End User 2020 & 2033
- Table 49: Global Ophthalmology PACS Market Revenue million Forecast, by Country 2020 & 2033
- Table 50: Global Ophthalmology PACS Market Volume K Unit Forecast, by Country 2020 & 2033
- Table 51: China Global Ophthalmology PACS Market Revenue (million) Forecast, by Application 2020 & 2033
- Table 52: China Global Ophthalmology PACS Market Volume (K Unit) Forecast, by Application 2020 & 2033
- Table 53: Japan Global Ophthalmology PACS Market Revenue (million) Forecast, by Application 2020 & 2033
- Table 54: Japan Global Ophthalmology PACS Market Volume (K Unit) Forecast, by Application 2020 & 2033
- Table 55: India Global Ophthalmology PACS Market Revenue (million) Forecast, by Application 2020 & 2033
- Table 56: India Global Ophthalmology PACS Market Volume (K Unit) Forecast, by Application 2020 & 2033
- Table 57: Australia Global Ophthalmology PACS Market Revenue (million) Forecast, by Application 2020 & 2033
- Table 58: Australia Global Ophthalmology PACS Market Volume (K Unit) Forecast, by Application 2020 & 2033
- Table 59: South Korea Global Ophthalmology PACS Market Revenue (million) Forecast, by Application 2020 & 2033
- Table 60: South Korea Global Ophthalmology PACS Market Volume (K Unit) Forecast, by Application 2020 & 2033
- Table 61: Rest of Asia Pacific Global Ophthalmology PACS Market Revenue (million) Forecast, by Application 2020 & 2033
- Table 62: Rest of Asia Pacific Global Ophthalmology PACS Market Volume (K Unit) Forecast, by Application 2020 & 2033
- Table 63: Global Ophthalmology PACS Market Revenue million Forecast, by Type 2020 & 2033
- Table 64: Global Ophthalmology PACS Market Volume K Unit Forecast, by Type 2020 & 2033
- Table 65: Global Ophthalmology PACS Market Revenue million Forecast, by Delivery Model 2020 & 2033
- Table 66: Global Ophthalmology PACS Market Volume K Unit Forecast, by Delivery Model 2020 & 2033
- Table 67: Global Ophthalmology PACS Market Revenue million Forecast, by End User 2020 & 2033
- Table 68: Global Ophthalmology PACS Market Volume K Unit Forecast, by End User 2020 & 2033
- Table 69: Global Ophthalmology PACS Market Revenue million Forecast, by Country 2020 & 2033
- Table 70: Global Ophthalmology PACS Market Volume K Unit Forecast, by Country 2020 & 2033
- Table 71: GCC Global Ophthalmology PACS Market Revenue (million) Forecast, by Application 2020 & 2033
- Table 72: GCC Global Ophthalmology PACS Market Volume (K Unit) Forecast, by Application 2020 & 2033
- Table 73: South Africa Global Ophthalmology PACS Market Revenue (million) Forecast, by Application 2020 & 2033
- Table 74: South Africa Global Ophthalmology PACS Market Volume (K Unit) Forecast, by Application 2020 & 2033
- Table 75: Rest of Middle East and Africa Global Ophthalmology PACS Market Revenue (million) Forecast, by Application 2020 & 2033
- Table 76: Rest of Middle East and Africa Global Ophthalmology PACS Market Volume (K Unit) Forecast, by Application 2020 & 2033
- Table 77: Global Ophthalmology PACS Market Revenue million Forecast, by Type 2020 & 2033
- Table 78: Global Ophthalmology PACS Market Volume K Unit Forecast, by Type 2020 & 2033
- Table 79: Global Ophthalmology PACS Market Revenue million Forecast, by Delivery Model 2020 & 2033
- Table 80: Global Ophthalmology PACS Market Volume K Unit Forecast, by Delivery Model 2020 & 2033
- Table 81: Global Ophthalmology PACS Market Revenue million Forecast, by End User 2020 & 2033
- Table 82: Global Ophthalmology PACS Market Volume K Unit Forecast, by End User 2020 & 2033
- Table 83: Global Ophthalmology PACS Market Revenue million Forecast, by Country 2020 & 2033
- Table 84: Global Ophthalmology PACS Market Volume K Unit Forecast, by Country 2020 & 2033
- Table 85: Brazil Global Ophthalmology PACS Market Revenue (million) Forecast, by Application 2020 & 2033
- Table 86: Brazil Global Ophthalmology PACS Market Volume (K Unit) Forecast, by Application 2020 & 2033
- Table 87: Argentina Global Ophthalmology PACS Market Revenue (million) Forecast, by Application 2020 & 2033
- Table 88: Argentina Global Ophthalmology PACS Market Volume (K Unit) Forecast, by Application 2020 & 2033
- Table 89: Rest of South America Global Ophthalmology PACS Market Revenue (million) Forecast, by Application 2020 & 2033
- Table 90: Rest of South America Global Ophthalmology PACS Market Volume (K Unit) Forecast, by Application 2020 & 2033
Frequently Asked Questions
1. What is the projected Compound Annual Growth Rate (CAGR) of the Global Ophthalmology PACS Market?
The projected CAGR is approximately 8.4%.
2. Which companies are prominent players in the Global Ophthalmology PACS Market?
Key companies in the market include VersaSuite, Heidelberg Engineering GmbH, Carl Zeiss Meditec AG, Medical Standard Co Ltd, IBM Corporation, Agfa-Gevaert N V, Visbion Limited, Sonomed Escalon.
3. What are the main segments of the Global Ophthalmology PACS Market?
The market segments include Type, Delivery Model, End User.
4. Can you provide details about the market size?
The market size is estimated to be USD 184.4 million as of 2022.
5. What are some drivers contributing to market growth?
High Prevalence of Eye Diseases; Increasing Geriatric Population; Expansion of Teleophthalmology.
6. What are the notable trends driving market growth?
Integrated PACS Segment is Expected to Show Better Growth Over the Forecast Years.
7. Are there any restraints impacting market growth?
High Implementation and Maintenance Costs.
8. Can you provide examples of recent developments in the market?
May 2022: OMNY Health partnered with community-based ophthalmology practices to launch a real-world data ecosystem focused on driving collaborative research partnerships to advance treatments and improve outcomes for patients with ophthalmic disorders.
9. What pricing options are available for accessing the report?
Pricing options include single-user, multi-user, and enterprise licenses priced at USD 4750, USD 5250, and USD 8750 respectively.
10. Is the market size provided in terms of value or volume?
The market size is provided in terms of value, measured in million and volume, measured in K Unit.
11. Are there any specific market keywords associated with the report?
Yes, the market keyword associated with the report is "Global Ophthalmology PACS Market," which aids in identifying and referencing the specific market segment covered.
12. How do I determine which pricing option suits my needs best?
The pricing options vary based on user requirements and access needs. Individual users may opt for single-user licenses, while businesses requiring broader access may choose multi-user or enterprise licenses for cost-effective access to the report.
13. Are there any additional resources or data provided in the Global Ophthalmology PACS Market report?
While the report offers comprehensive insights, it's advisable to review the specific contents or supplementary materials provided to ascertain if additional resources or data are available.
14. How can I stay updated on further developments or reports in the Global Ophthalmology PACS Market?
To stay informed about further developments, trends, and reports in the Global Ophthalmology PACS Market, consider subscribing to industry newsletters, following relevant companies and organizations, or regularly checking reputable industry news sources and publications.
Methodology
Step 1 - Identification of Relevant Samples Size from Population Database


Step 2 - Approaches for Defining Global Market Size (Value, Volume* & Price*)

Note*: In applicable scenarios
Step 3 - Data Sources
Primary Research
- Web Analytics
- Survey Reports
- Research Institute
- Latest Research Reports
- Opinion Leaders
Secondary Research
- Annual Reports
- White Paper
- Latest Press Release
- Industry Association
- Paid Database
- Investor Presentations

Step 4 - Data Triangulation
Involves using different sources of information in order to increase the validity of a study
These sources are likely to be stakeholders in a program - participants, other researchers, program staff, other community members, and so on.
Then we put all data in single framework & apply various statistical tools to find out the dynamic on the market.
During the analysis stage, feedback from the stakeholder groups would be compared to determine areas of agreement as well as areas of divergence