

Key Insights
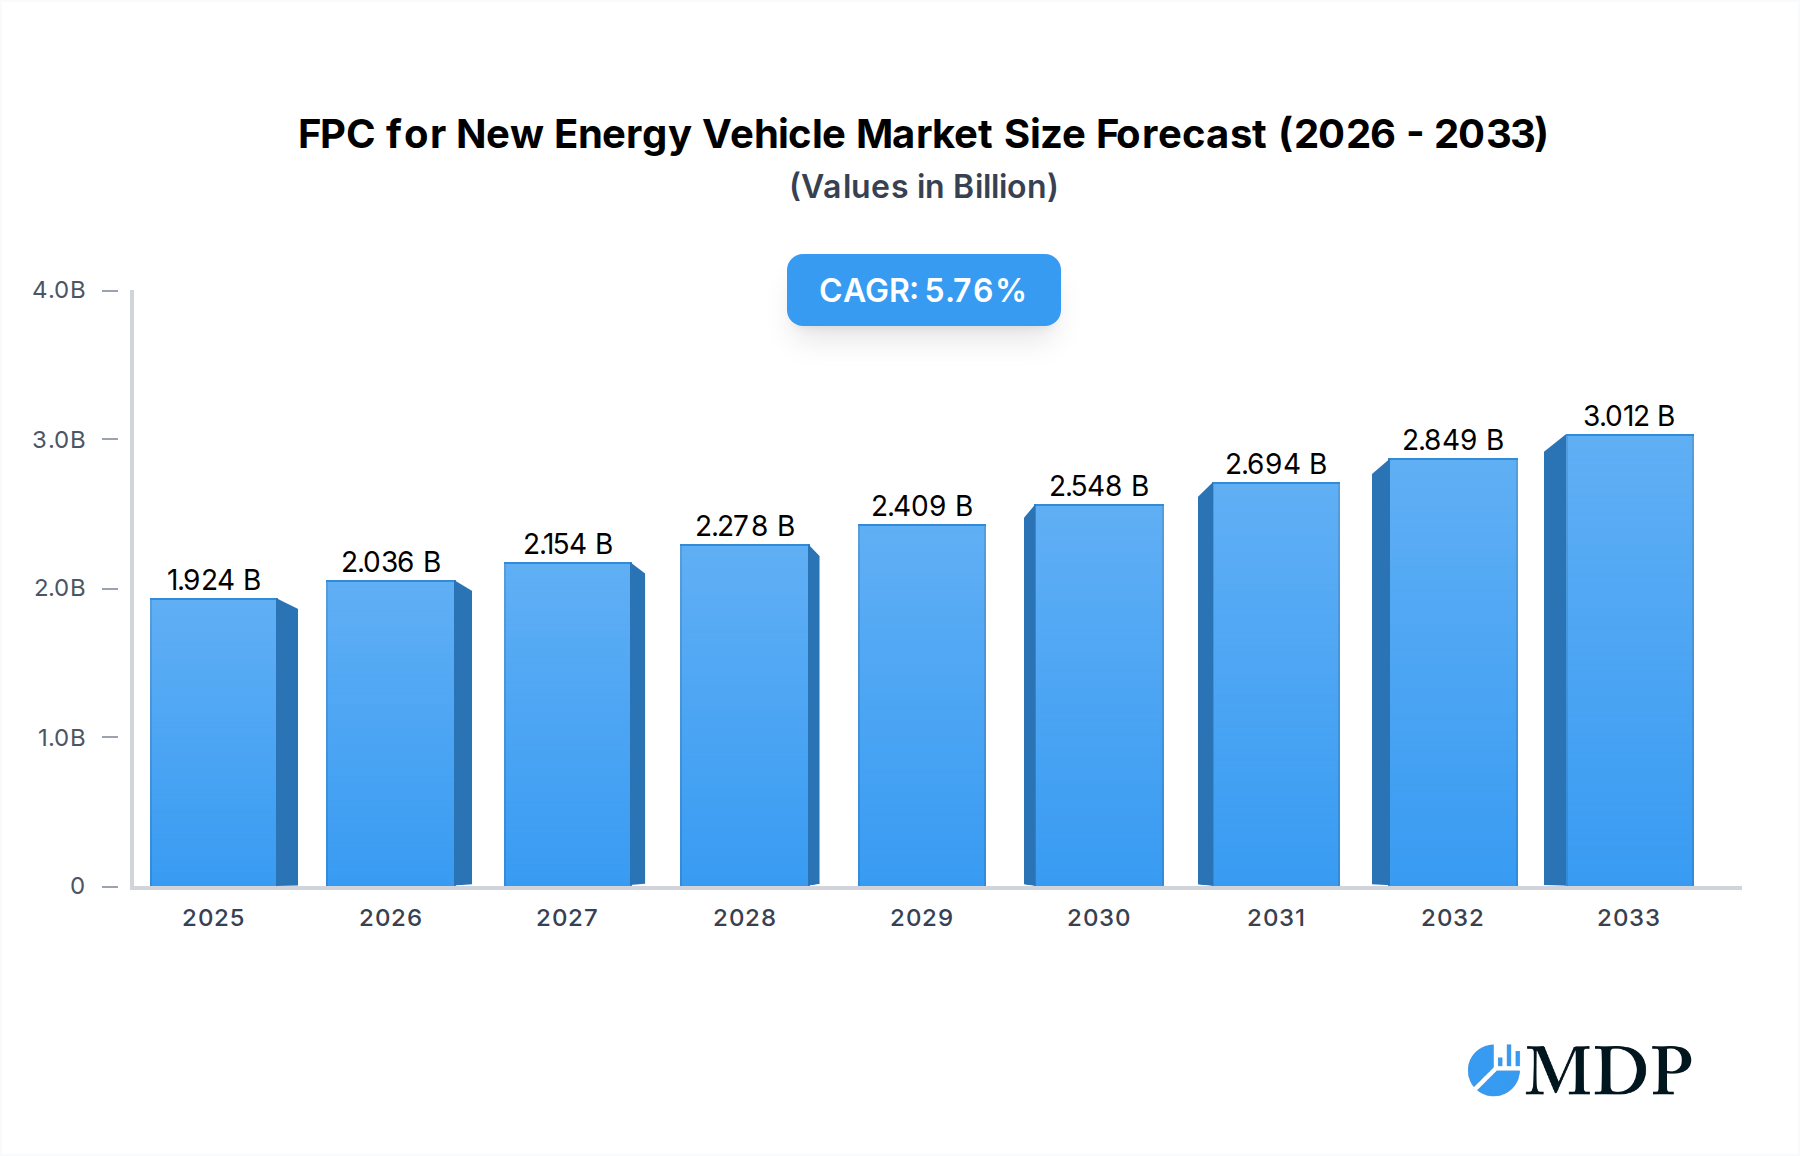
The Flexible Printed Circuit (FPC) market for new energy vehicles (NEVs) is poised for substantial expansion, driven by the accelerating global shift towards electric mobility. In 2025, the market is estimated at $1,924 million, with a projected Compound Annual Growth Rate (CAGR) of 5.7% through 2033. This robust growth is primarily fueled by the increasing demand for lightweight, compact, and high-performance electronic components within NEVs. Key applications like advanced driver-assistance systems (ADAS), infotainment, battery management systems, and the intricate wiring harnesses of electric powertrains are heavily reliant on the flexibility, reliability, and space-saving advantages offered by FPCs. The ever-growing complexity of NEV electronics, coupled with stringent automotive safety and efficiency standards, further solidifies the indispensable role of FPCs in modern electric vehicle architecture.

FPC for New Energy Vehicle Market Size (In Billion)
Emerging trends in the NEV FPC market include the increasing adoption of multi-layer and rigid-flex FPCs to accommodate higher component densities and more complex functionalities. Innovations in materials science are also contributing, with a focus on enhanced thermal management, improved signal integrity, and greater durability to withstand the demanding automotive environment. While the market is experiencing strong tailwinds from government initiatives promoting EV adoption and decreasing battery costs, potential restraints such as the volatility of raw material prices (e.g., copper, polyimide) and the need for specialized manufacturing expertise could present challenges. However, the sheer volume of NEV production, coupled with technological advancements in FPC design and manufacturing, indicates a promising trajectory for this vital segment of the automotive electronics industry.
FPC for New Energy Vehicle Company Market Share
Unveiling the Future of Electric Mobility: The Comprehensive FPC for New Energy Vehicle Market Report (2019-2033)
Gain unparalleled insights into the rapidly evolving FPC for New Energy Vehicle market with this definitive industry report. Spanning a comprehensive study period from 2019 to 2033, with a base and estimated year of 2025 and a robust forecast period from 2025 to 2033, this report delves into the intricate dynamics shaping the future of electric vehicle electronics. We analyze the critical role of Flexible Printed Circuits (FPCs) in powering EV batteries, enhancing EV lighting, enabling advanced EV sensors, integrating sophisticated EV switches, and supporting a myriad of other essential EV components. Whether you're focused on single-layer, double-layer, multi-layer, or rigid-flex FPCs, this report provides the granular data and strategic analysis you need to navigate this high-growth sector.
FPC for New Energy Vehicle Market Dynamics & Concentration
The FPC for New Energy Vehicle market is characterized by a dynamic and evolving concentration, driven by continuous innovation and increasing demand for lightweight, flexible, and high-performance electronic solutions. Key innovation drivers include advancements in material science for enhanced conductivity and heat dissipation, miniaturization of components, and the integration of smart functionalities. Regulatory frameworks worldwide, particularly those promoting electric vehicle adoption and emission reductions, significantly influence market expansion. While product substitutes for FPCs exist in certain niche applications, their unique advantages in space-constrained and vibration-sensitive EV environments maintain their dominance. End-user trends are heavily influenced by the increasing adoption of autonomous driving features, advanced driver-assistance systems (ADAS), and enhanced in-car infotainment, all of which require sophisticated and flexible circuitry. Mergers and acquisitions (M&A) activities are indicative of market consolidation and strategic expansion, with an estimated XX M&A deal counts observed during the historical period (2019-2024). Leading companies like ZDT, Fujikura, and Nippon Mektron hold significant market shares, leveraging their technological prowess and established supply chains.
- Market Share: Leading players hold an aggregate market share of over 60%.
- M&A Activities: XX M&A deals were recorded between 2019 and 2024, signaling industry consolidation.
- Innovation Focus: Advancements in high-density interconnects (HDIs) and thermal management solutions.
- Regulatory Impact: Government incentives for EV manufacturing and adoption are critical growth catalysts.
FPC for New Energy Vehicle Industry Trends & Analysis
The FPC for New Energy Vehicle industry is experiencing phenomenal growth, fueled by an escalating global transition towards sustainable transportation. The Compound Annual Growth Rate (CAGR) for this sector is projected to be approximately xx% during the forecast period (2025-2033), reflecting the robust demand for electric vehicles. Market penetration of EVs continues to surge, driven by improving battery technology, expanding charging infrastructure, and growing consumer environmental consciousness. Technological disruptions are paramount, with ongoing research and development focusing on FPCs capable of withstanding higher operating temperatures, improving signal integrity for complex electronic systems, and enabling seamless integration of power and data transmission. Consumer preferences are increasingly leaning towards vehicles with enhanced safety features, advanced connectivity, and personalized digital experiences, all of which rely heavily on the flexible and compact nature of FPCs. The competitive landscape is dynamic, with established players continuously innovating to maintain their market positions while new entrants are emerging with specialized FPC solutions for emerging EV applications. The increasing complexity of EV architectures, from battery management systems to sophisticated sensor arrays, necessitates the adoption of advanced FPC solutions that offer superior reliability and space efficiency. The push for lighter vehicles to improve range efficiency also favors the use of FPCs over traditional rigid PCBs.
Leading Markets & Segments in FPC for New Energy Vehicle
The FPC for New Energy Vehicle market is segmented by Application and Type, with significant regional dominance. EV Battery applications are currently the largest and fastest-growing segment, driven by the critical need for reliable and efficient power management within electric vehicle battery packs. This includes FPCs for battery cell interconnections, voltage and temperature monitoring, and current sensing, demanding high reliability and thermal management capabilities. EV Lighting is another significant segment, utilizing FPCs for interior and exterior lighting systems, including advanced LED matrix headlights and ambient interior lighting, where flexibility and design freedom are crucial. EV Sensors represent a rapidly expanding area, as the proliferation of ADAS and autonomous driving technologies requires a multitude of sensors for object detection, navigation, and environmental monitoring, all of which benefit from the compact and adaptable nature of FPCs. EV Switches also represent a steady market, particularly for user interface components and internal system controls.
The dominant FPC Type in the market is Multi-layer FPC, offering increased circuit density and functionality within a compact footprint, essential for the complex electronic architectures of modern EVs. Rigid-Flex FPC is also gaining considerable traction due to its ability to combine the rigidity of PCBs with the flexibility of FPCs, offering structural support and eliminating connectors in certain applications, further reducing weight and assembly complexity.
Dominant Region: North America and Europe are leading regions, driven by strong government support for EV adoption, substantial investments in EV manufacturing, and a high consumer propensity for adopting new technologies. Economic policies such as tax credits for EV purchases and manufacturing incentives play a pivotal role.
- Key Drivers for EV Battery Dominance:
- Increasing EV battery pack sizes and complexity.
- Demand for precise battery management systems (BMS).
- Requirement for lightweight and space-saving solutions.
- Key Drivers for Rigid-Flex FPC Growth:
- Elimination of connectors, reducing failure points and assembly costs.
- Enhanced structural integrity in vibration-prone environments.
- Integration of complex circuitry in confined spaces.
- Regional Dominance Factors:
- Stringent emission regulations and ambitious EV sales targets.
- Significant R&D investment in battery and EV technology.
- Presence of major global automakers with substantial EV production.
FPC for New Energy Vehicle Product Developments
Product developments in the FPC for New Energy Vehicle sector are focused on enhancing performance, reliability, and integration. Innovations include the development of high-temperature resistant FPCs for demanding under-the-hood applications and battery pack environments. Advances in flexible circuit materials are enabling higher current carrying capacities and improved signal integrity, crucial for high-speed data transmission in advanced driver-assistance systems. The trend towards thinner and more flexible FPCs is driven by the need for compact and lightweight designs in next-generation EVs. Companies are also developing FPCs with integrated shielding for electromagnetic interference (EMI) reduction, critical for sensitive automotive electronics. These advancements offer competitive advantages by enabling manufacturers to create more efficient, safer, and feature-rich electric vehicles.
Key Drivers of FPC for New Energy Vehicle Growth
The rapid growth of the FPC for New Energy Vehicle market is propelled by several interconnected factors.
- Technological Advancements: Continuous improvements in battery technology, sensor integration, and in-car electronics necessitate advanced flexible circuit solutions.
- Government Regulations and Incentives: Global policies promoting EV adoption and stringent emission standards create a favorable market environment.
- Increasing EV Production Volumes: As major automakers scale up their EV production, the demand for FPCs escalates proportionally.
- Demand for Lightweight and Space-Saving Solutions: FPCs offer significant weight and space advantages over traditional PCBs, aligning with the automotive industry's focus on efficiency and design optimization.
Challenges in the FPC for New Energy Vehicle Market
Despite its strong growth trajectory, the FPC for New Energy Vehicle market faces certain challenges.
- Supply Chain Volatility: Geopolitical events and raw material price fluctuations can impact the availability and cost of critical components.
- High Initial Investment Costs: The development and manufacturing of advanced FPCs require substantial capital investment in specialized equipment and R&D.
- Stringent Automotive Qualification Standards: FPC manufacturers must meet rigorous quality and reliability standards set by the automotive industry, which can be a lengthy and costly process.
- Competition from Alternative Technologies: While FPCs are dominant, ongoing advancements in alternative flexible electronics could pose future competition in specific applications.
Emerging Opportunities in FPC for New Energy Vehicle
The FPC for New Energy Vehicle market presents substantial emerging opportunities.
- Advancements in Solid-State Batteries: The transition to solid-state batteries, with their unique form factors and thermal management needs, will create new demand for specialized FPCs.
- Expansion of Autonomous Driving Features: The increasing sophistication of autonomous driving systems will drive demand for high-density FPCs for sensor integration and complex control units.
- Vehicle-to-Everything (V2X) Communication: The rollout of V2X technologies will require advanced flexible circuitry for seamless data exchange between vehicles and infrastructure.
- Smart Surface Integration: The integration of FPCs into smart surfaces, such as touch-sensitive interiors and adaptive lighting, offers novel application possibilities.
Leading Players in the FPC for New Energy Vehicle Sector
- ZDT
- Fujikura
- Nippon Mektron
- SEI
- Flexium
- MFLEX
- CAREER
- SIFLEX
- Interflex
- Bhflex
- KINWONG
- Hongxin
- ICHIA
- Daeduck GDS
- AKM
Key Milestones in FPC for New Energy Vehicle Industry
- 2019: Increased adoption of FPCs in advanced Battery Management Systems (BMS) for improved safety and performance.
- 2020: Significant surge in FPC demand for EV lighting and sensor applications driven by new model launches.
- 2021: Major breakthroughs in high-temperature resistant FPC materials for enhanced thermal management in EV powertrains.
- 2022: Growing interest and investment in Rigid-Flex FPCs for their space-saving and integration benefits in EV architectures.
- 2023: Expansion of FPC manufacturing capabilities by key players to meet escalating global EV production demands.
- 2024: Enhanced focus on sustainable manufacturing practices and recyclable materials in FPC production for EVs.
Strategic Outlook for FPC for New Energy Vehicle Market
The strategic outlook for the FPC for New Energy Vehicle market is exceptionally bright, driven by the accelerating global transition to electric mobility and the continuous evolution of automotive electronics. Key growth accelerators include further miniaturization and integration of FPC functionalities, enabling more sophisticated and compact EV designs. Strategic partnerships between FPC manufacturers and automotive OEMs will be crucial for co-developing tailored solutions that meet specific vehicle platform requirements. Market expansion will also be driven by the increasing demand for FPCs in emerging EV markets and the development of next-generation EV technologies like advanced charging systems and integrated vehicle platforms. The sustained commitment to electrification by major automotive players ensures a robust and expanding future for FPCs in the new energy vehicle sector.
FPC for New Energy Vehicle Segmentation
-
1. Application
- 1.1. EV Battery
- 1.2. EV Lighting
- 1.3. EV Sensor
- 1.4. EV Switches
- 1.5. Others
-
2. Types
- 2.1. Single-layer FPC
- 2.2. Double-layer FPC
- 2.3. Multi-layer FPC
- 2.4. Rigid-Flex FPC
FPC for New Energy Vehicle Segmentation By Geography
-
1. North America
- 1.1. United States
- 1.2. Canada
- 1.3. Mexico
-
2. South America
- 2.1. Brazil
- 2.2. Argentina
- 2.3. Rest of South America
-
3. Europe
- 3.1. United Kingdom
- 3.2. Germany
- 3.3. France
- 3.4. Italy
- 3.5. Spain
- 3.6. Russia
- 3.7. Benelux
- 3.8. Nordics
- 3.9. Rest of Europe
-
4. Middle East & Africa
- 4.1. Turkey
- 4.2. Israel
- 4.3. GCC
- 4.4. North Africa
- 4.5. South Africa
- 4.6. Rest of Middle East & Africa
-
5. Asia Pacific
- 5.1. China
- 5.2. India
- 5.3. Japan
- 5.4. South Korea
- 5.5. ASEAN
- 5.6. Oceania
- 5.7. Rest of Asia Pacific
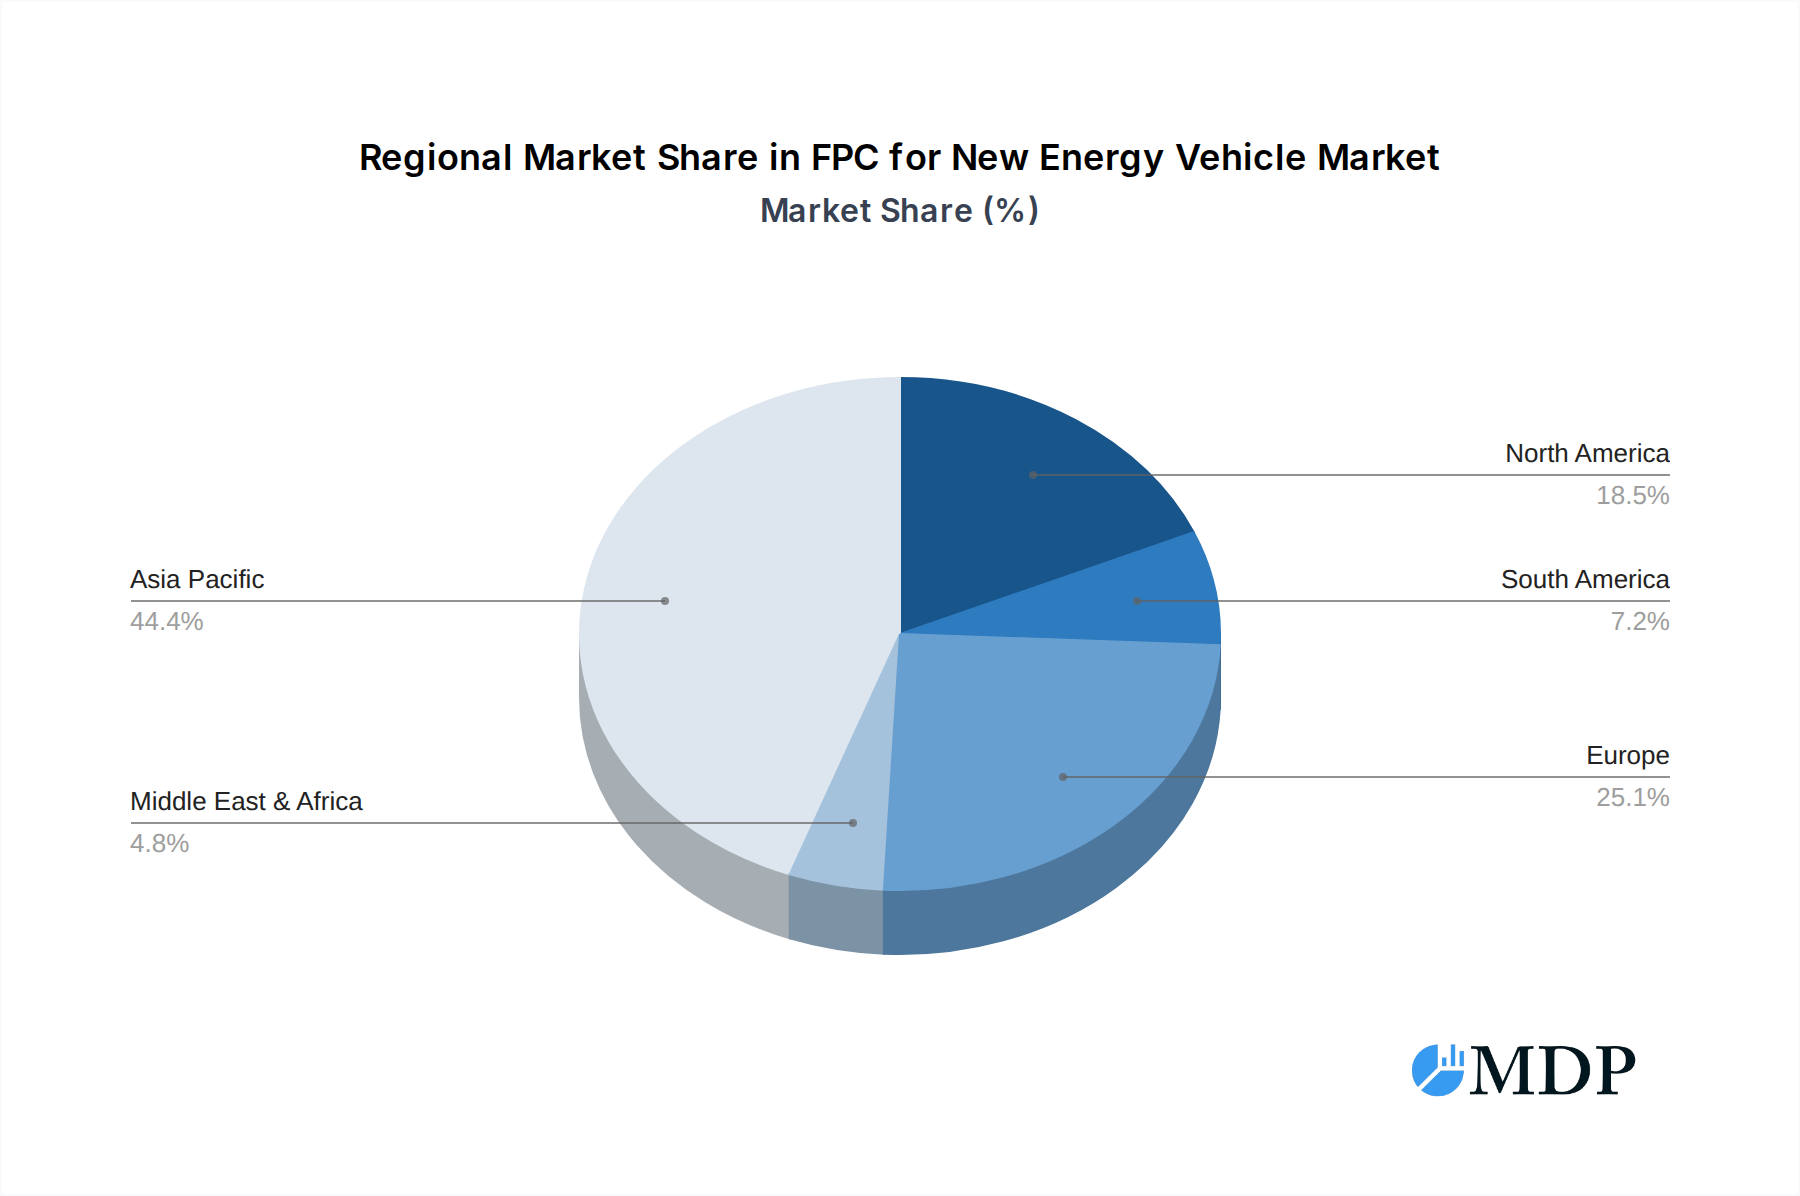
FPC for New Energy Vehicle Regional Market Share
Geographic Coverage of FPC for New Energy Vehicle
FPC for New Energy Vehicle REPORT HIGHLIGHTS
| Aspects | Details |
|---|---|
| Study Period | 2020-2034 |
| Base Year | 2025 |
| Estimated Year | 2026 |
| Forecast Period | 2026-2034 |
| Historical Period | 2020-2025 |
| Growth Rate | CAGR of 5.7% from 2020-2034 |
| Segmentation |
|
Table of Contents
- 1. Introduction
- 1.1. Research Scope
- 1.2. Market Segmentation
- 1.3. Research Methodology
- 1.4. Definitions and Assumptions
- 2. Executive Summary
- 2.1. Introduction
- 3. Market Dynamics
- 3.1. Introduction
- 3.2. Market Drivers
- 3.3. Market Restrains
- 3.4. Market Trends
- 4. Market Factor Analysis
- 4.1. Porters Five Forces
- 4.2. Supply/Value Chain
- 4.3. PESTEL analysis
- 4.4. Market Entropy
- 4.5. Patent/Trademark Analysis
- 5. Global FPC for New Energy Vehicle Analysis, Insights and Forecast, 2020-2032
- 5.1. Market Analysis, Insights and Forecast - by Application
- 5.1.1. EV Battery
- 5.1.2. EV Lighting
- 5.1.3. EV Sensor
- 5.1.4. EV Switches
- 5.1.5. Others
- 5.2. Market Analysis, Insights and Forecast - by Types
- 5.2.1. Single-layer FPC
- 5.2.2. Double-layer FPC
- 5.2.3. Multi-layer FPC
- 5.2.4. Rigid-Flex FPC
- 5.3. Market Analysis, Insights and Forecast - by Region
- 5.3.1. North America
- 5.3.2. South America
- 5.3.3. Europe
- 5.3.4. Middle East & Africa
- 5.3.5. Asia Pacific
- 5.1. Market Analysis, Insights and Forecast - by Application
- 6. North America FPC for New Energy Vehicle Analysis, Insights and Forecast, 2020-2032
- 6.1. Market Analysis, Insights and Forecast - by Application
- 6.1.1. EV Battery
- 6.1.2. EV Lighting
- 6.1.3. EV Sensor
- 6.1.4. EV Switches
- 6.1.5. Others
- 6.2. Market Analysis, Insights and Forecast - by Types
- 6.2.1. Single-layer FPC
- 6.2.2. Double-layer FPC
- 6.2.3. Multi-layer FPC
- 6.2.4. Rigid-Flex FPC
- 6.1. Market Analysis, Insights and Forecast - by Application
- 7. South America FPC for New Energy Vehicle Analysis, Insights and Forecast, 2020-2032
- 7.1. Market Analysis, Insights and Forecast - by Application
- 7.1.1. EV Battery
- 7.1.2. EV Lighting
- 7.1.3. EV Sensor
- 7.1.4. EV Switches
- 7.1.5. Others
- 7.2. Market Analysis, Insights and Forecast - by Types
- 7.2.1. Single-layer FPC
- 7.2.2. Double-layer FPC
- 7.2.3. Multi-layer FPC
- 7.2.4. Rigid-Flex FPC
- 7.1. Market Analysis, Insights and Forecast - by Application
- 8. Europe FPC for New Energy Vehicle Analysis, Insights and Forecast, 2020-2032
- 8.1. Market Analysis, Insights and Forecast - by Application
- 8.1.1. EV Battery
- 8.1.2. EV Lighting
- 8.1.3. EV Sensor
- 8.1.4. EV Switches
- 8.1.5. Others
- 8.2. Market Analysis, Insights and Forecast - by Types
- 8.2.1. Single-layer FPC
- 8.2.2. Double-layer FPC
- 8.2.3. Multi-layer FPC
- 8.2.4. Rigid-Flex FPC
- 8.1. Market Analysis, Insights and Forecast - by Application
- 9. Middle East & Africa FPC for New Energy Vehicle Analysis, Insights and Forecast, 2020-2032
- 9.1. Market Analysis, Insights and Forecast - by Application
- 9.1.1. EV Battery
- 9.1.2. EV Lighting
- 9.1.3. EV Sensor
- 9.1.4. EV Switches
- 9.1.5. Others
- 9.2. Market Analysis, Insights and Forecast - by Types
- 9.2.1. Single-layer FPC
- 9.2.2. Double-layer FPC
- 9.2.3. Multi-layer FPC
- 9.2.4. Rigid-Flex FPC
- 9.1. Market Analysis, Insights and Forecast - by Application
- 10. Asia Pacific FPC for New Energy Vehicle Analysis, Insights and Forecast, 2020-2032
- 10.1. Market Analysis, Insights and Forecast - by Application
- 10.1.1. EV Battery
- 10.1.2. EV Lighting
- 10.1.3. EV Sensor
- 10.1.4. EV Switches
- 10.1.5. Others
- 10.2. Market Analysis, Insights and Forecast - by Types
- 10.2.1. Single-layer FPC
- 10.2.2. Double-layer FPC
- 10.2.3. Multi-layer FPC
- 10.2.4. Rigid-Flex FPC
- 10.1. Market Analysis, Insights and Forecast - by Application
- 11. Competitive Analysis
- 11.1. Global Market Share Analysis 2025
- 11.2. Company Profiles
- 11.2.1 ZDT
- 11.2.1.1. Overview
- 11.2.1.2. Products
- 11.2.1.3. SWOT Analysis
- 11.2.1.4. Recent Developments
- 11.2.1.5. Financials (Based on Availability)
- 11.2.2 Fujikura
- 11.2.2.1. Overview
- 11.2.2.2. Products
- 11.2.2.3. SWOT Analysis
- 11.2.2.4. Recent Developments
- 11.2.2.5. Financials (Based on Availability)
- 11.2.3 Nippon Mektron
- 11.2.3.1. Overview
- 11.2.3.2. Products
- 11.2.3.3. SWOT Analysis
- 11.2.3.4. Recent Developments
- 11.2.3.5. Financials (Based on Availability)
- 11.2.4 SEI
- 11.2.4.1. Overview
- 11.2.4.2. Products
- 11.2.4.3. SWOT Analysis
- 11.2.4.4. Recent Developments
- 11.2.4.5. Financials (Based on Availability)
- 11.2.5 Flexium
- 11.2.5.1. Overview
- 11.2.5.2. Products
- 11.2.5.3. SWOT Analysis
- 11.2.5.4. Recent Developments
- 11.2.5.5. Financials (Based on Availability)
- 11.2.6 MFLEX
- 11.2.6.1. Overview
- 11.2.6.2. Products
- 11.2.6.3. SWOT Analysis
- 11.2.6.4. Recent Developments
- 11.2.6.5. Financials (Based on Availability)
- 11.2.7 CAREER
- 11.2.7.1. Overview
- 11.2.7.2. Products
- 11.2.7.3. SWOT Analysis
- 11.2.7.4. Recent Developments
- 11.2.7.5. Financials (Based on Availability)
- 11.2.8 SIFLEX
- 11.2.8.1. Overview
- 11.2.8.2. Products
- 11.2.8.3. SWOT Analysis
- 11.2.8.4. Recent Developments
- 11.2.8.5. Financials (Based on Availability)
- 11.2.9 Interflex
- 11.2.9.1. Overview
- 11.2.9.2. Products
- 11.2.9.3. SWOT Analysis
- 11.2.9.4. Recent Developments
- 11.2.9.5. Financials (Based on Availability)
- 11.2.10 Bhflex
- 11.2.10.1. Overview
- 11.2.10.2. Products
- 11.2.10.3. SWOT Analysis
- 11.2.10.4. Recent Developments
- 11.2.10.5. Financials (Based on Availability)
- 11.2.11 KINWONG
- 11.2.11.1. Overview
- 11.2.11.2. Products
- 11.2.11.3. SWOT Analysis
- 11.2.11.4. Recent Developments
- 11.2.11.5. Financials (Based on Availability)
- 11.2.12 Hongxin
- 11.2.12.1. Overview
- 11.2.12.2. Products
- 11.2.12.3. SWOT Analysis
- 11.2.12.4. Recent Developments
- 11.2.12.5. Financials (Based on Availability)
- 11.2.13 ICHIA
- 11.2.13.1. Overview
- 11.2.13.2. Products
- 11.2.13.3. SWOT Analysis
- 11.2.13.4. Recent Developments
- 11.2.13.5. Financials (Based on Availability)
- 11.2.14 Daeduck GDS
- 11.2.14.1. Overview
- 11.2.14.2. Products
- 11.2.14.3. SWOT Analysis
- 11.2.14.4. Recent Developments
- 11.2.14.5. Financials (Based on Availability)
- 11.2.15 AKM
- 11.2.15.1. Overview
- 11.2.15.2. Products
- 11.2.15.3. SWOT Analysis
- 11.2.15.4. Recent Developments
- 11.2.15.5. Financials (Based on Availability)
- 11.2.1 ZDT
List of Figures
- Figure 1: Global FPC for New Energy Vehicle Revenue Breakdown (million, %) by Region 2025 & 2033
- Figure 2: Global FPC for New Energy Vehicle Volume Breakdown (K, %) by Region 2025 & 2033
- Figure 3: North America FPC for New Energy Vehicle Revenue (million), by Application 2025 & 2033
- Figure 4: North America FPC for New Energy Vehicle Volume (K), by Application 2025 & 2033
- Figure 5: North America FPC for New Energy Vehicle Revenue Share (%), by Application 2025 & 2033
- Figure 6: North America FPC for New Energy Vehicle Volume Share (%), by Application 2025 & 2033
- Figure 7: North America FPC for New Energy Vehicle Revenue (million), by Types 2025 & 2033
- Figure 8: North America FPC for New Energy Vehicle Volume (K), by Types 2025 & 2033
- Figure 9: North America FPC for New Energy Vehicle Revenue Share (%), by Types 2025 & 2033
- Figure 10: North America FPC for New Energy Vehicle Volume Share (%), by Types 2025 & 2033
- Figure 11: North America FPC for New Energy Vehicle Revenue (million), by Country 2025 & 2033
- Figure 12: North America FPC for New Energy Vehicle Volume (K), by Country 2025 & 2033
- Figure 13: North America FPC for New Energy Vehicle Revenue Share (%), by Country 2025 & 2033
- Figure 14: North America FPC for New Energy Vehicle Volume Share (%), by Country 2025 & 2033
- Figure 15: South America FPC for New Energy Vehicle Revenue (million), by Application 2025 & 2033
- Figure 16: South America FPC for New Energy Vehicle Volume (K), by Application 2025 & 2033
- Figure 17: South America FPC for New Energy Vehicle Revenue Share (%), by Application 2025 & 2033
- Figure 18: South America FPC for New Energy Vehicle Volume Share (%), by Application 2025 & 2033
- Figure 19: South America FPC for New Energy Vehicle Revenue (million), by Types 2025 & 2033
- Figure 20: South America FPC for New Energy Vehicle Volume (K), by Types 2025 & 2033
- Figure 21: South America FPC for New Energy Vehicle Revenue Share (%), by Types 2025 & 2033
- Figure 22: South America FPC for New Energy Vehicle Volume Share (%), by Types 2025 & 2033
- Figure 23: South America FPC for New Energy Vehicle Revenue (million), by Country 2025 & 2033
- Figure 24: South America FPC for New Energy Vehicle Volume (K), by Country 2025 & 2033
- Figure 25: South America FPC for New Energy Vehicle Revenue Share (%), by Country 2025 & 2033
- Figure 26: South America FPC for New Energy Vehicle Volume Share (%), by Country 2025 & 2033
- Figure 27: Europe FPC for New Energy Vehicle Revenue (million), by Application 2025 & 2033
- Figure 28: Europe FPC for New Energy Vehicle Volume (K), by Application 2025 & 2033
- Figure 29: Europe FPC for New Energy Vehicle Revenue Share (%), by Application 2025 & 2033
- Figure 30: Europe FPC for New Energy Vehicle Volume Share (%), by Application 2025 & 2033
- Figure 31: Europe FPC for New Energy Vehicle Revenue (million), by Types 2025 & 2033
- Figure 32: Europe FPC for New Energy Vehicle Volume (K), by Types 2025 & 2033
- Figure 33: Europe FPC for New Energy Vehicle Revenue Share (%), by Types 2025 & 2033
- Figure 34: Europe FPC for New Energy Vehicle Volume Share (%), by Types 2025 & 2033
- Figure 35: Europe FPC for New Energy Vehicle Revenue (million), by Country 2025 & 2033
- Figure 36: Europe FPC for New Energy Vehicle Volume (K), by Country 2025 & 2033
- Figure 37: Europe FPC for New Energy Vehicle Revenue Share (%), by Country 2025 & 2033
- Figure 38: Europe FPC for New Energy Vehicle Volume Share (%), by Country 2025 & 2033
- Figure 39: Middle East & Africa FPC for New Energy Vehicle Revenue (million), by Application 2025 & 2033
- Figure 40: Middle East & Africa FPC for New Energy Vehicle Volume (K), by Application 2025 & 2033
- Figure 41: Middle East & Africa FPC for New Energy Vehicle Revenue Share (%), by Application 2025 & 2033
- Figure 42: Middle East & Africa FPC for New Energy Vehicle Volume Share (%), by Application 2025 & 2033
- Figure 43: Middle East & Africa FPC for New Energy Vehicle Revenue (million), by Types 2025 & 2033
- Figure 44: Middle East & Africa FPC for New Energy Vehicle Volume (K), by Types 2025 & 2033
- Figure 45: Middle East & Africa FPC for New Energy Vehicle Revenue Share (%), by Types 2025 & 2033
- Figure 46: Middle East & Africa FPC for New Energy Vehicle Volume Share (%), by Types 2025 & 2033
- Figure 47: Middle East & Africa FPC for New Energy Vehicle Revenue (million), by Country 2025 & 2033
- Figure 48: Middle East & Africa FPC for New Energy Vehicle Volume (K), by Country 2025 & 2033
- Figure 49: Middle East & Africa FPC for New Energy Vehicle Revenue Share (%), by Country 2025 & 2033
- Figure 50: Middle East & Africa FPC for New Energy Vehicle Volume Share (%), by Country 2025 & 2033
- Figure 51: Asia Pacific FPC for New Energy Vehicle Revenue (million), by Application 2025 & 2033
- Figure 52: Asia Pacific FPC for New Energy Vehicle Volume (K), by Application 2025 & 2033
- Figure 53: Asia Pacific FPC for New Energy Vehicle Revenue Share (%), by Application 2025 & 2033
- Figure 54: Asia Pacific FPC for New Energy Vehicle Volume Share (%), by Application 2025 & 2033
- Figure 55: Asia Pacific FPC for New Energy Vehicle Revenue (million), by Types 2025 & 2033
- Figure 56: Asia Pacific FPC for New Energy Vehicle Volume (K), by Types 2025 & 2033
- Figure 57: Asia Pacific FPC for New Energy Vehicle Revenue Share (%), by Types 2025 & 2033
- Figure 58: Asia Pacific FPC for New Energy Vehicle Volume Share (%), by Types 2025 & 2033
- Figure 59: Asia Pacific FPC for New Energy Vehicle Revenue (million), by Country 2025 & 2033
- Figure 60: Asia Pacific FPC for New Energy Vehicle Volume (K), by Country 2025 & 2033
- Figure 61: Asia Pacific FPC for New Energy Vehicle Revenue Share (%), by Country 2025 & 2033
- Figure 62: Asia Pacific FPC for New Energy Vehicle Volume Share (%), by Country 2025 & 2033
List of Tables
- Table 1: Global FPC for New Energy Vehicle Revenue million Forecast, by Application 2020 & 2033
- Table 2: Global FPC for New Energy Vehicle Volume K Forecast, by Application 2020 & 2033
- Table 3: Global FPC for New Energy Vehicle Revenue million Forecast, by Types 2020 & 2033
- Table 4: Global FPC for New Energy Vehicle Volume K Forecast, by Types 2020 & 2033
- Table 5: Global FPC for New Energy Vehicle Revenue million Forecast, by Region 2020 & 2033
- Table 6: Global FPC for New Energy Vehicle Volume K Forecast, by Region 2020 & 2033
- Table 7: Global FPC for New Energy Vehicle Revenue million Forecast, by Application 2020 & 2033
- Table 8: Global FPC for New Energy Vehicle Volume K Forecast, by Application 2020 & 2033
- Table 9: Global FPC for New Energy Vehicle Revenue million Forecast, by Types 2020 & 2033
- Table 10: Global FPC for New Energy Vehicle Volume K Forecast, by Types 2020 & 2033
- Table 11: Global FPC for New Energy Vehicle Revenue million Forecast, by Country 2020 & 2033
- Table 12: Global FPC for New Energy Vehicle Volume K Forecast, by Country 2020 & 2033
- Table 13: United States FPC for New Energy Vehicle Revenue (million) Forecast, by Application 2020 & 2033
- Table 14: United States FPC for New Energy Vehicle Volume (K) Forecast, by Application 2020 & 2033
- Table 15: Canada FPC for New Energy Vehicle Revenue (million) Forecast, by Application 2020 & 2033
- Table 16: Canada FPC for New Energy Vehicle Volume (K) Forecast, by Application 2020 & 2033
- Table 17: Mexico FPC for New Energy Vehicle Revenue (million) Forecast, by Application 2020 & 2033
- Table 18: Mexico FPC for New Energy Vehicle Volume (K) Forecast, by Application 2020 & 2033
- Table 19: Global FPC for New Energy Vehicle Revenue million Forecast, by Application 2020 & 2033
- Table 20: Global FPC for New Energy Vehicle Volume K Forecast, by Application 2020 & 2033
- Table 21: Global FPC for New Energy Vehicle Revenue million Forecast, by Types 2020 & 2033
- Table 22: Global FPC for New Energy Vehicle Volume K Forecast, by Types 2020 & 2033
- Table 23: Global FPC for New Energy Vehicle Revenue million Forecast, by Country 2020 & 2033
- Table 24: Global FPC for New Energy Vehicle Volume K Forecast, by Country 2020 & 2033
- Table 25: Brazil FPC for New Energy Vehicle Revenue (million) Forecast, by Application 2020 & 2033
- Table 26: Brazil FPC for New Energy Vehicle Volume (K) Forecast, by Application 2020 & 2033
- Table 27: Argentina FPC for New Energy Vehicle Revenue (million) Forecast, by Application 2020 & 2033
- Table 28: Argentina FPC for New Energy Vehicle Volume (K) Forecast, by Application 2020 & 2033
- Table 29: Rest of South America FPC for New Energy Vehicle Revenue (million) Forecast, by Application 2020 & 2033
- Table 30: Rest of South America FPC for New Energy Vehicle Volume (K) Forecast, by Application 2020 & 2033
- Table 31: Global FPC for New Energy Vehicle Revenue million Forecast, by Application 2020 & 2033
- Table 32: Global FPC for New Energy Vehicle Volume K Forecast, by Application 2020 & 2033
- Table 33: Global FPC for New Energy Vehicle Revenue million Forecast, by Types 2020 & 2033
- Table 34: Global FPC for New Energy Vehicle Volume K Forecast, by Types 2020 & 2033
- Table 35: Global FPC for New Energy Vehicle Revenue million Forecast, by Country 2020 & 2033
- Table 36: Global FPC for New Energy Vehicle Volume K Forecast, by Country 2020 & 2033
- Table 37: United Kingdom FPC for New Energy Vehicle Revenue (million) Forecast, by Application 2020 & 2033
- Table 38: United Kingdom FPC for New Energy Vehicle Volume (K) Forecast, by Application 2020 & 2033
- Table 39: Germany FPC for New Energy Vehicle Revenue (million) Forecast, by Application 2020 & 2033
- Table 40: Germany FPC for New Energy Vehicle Volume (K) Forecast, by Application 2020 & 2033
- Table 41: France FPC for New Energy Vehicle Revenue (million) Forecast, by Application 2020 & 2033
- Table 42: France FPC for New Energy Vehicle Volume (K) Forecast, by Application 2020 & 2033
- Table 43: Italy FPC for New Energy Vehicle Revenue (million) Forecast, by Application 2020 & 2033
- Table 44: Italy FPC for New Energy Vehicle Volume (K) Forecast, by Application 2020 & 2033
- Table 45: Spain FPC for New Energy Vehicle Revenue (million) Forecast, by Application 2020 & 2033
- Table 46: Spain FPC for New Energy Vehicle Volume (K) Forecast, by Application 2020 & 2033
- Table 47: Russia FPC for New Energy Vehicle Revenue (million) Forecast, by Application 2020 & 2033
- Table 48: Russia FPC for New Energy Vehicle Volume (K) Forecast, by Application 2020 & 2033
- Table 49: Benelux FPC for New Energy Vehicle Revenue (million) Forecast, by Application 2020 & 2033
- Table 50: Benelux FPC for New Energy Vehicle Volume (K) Forecast, by Application 2020 & 2033
- Table 51: Nordics FPC for New Energy Vehicle Revenue (million) Forecast, by Application 2020 & 2033
- Table 52: Nordics FPC for New Energy Vehicle Volume (K) Forecast, by Application 2020 & 2033
- Table 53: Rest of Europe FPC for New Energy Vehicle Revenue (million) Forecast, by Application 2020 & 2033
- Table 54: Rest of Europe FPC for New Energy Vehicle Volume (K) Forecast, by Application 2020 & 2033
- Table 55: Global FPC for New Energy Vehicle Revenue million Forecast, by Application 2020 & 2033
- Table 56: Global FPC for New Energy Vehicle Volume K Forecast, by Application 2020 & 2033
- Table 57: Global FPC for New Energy Vehicle Revenue million Forecast, by Types 2020 & 2033
- Table 58: Global FPC for New Energy Vehicle Volume K Forecast, by Types 2020 & 2033
- Table 59: Global FPC for New Energy Vehicle Revenue million Forecast, by Country 2020 & 2033
- Table 60: Global FPC for New Energy Vehicle Volume K Forecast, by Country 2020 & 2033
- Table 61: Turkey FPC for New Energy Vehicle Revenue (million) Forecast, by Application 2020 & 2033
- Table 62: Turkey FPC for New Energy Vehicle Volume (K) Forecast, by Application 2020 & 2033
- Table 63: Israel FPC for New Energy Vehicle Revenue (million) Forecast, by Application 2020 & 2033
- Table 64: Israel FPC for New Energy Vehicle Volume (K) Forecast, by Application 2020 & 2033
- Table 65: GCC FPC for New Energy Vehicle Revenue (million) Forecast, by Application 2020 & 2033
- Table 66: GCC FPC for New Energy Vehicle Volume (K) Forecast, by Application 2020 & 2033
- Table 67: North Africa FPC for New Energy Vehicle Revenue (million) Forecast, by Application 2020 & 2033
- Table 68: North Africa FPC for New Energy Vehicle Volume (K) Forecast, by Application 2020 & 2033
- Table 69: South Africa FPC for New Energy Vehicle Revenue (million) Forecast, by Application 2020 & 2033
- Table 70: South Africa FPC for New Energy Vehicle Volume (K) Forecast, by Application 2020 & 2033
- Table 71: Rest of Middle East & Africa FPC for New Energy Vehicle Revenue (million) Forecast, by Application 2020 & 2033
- Table 72: Rest of Middle East & Africa FPC for New Energy Vehicle Volume (K) Forecast, by Application 2020 & 2033
- Table 73: Global FPC for New Energy Vehicle Revenue million Forecast, by Application 2020 & 2033
- Table 74: Global FPC for New Energy Vehicle Volume K Forecast, by Application 2020 & 2033
- Table 75: Global FPC for New Energy Vehicle Revenue million Forecast, by Types 2020 & 2033
- Table 76: Global FPC for New Energy Vehicle Volume K Forecast, by Types 2020 & 2033
- Table 77: Global FPC for New Energy Vehicle Revenue million Forecast, by Country 2020 & 2033
- Table 78: Global FPC for New Energy Vehicle Volume K Forecast, by Country 2020 & 2033
- Table 79: China FPC for New Energy Vehicle Revenue (million) Forecast, by Application 2020 & 2033
- Table 80: China FPC for New Energy Vehicle Volume (K) Forecast, by Application 2020 & 2033
- Table 81: India FPC for New Energy Vehicle Revenue (million) Forecast, by Application 2020 & 2033
- Table 82: India FPC for New Energy Vehicle Volume (K) Forecast, by Application 2020 & 2033
- Table 83: Japan FPC for New Energy Vehicle Revenue (million) Forecast, by Application 2020 & 2033
- Table 84: Japan FPC for New Energy Vehicle Volume (K) Forecast, by Application 2020 & 2033
- Table 85: South Korea FPC for New Energy Vehicle Revenue (million) Forecast, by Application 2020 & 2033
- Table 86: South Korea FPC for New Energy Vehicle Volume (K) Forecast, by Application 2020 & 2033
- Table 87: ASEAN FPC for New Energy Vehicle Revenue (million) Forecast, by Application 2020 & 2033
- Table 88: ASEAN FPC for New Energy Vehicle Volume (K) Forecast, by Application 2020 & 2033
- Table 89: Oceania FPC for New Energy Vehicle Revenue (million) Forecast, by Application 2020 & 2033
- Table 90: Oceania FPC for New Energy Vehicle Volume (K) Forecast, by Application 2020 & 2033
- Table 91: Rest of Asia Pacific FPC for New Energy Vehicle Revenue (million) Forecast, by Application 2020 & 2033
- Table 92: Rest of Asia Pacific FPC for New Energy Vehicle Volume (K) Forecast, by Application 2020 & 2033
Frequently Asked Questions
1. What is the projected Compound Annual Growth Rate (CAGR) of the FPC for New Energy Vehicle?
The projected CAGR is approximately 5.7%.
2. Which companies are prominent players in the FPC for New Energy Vehicle?
Key companies in the market include ZDT, Fujikura, Nippon Mektron, SEI, Flexium, MFLEX, CAREER, SIFLEX, Interflex, Bhflex, KINWONG, Hongxin, ICHIA, Daeduck GDS, AKM.
3. What are the main segments of the FPC for New Energy Vehicle?
The market segments include Application, Types.
4. Can you provide details about the market size?
The market size is estimated to be USD 1924 million as of 2022.
5. What are some drivers contributing to market growth?
N/A
6. What are the notable trends driving market growth?
N/A
7. Are there any restraints impacting market growth?
N/A
8. Can you provide examples of recent developments in the market?
N/A
9. What pricing options are available for accessing the report?
Pricing options include single-user, multi-user, and enterprise licenses priced at USD 3350.00, USD 5025.00, and USD 6700.00 respectively.
10. Is the market size provided in terms of value or volume?
The market size is provided in terms of value, measured in million and volume, measured in K.
11. Are there any specific market keywords associated with the report?
Yes, the market keyword associated with the report is "FPC for New Energy Vehicle," which aids in identifying and referencing the specific market segment covered.
12. How do I determine which pricing option suits my needs best?
The pricing options vary based on user requirements and access needs. Individual users may opt for single-user licenses, while businesses requiring broader access may choose multi-user or enterprise licenses for cost-effective access to the report.
13. Are there any additional resources or data provided in the FPC for New Energy Vehicle report?
While the report offers comprehensive insights, it's advisable to review the specific contents or supplementary materials provided to ascertain if additional resources or data are available.
14. How can I stay updated on further developments or reports in the FPC for New Energy Vehicle?
To stay informed about further developments, trends, and reports in the FPC for New Energy Vehicle, consider subscribing to industry newsletters, following relevant companies and organizations, or regularly checking reputable industry news sources and publications.
Methodology
Step 1 - Identification of Relevant Samples Size from Population Database


Step 2 - Approaches for Defining Global Market Size (Value, Volume* & Price*)

Note*: In applicable scenarios
Step 3 - Data Sources
Primary Research
- Web Analytics
- Survey Reports
- Research Institute
- Latest Research Reports
- Opinion Leaders
Secondary Research
- Annual Reports
- White Paper
- Latest Press Release
- Industry Association
- Paid Database
- Investor Presentations

Step 4 - Data Triangulation
Involves using different sources of information in order to increase the validity of a study
These sources are likely to be stakeholders in a program - participants, other researchers, program staff, other community members, and so on.
Then we put all data in single framework & apply various statistical tools to find out the dynamic on the market.
During the analysis stage, feedback from the stakeholder groups would be compared to determine areas of agreement as well as areas of divergence