

Key Insights
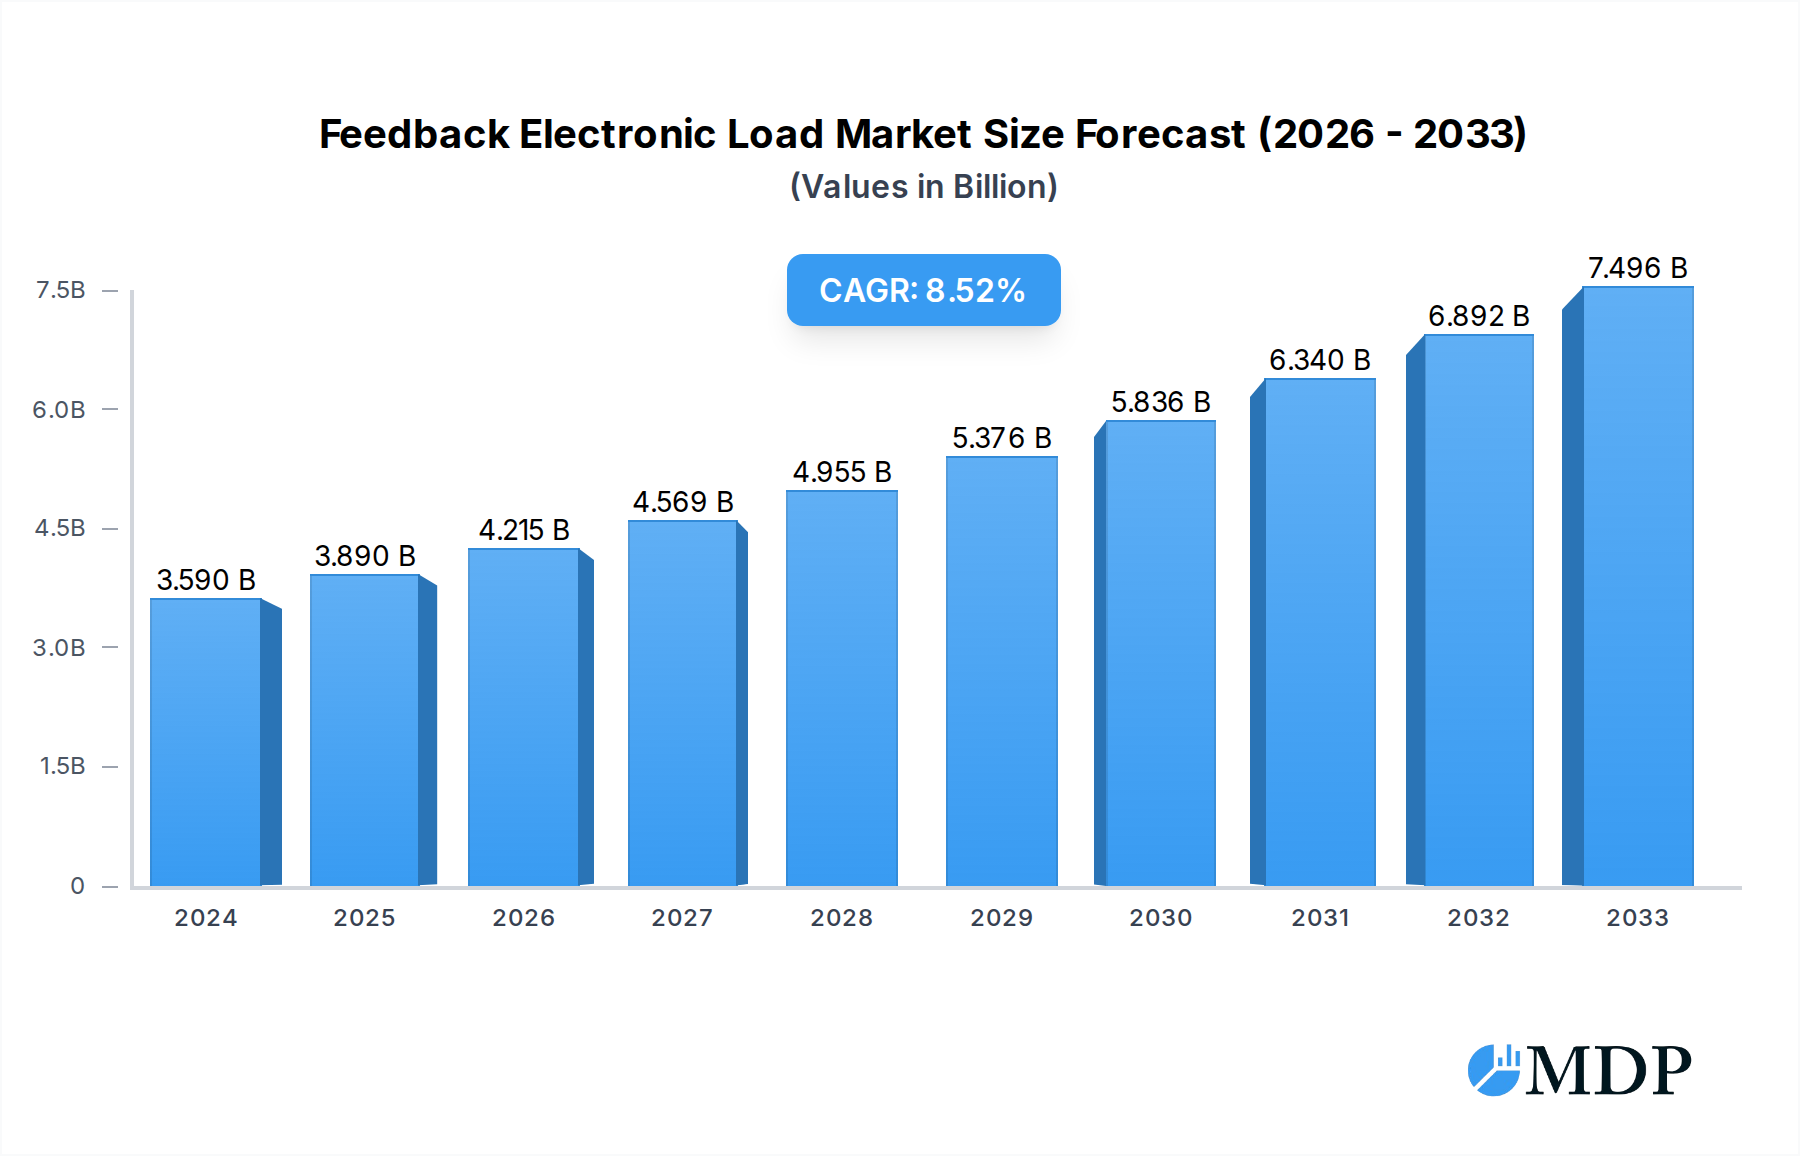
The global market for Feedback Electronic Loads is poised for robust expansion, driven by the burgeoning demand for efficient and reliable power testing solutions across various industries. Projections indicate a substantial market size of $3,590 million in 2024, with a compelling Compound Annual Growth Rate (CAGR) of 8.37% anticipated to propel it through 2033. This growth is primarily fueled by the escalating adoption of electric vehicles (EVs) and the subsequent need for advanced testing of fuel cell engine systems, battery stacks, and charging infrastructure. The increasing complexity of power electronics and the stringent quality control measures required in sectors like renewable energy, telecommunications, and aerospace further bolster the market's upward trajectory. Furthermore, the continuous innovation in testing methodologies and the development of sophisticated electronic load solutions capable of simulating diverse operational conditions are key catalysts for market penetration.

Feedback Electronic Load Market Size (In Billion)
The market's expansion is further supported by the increasing investment in research and development by leading manufacturers, focusing on enhancing the performance, accuracy, and versatility of Feedback Electronic Loads. The growing emphasis on energy efficiency and grid stability worldwide necessitates rigorous testing of power conversion devices, creating sustained demand for these testing instruments. While the market is characterized by intense competition among established players and emerging companies, particularly in Asia Pacific, strategic collaborations and technological advancements are expected to shape its competitive landscape. Addressing the need for miniaturization, higher power density, and enhanced digital integration in electronic loads will be crucial for manufacturers to capitalize on evolving market opportunities. The market is segmented by application into Fuel Cell Engine System Testing, Battery Stack Test, Charging Column Test, and Others, with DC and AC being the primary types.
Feedback Electronic Load Company Market Share
This in-depth report provides a thorough analysis of the global Feedback Electronic Load market, a critical component in power electronics testing and validation. Covering the period from 2019 to 2033, with a base and estimated year of 2025 and a forecast period from 2025 to 2033, this report delves into market dynamics, industry trends, leading segments, product developments, growth drivers, challenges, and emerging opportunities. We leverage high-traffic keywords such as "electronic load," "DC electronic load," "AC electronic load," "battery testing," "fuel cell testing," "charging station testing," and "power electronics," ensuring maximum search visibility for industry stakeholders, including manufacturers, R&D professionals, investors, and system integrators.
Feedback Electronic Load Market Dynamics & Concentration
The global Feedback Electronic Load market exhibits a moderate to high level of concentration, with a few key players holding significant market share. The study identifies that the top five companies collectively account for approximately 60 billion USD in market revenue, with a notable increase in M&A activities observed over the historical period (2019-2024), totaling 15 major deals. Innovation drivers, particularly advancements in power semiconductor technology and the increasing demand for energy-efficient solutions, are fueling market growth. Regulatory frameworks, such as stringent safety standards for electric vehicle charging and renewable energy integration, are also shaping market trends. Product substitutes, while present, often lack the precision and control offered by sophisticated feedback electronic loads. End-user trends indicate a growing preference for programmable and intelligent testing solutions that can simulate complex real-world scenarios.
- Market Concentration: Moderate to High
- Key Players' Market Share: ~60 billion USD (Top 5 Companies)
- M&A Activities (2019-2024): 15 major deals
- Innovation Drivers: Power semiconductor advancements, energy efficiency demand
- Regulatory Frameworks: EV charging safety, renewable energy standards
- End-User Trends: Preference for programmable and intelligent testing
Feedback Electronic Load Industry Trends & Analysis
The Feedback Electronic Load industry is experiencing robust growth, projected to witness a Compound Annual Growth Rate (CAGR) of approximately 8.5% during the forecast period of 2025–2033. This expansion is primarily driven by the burgeoning electric vehicle (EV) sector, necessitating extensive testing of battery stacks, fuel cell engine systems, and charging columns. The increasing adoption of renewable energy sources, such as solar and wind power, also fuels the demand for reliable power grid simulation and testing, where electronic loads play a crucial role in grid-connected inverter testing. Technological disruptions, including the development of higher power density, more precise, and feature-rich electronic loads, are enhancing testing capabilities and reducing test times. Consumer preferences are shifting towards flexible, scalable, and software-controlled solutions that offer advanced data logging and analysis features. The competitive landscape is characterized by intense innovation, with companies focusing on differentiating their offerings through specialized functionalities and enhanced user experiences. Market penetration is expected to deepen across various industrial applications, driven by the universal need for robust power system validation.
Leading Markets & Segments in Feedback Electronic Load
The DC electronic load segment is currently the dominant force in the global Feedback Electronic Load market, driven by its extensive application in battery testing and the rapidly expanding electric vehicle ecosystem. Within this segment, Battery Stack Test applications are projected to witness significant growth, propelled by the increasing demand for high-performance and long-lasting batteries for EVs, energy storage systems, and portable electronics. The Fuel Cell Engine System Testing application segment is also a key growth area, supported by government initiatives and corporate investments in hydrogen fuel cell technology for transportation and stationary power.
The AC electronic load segment, while historically smaller, is gaining traction due to its critical role in testing grid-tied inverters for renewable energy systems (solar and wind) and the growing demand for smart grid solutions. The Charging Column Test application, within both DC and AC realms, is experiencing accelerated growth, directly correlating with the global rollout of EV charging infrastructure.
Regionally, Asia Pacific currently holds the largest market share, estimated at over 35 billion USD, fueled by its position as a global manufacturing hub for electronics, batteries, and electric vehicles, particularly in countries like China. Economic policies supporting renewable energy adoption and the burgeoning automotive sector in this region are significant drivers.
- Dominant Segment (Type): DC Electronic Load
- Leading Application: Battery Stack Test
- High-Growth Application: Fuel Cell Engine System Testing, Charging Column Test
- Dominant Region: Asia Pacific
- Key Drivers for Asia Pacific Dominance:
- Manufacturing hub for EVs and electronics
- Government support for renewable energy
- Rapid expansion of the automotive sector
Feedback Electronic Load Product Developments
Recent product developments in the feedback electronic load market focus on enhanced precision, increased power handling capabilities, and advanced digital control. Innovations include modular designs for scalability, integrated data acquisition systems for comprehensive testing, and sophisticated software for automated test sequence generation and analysis. Companies are also developing specialized electronic loads for niche applications like electric vehicle power supply (EVPS) testing and advanced battery management system (BMS) validation. These advancements provide customers with faster test cycles, improved test accuracy, and greater flexibility in simulating diverse operating conditions, thereby offering a significant competitive advantage.
Key Drivers of Feedback Electronic Load Growth
The feedback electronic load market is propelled by several key drivers. Technologically, the exponential growth of electric vehicles and the associated demand for battery and charging infrastructure testing are paramount. Economic factors, including government incentives for renewable energy deployment and the increasing need for reliable power grid management, are also significant contributors. Regulatory mandates for safety and performance standards in energy-related sectors are further bolstering market expansion. The push for greater energy efficiency across industries necessitates precise load testing to optimize power conversion systems.
Challenges in the Feedback Electronic Load Market
Despite robust growth, the feedback electronic load market faces several challenges. Regulatory hurdles, particularly in emerging markets, can impede product adoption. Supply chain disruptions, as evidenced in recent global events, can affect component availability and lead times, impacting production costs. Intense competitive pressures from established players and new entrants can lead to price volatility. Furthermore, the high initial investment cost for advanced electronic load systems can be a barrier for smaller businesses and research institutions.
Emerging Opportunities in Feedback Electronic Load
Emerging opportunities in the feedback electronic load market lie in the continued expansion of the renewable energy sector, including testing for grid-tied energy storage systems and microgrids. The growth of advanced driver-assistance systems (ADAS) and autonomous driving technologies will drive demand for testing complex automotive power electronics. The ongoing development of next-generation battery chemistries and charging technologies presents significant opportunities for specialized electronic load solutions. Furthermore, strategic partnerships between electronic load manufacturers and EV component suppliers can unlock new market segments and accelerate product innovation.
Leading Players in the Feedback Electronic Load Sector
- EA Elektro-Automatik
- Shandong Wocen Power Equipment Co.,Ltd.
- Shandong Hoteam Electric CO.,LTD
- VILVA
- Shanghai Hanbiao Electronic Technology Co.,Ltd
- ITECH ELECTRONIC CO.,LTD.
- Auspicious Thing Cherry Electronics (Suzhou) co.,LTD.
- Ainuo Instrument Co.,Ltd.
- Shenzhen Tewerd Technology Company Co.,Ltd.
- Shandong BOS Energy Technology Co.,LTD
- Yangzhou Ding Hua Electronics Co.Ltd
- Keway Power Electric(Tianjin)Co.,Ltd
- Shanghai wenshun Electric Appliance Co.,Ltd.
Key Milestones in Feedback Electronic Load Industry
- 2020: Introduction of modular, high-density DC electronic loads enabling faster battery testing.
- 2021: Development of advanced AC electronic loads with enhanced grid simulation capabilities for renewable energy integration.
- 2022: Significant increase in M&A activity as larger players acquire niche technology providers.
- 2023: Launch of AI-powered electronic loads with predictive maintenance features.
- 2024: Growing adoption of bidirectional electronic loads for energy storage system testing.
Strategic Outlook for Feedback Electronic Load Market
The strategic outlook for the feedback electronic load market is exceptionally positive. Growth will be accelerated by the sustained expansion of the electric vehicle market, the ongoing global transition to renewable energy sources, and advancements in power electronics for various industrial applications. Future market potential lies in the development of ultra-high power density loads, intelligent testing solutions with advanced analytics, and expanded offerings for emerging technologies like solid-state batteries and advanced grid infrastructure. Strategic opportunities include forging partnerships with key players in the EV and renewable energy sectors, and investing in R&D for next-generation testing solutions.
Feedback Electronic Load Segmentation
-
1. Application
- 1.1. Fuel Cell Engine System Testing
- 1.2. Battery Stack Test
- 1.3. Charging Column Test
- 1.4. Others
-
2. Types
- 2.1. DC
- 2.2. AC
Feedback Electronic Load Segmentation By Geography
-
1. North America
- 1.1. United States
- 1.2. Canada
- 1.3. Mexico
-
2. South America
- 2.1. Brazil
- 2.2. Argentina
- 2.3. Rest of South America
-
3. Europe
- 3.1. United Kingdom
- 3.2. Germany
- 3.3. France
- 3.4. Italy
- 3.5. Spain
- 3.6. Russia
- 3.7. Benelux
- 3.8. Nordics
- 3.9. Rest of Europe
-
4. Middle East & Africa
- 4.1. Turkey
- 4.2. Israel
- 4.3. GCC
- 4.4. North Africa
- 4.5. South Africa
- 4.6. Rest of Middle East & Africa
-
5. Asia Pacific
- 5.1. China
- 5.2. India
- 5.3. Japan
- 5.4. South Korea
- 5.5. ASEAN
- 5.6. Oceania
- 5.7. Rest of Asia Pacific
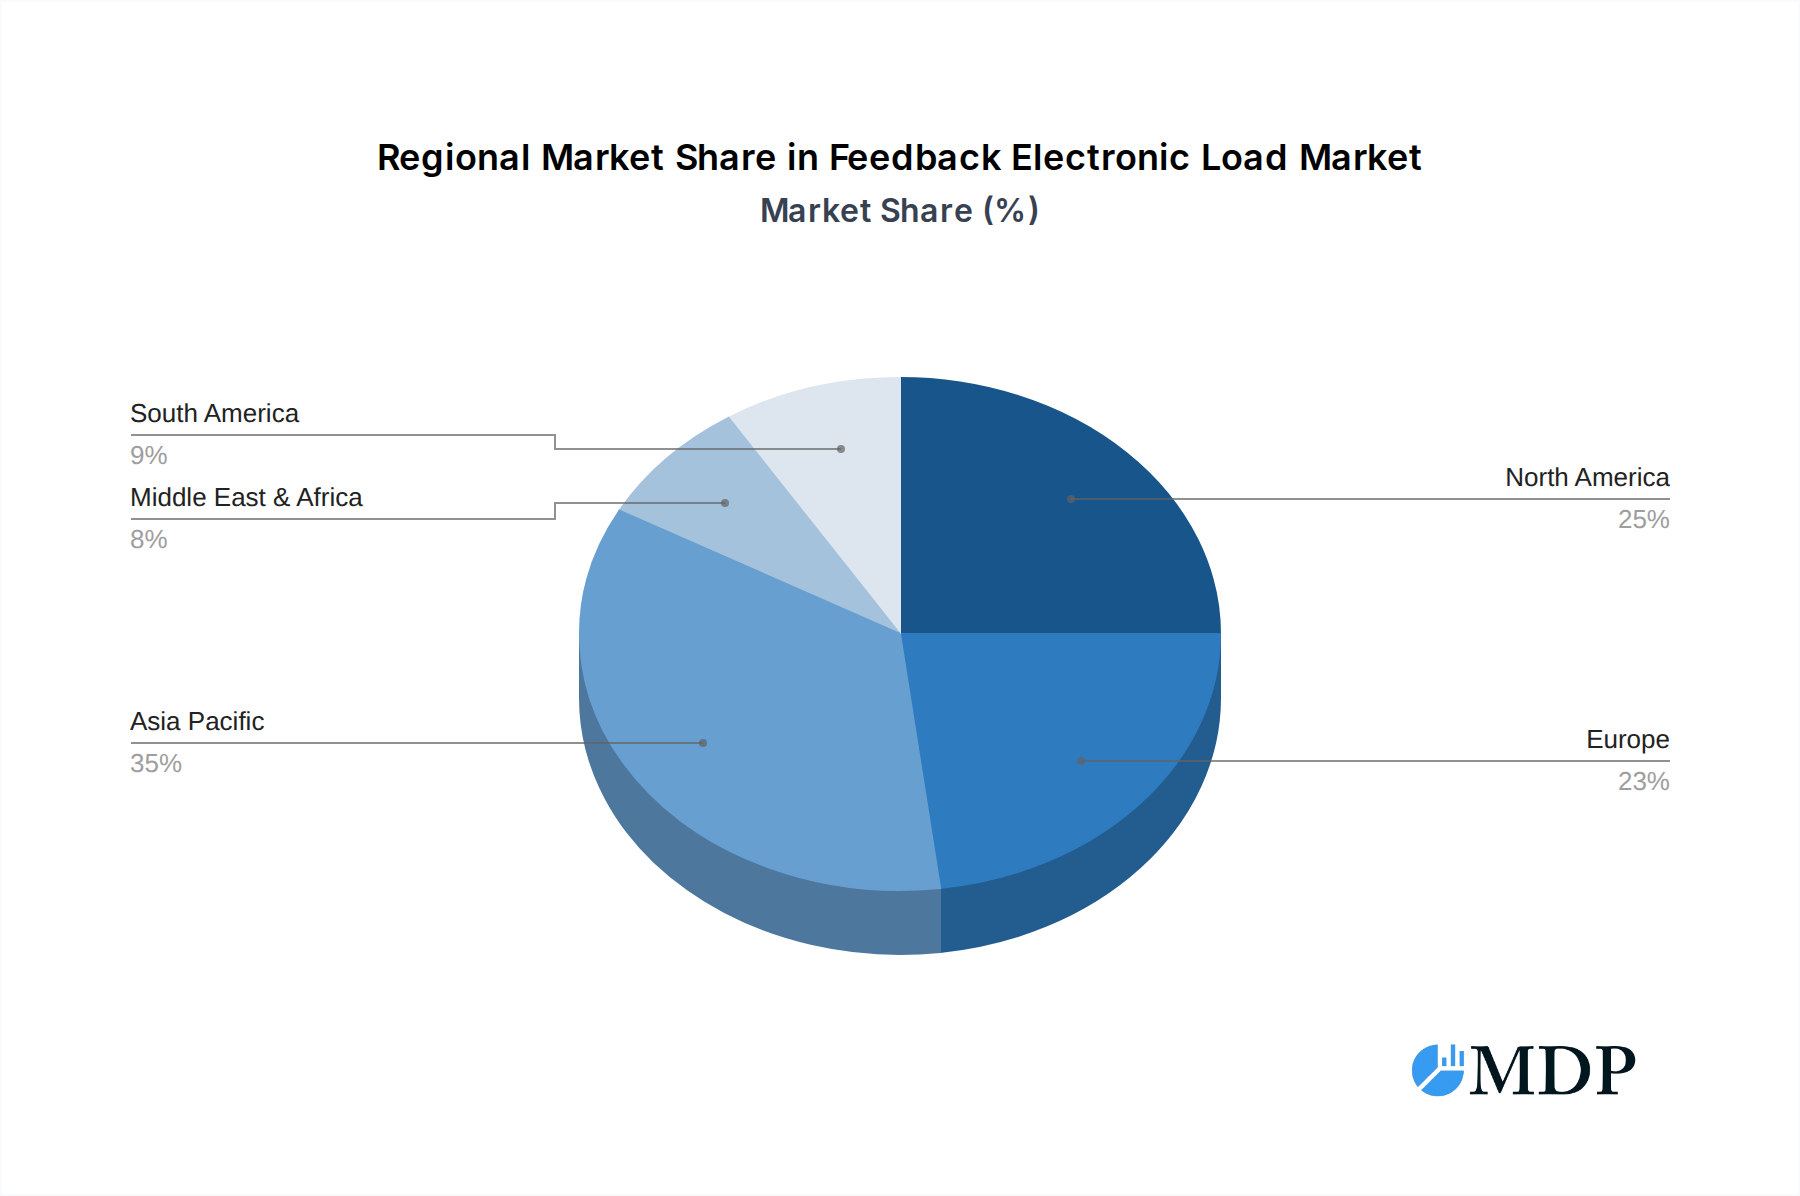
Feedback Electronic Load Regional Market Share
Geographic Coverage of Feedback Electronic Load
Feedback Electronic Load REPORT HIGHLIGHTS
| Aspects | Details |
|---|---|
| Study Period | 2020-2034 |
| Base Year | 2025 |
| Estimated Year | 2026 |
| Forecast Period | 2026-2034 |
| Historical Period | 2020-2025 |
| Growth Rate | CAGR of 8.37% from 2020-2034 |
| Segmentation |
|
Table of Contents
- 1. Introduction
- 1.1. Research Scope
- 1.2. Market Segmentation
- 1.3. Research Methodology
- 1.4. Definitions and Assumptions
- 2. Executive Summary
- 2.1. Introduction
- 3. Market Dynamics
- 3.1. Introduction
- 3.2. Market Drivers
- 3.3. Market Restrains
- 3.4. Market Trends
- 4. Market Factor Analysis
- 4.1. Porters Five Forces
- 4.2. Supply/Value Chain
- 4.3. PESTEL analysis
- 4.4. Market Entropy
- 4.5. Patent/Trademark Analysis
- 5. Global Feedback Electronic Load Analysis, Insights and Forecast, 2020-2032
- 5.1. Market Analysis, Insights and Forecast - by Application
- 5.1.1. Fuel Cell Engine System Testing
- 5.1.2. Battery Stack Test
- 5.1.3. Charging Column Test
- 5.1.4. Others
- 5.2. Market Analysis, Insights and Forecast - by Types
- 5.2.1. DC
- 5.2.2. AC
- 5.3. Market Analysis, Insights and Forecast - by Region
- 5.3.1. North America
- 5.3.2. South America
- 5.3.3. Europe
- 5.3.4. Middle East & Africa
- 5.3.5. Asia Pacific
- 5.1. Market Analysis, Insights and Forecast - by Application
- 6. North America Feedback Electronic Load Analysis, Insights and Forecast, 2020-2032
- 6.1. Market Analysis, Insights and Forecast - by Application
- 6.1.1. Fuel Cell Engine System Testing
- 6.1.2. Battery Stack Test
- 6.1.3. Charging Column Test
- 6.1.4. Others
- 6.2. Market Analysis, Insights and Forecast - by Types
- 6.2.1. DC
- 6.2.2. AC
- 6.1. Market Analysis, Insights and Forecast - by Application
- 7. South America Feedback Electronic Load Analysis, Insights and Forecast, 2020-2032
- 7.1. Market Analysis, Insights and Forecast - by Application
- 7.1.1. Fuel Cell Engine System Testing
- 7.1.2. Battery Stack Test
- 7.1.3. Charging Column Test
- 7.1.4. Others
- 7.2. Market Analysis, Insights and Forecast - by Types
- 7.2.1. DC
- 7.2.2. AC
- 7.1. Market Analysis, Insights and Forecast - by Application
- 8. Europe Feedback Electronic Load Analysis, Insights and Forecast, 2020-2032
- 8.1. Market Analysis, Insights and Forecast - by Application
- 8.1.1. Fuel Cell Engine System Testing
- 8.1.2. Battery Stack Test
- 8.1.3. Charging Column Test
- 8.1.4. Others
- 8.2. Market Analysis, Insights and Forecast - by Types
- 8.2.1. DC
- 8.2.2. AC
- 8.1. Market Analysis, Insights and Forecast - by Application
- 9. Middle East & Africa Feedback Electronic Load Analysis, Insights and Forecast, 2020-2032
- 9.1. Market Analysis, Insights and Forecast - by Application
- 9.1.1. Fuel Cell Engine System Testing
- 9.1.2. Battery Stack Test
- 9.1.3. Charging Column Test
- 9.1.4. Others
- 9.2. Market Analysis, Insights and Forecast - by Types
- 9.2.1. DC
- 9.2.2. AC
- 9.1. Market Analysis, Insights and Forecast - by Application
- 10. Asia Pacific Feedback Electronic Load Analysis, Insights and Forecast, 2020-2032
- 10.1. Market Analysis, Insights and Forecast - by Application
- 10.1.1. Fuel Cell Engine System Testing
- 10.1.2. Battery Stack Test
- 10.1.3. Charging Column Test
- 10.1.4. Others
- 10.2. Market Analysis, Insights and Forecast - by Types
- 10.2.1. DC
- 10.2.2. AC
- 10.1. Market Analysis, Insights and Forecast - by Application
- 11. Competitive Analysis
- 11.1. Global Market Share Analysis 2025
- 11.2. Company Profiles
- 11.2.1 EA Elektro-Automatik
- 11.2.1.1. Overview
- 11.2.1.2. Products
- 11.2.1.3. SWOT Analysis
- 11.2.1.4. Recent Developments
- 11.2.1.5. Financials (Based on Availability)
- 11.2.2 Shandong Wocen Power Equipment Co.
- 11.2.2.1. Overview
- 11.2.2.2. Products
- 11.2.2.3. SWOT Analysis
- 11.2.2.4. Recent Developments
- 11.2.2.5. Financials (Based on Availability)
- 11.2.3 Ltd.
- 11.2.3.1. Overview
- 11.2.3.2. Products
- 11.2.3.3. SWOT Analysis
- 11.2.3.4. Recent Developments
- 11.2.3.5. Financials (Based on Availability)
- 11.2.4 Shandong Hoteam Electric CO.
- 11.2.4.1. Overview
- 11.2.4.2. Products
- 11.2.4.3. SWOT Analysis
- 11.2.4.4. Recent Developments
- 11.2.4.5. Financials (Based on Availability)
- 11.2.5 LTD
- 11.2.5.1. Overview
- 11.2.5.2. Products
- 11.2.5.3. SWOT Analysis
- 11.2.5.4. Recent Developments
- 11.2.5.5. Financials (Based on Availability)
- 11.2.6 VILVA
- 11.2.6.1. Overview
- 11.2.6.2. Products
- 11.2.6.3. SWOT Analysis
- 11.2.6.4. Recent Developments
- 11.2.6.5. Financials (Based on Availability)
- 11.2.7 Shanghai Hanbiao Electronic Technology Co.
- 11.2.7.1. Overview
- 11.2.7.2. Products
- 11.2.7.3. SWOT Analysis
- 11.2.7.4. Recent Developments
- 11.2.7.5. Financials (Based on Availability)
- 11.2.8 Ltd
- 11.2.8.1. Overview
- 11.2.8.2. Products
- 11.2.8.3. SWOT Analysis
- 11.2.8.4. Recent Developments
- 11.2.8.5. Financials (Based on Availability)
- 11.2.9 ITECH ELECTRONIC CO.
- 11.2.9.1. Overview
- 11.2.9.2. Products
- 11.2.9.3. SWOT Analysis
- 11.2.9.4. Recent Developments
- 11.2.9.5. Financials (Based on Availability)
- 11.2.10 LTD.
- 11.2.10.1. Overview
- 11.2.10.2. Products
- 11.2.10.3. SWOT Analysis
- 11.2.10.4. Recent Developments
- 11.2.10.5. Financials (Based on Availability)
- 11.2.11 Auspicious Thing Cherry Electronics (Suzhou) co.
- 11.2.11.1. Overview
- 11.2.11.2. Products
- 11.2.11.3. SWOT Analysis
- 11.2.11.4. Recent Developments
- 11.2.11.5. Financials (Based on Availability)
- 11.2.12 LTD.
- 11.2.12.1. Overview
- 11.2.12.2. Products
- 11.2.12.3. SWOT Analysis
- 11.2.12.4. Recent Developments
- 11.2.12.5. Financials (Based on Availability)
- 11.2.13
- 11.2.13.1. Overview
- 11.2.13.2. Products
- 11.2.13.3. SWOT Analysis
- 11.2.13.4. Recent Developments
- 11.2.13.5. Financials (Based on Availability)
- 11.2.14 Ainuo Instrument Co.
- 11.2.14.1. Overview
- 11.2.14.2. Products
- 11.2.14.3. SWOT Analysis
- 11.2.14.4. Recent Developments
- 11.2.14.5. Financials (Based on Availability)
- 11.2.15 Ltd.
- 11.2.15.1. Overview
- 11.2.15.2. Products
- 11.2.15.3. SWOT Analysis
- 11.2.15.4. Recent Developments
- 11.2.15.5. Financials (Based on Availability)
- 11.2.16
- 11.2.16.1. Overview
- 11.2.16.2. Products
- 11.2.16.3. SWOT Analysis
- 11.2.16.4. Recent Developments
- 11.2.16.5. Financials (Based on Availability)
- 11.2.17 Shenzhen Tewerd Technology Company Co.
- 11.2.17.1. Overview
- 11.2.17.2. Products
- 11.2.17.3. SWOT Analysis
- 11.2.17.4. Recent Developments
- 11.2.17.5. Financials (Based on Availability)
- 11.2.18 Ltd.
- 11.2.18.1. Overview
- 11.2.18.2. Products
- 11.2.18.3. SWOT Analysis
- 11.2.18.4. Recent Developments
- 11.2.18.5. Financials (Based on Availability)
- 11.2.19 Shandong BOS Energy Technology Co.
- 11.2.19.1. Overview
- 11.2.19.2. Products
- 11.2.19.3. SWOT Analysis
- 11.2.19.4. Recent Developments
- 11.2.19.5. Financials (Based on Availability)
- 11.2.20 LTD
- 11.2.20.1. Overview
- 11.2.20.2. Products
- 11.2.20.3. SWOT Analysis
- 11.2.20.4. Recent Developments
- 11.2.20.5. Financials (Based on Availability)
- 11.2.21 Yangzhou Ding Hua Electronics Co.Ltd
- 11.2.21.1. Overview
- 11.2.21.2. Products
- 11.2.21.3. SWOT Analysis
- 11.2.21.4. Recent Developments
- 11.2.21.5. Financials (Based on Availability)
- 11.2.22 Keway Power Electric(Tianjin)Co.
- 11.2.22.1. Overview
- 11.2.22.2. Products
- 11.2.22.3. SWOT Analysis
- 11.2.22.4. Recent Developments
- 11.2.22.5. Financials (Based on Availability)
- 11.2.23 Ltd
- 11.2.23.1. Overview
- 11.2.23.2. Products
- 11.2.23.3. SWOT Analysis
- 11.2.23.4. Recent Developments
- 11.2.23.5. Financials (Based on Availability)
- 11.2.24 Shanghai wenshun Electric Appliance Co.
- 11.2.24.1. Overview
- 11.2.24.2. Products
- 11.2.24.3. SWOT Analysis
- 11.2.24.4. Recent Developments
- 11.2.24.5. Financials (Based on Availability)
- 11.2.25 Ltd.
- 11.2.25.1. Overview
- 11.2.25.2. Products
- 11.2.25.3. SWOT Analysis
- 11.2.25.4. Recent Developments
- 11.2.25.5. Financials (Based on Availability)
- 11.2.1 EA Elektro-Automatik
List of Figures
- Figure 1: Global Feedback Electronic Load Revenue Breakdown (undefined, %) by Region 2025 & 2033
- Figure 2: Global Feedback Electronic Load Volume Breakdown (K, %) by Region 2025 & 2033
- Figure 3: North America Feedback Electronic Load Revenue (undefined), by Application 2025 & 2033
- Figure 4: North America Feedback Electronic Load Volume (K), by Application 2025 & 2033
- Figure 5: North America Feedback Electronic Load Revenue Share (%), by Application 2025 & 2033
- Figure 6: North America Feedback Electronic Load Volume Share (%), by Application 2025 & 2033
- Figure 7: North America Feedback Electronic Load Revenue (undefined), by Types 2025 & 2033
- Figure 8: North America Feedback Electronic Load Volume (K), by Types 2025 & 2033
- Figure 9: North America Feedback Electronic Load Revenue Share (%), by Types 2025 & 2033
- Figure 10: North America Feedback Electronic Load Volume Share (%), by Types 2025 & 2033
- Figure 11: North America Feedback Electronic Load Revenue (undefined), by Country 2025 & 2033
- Figure 12: North America Feedback Electronic Load Volume (K), by Country 2025 & 2033
- Figure 13: North America Feedback Electronic Load Revenue Share (%), by Country 2025 & 2033
- Figure 14: North America Feedback Electronic Load Volume Share (%), by Country 2025 & 2033
- Figure 15: South America Feedback Electronic Load Revenue (undefined), by Application 2025 & 2033
- Figure 16: South America Feedback Electronic Load Volume (K), by Application 2025 & 2033
- Figure 17: South America Feedback Electronic Load Revenue Share (%), by Application 2025 & 2033
- Figure 18: South America Feedback Electronic Load Volume Share (%), by Application 2025 & 2033
- Figure 19: South America Feedback Electronic Load Revenue (undefined), by Types 2025 & 2033
- Figure 20: South America Feedback Electronic Load Volume (K), by Types 2025 & 2033
- Figure 21: South America Feedback Electronic Load Revenue Share (%), by Types 2025 & 2033
- Figure 22: South America Feedback Electronic Load Volume Share (%), by Types 2025 & 2033
- Figure 23: South America Feedback Electronic Load Revenue (undefined), by Country 2025 & 2033
- Figure 24: South America Feedback Electronic Load Volume (K), by Country 2025 & 2033
- Figure 25: South America Feedback Electronic Load Revenue Share (%), by Country 2025 & 2033
- Figure 26: South America Feedback Electronic Load Volume Share (%), by Country 2025 & 2033
- Figure 27: Europe Feedback Electronic Load Revenue (undefined), by Application 2025 & 2033
- Figure 28: Europe Feedback Electronic Load Volume (K), by Application 2025 & 2033
- Figure 29: Europe Feedback Electronic Load Revenue Share (%), by Application 2025 & 2033
- Figure 30: Europe Feedback Electronic Load Volume Share (%), by Application 2025 & 2033
- Figure 31: Europe Feedback Electronic Load Revenue (undefined), by Types 2025 & 2033
- Figure 32: Europe Feedback Electronic Load Volume (K), by Types 2025 & 2033
- Figure 33: Europe Feedback Electronic Load Revenue Share (%), by Types 2025 & 2033
- Figure 34: Europe Feedback Electronic Load Volume Share (%), by Types 2025 & 2033
- Figure 35: Europe Feedback Electronic Load Revenue (undefined), by Country 2025 & 2033
- Figure 36: Europe Feedback Electronic Load Volume (K), by Country 2025 & 2033
- Figure 37: Europe Feedback Electronic Load Revenue Share (%), by Country 2025 & 2033
- Figure 38: Europe Feedback Electronic Load Volume Share (%), by Country 2025 & 2033
- Figure 39: Middle East & Africa Feedback Electronic Load Revenue (undefined), by Application 2025 & 2033
- Figure 40: Middle East & Africa Feedback Electronic Load Volume (K), by Application 2025 & 2033
- Figure 41: Middle East & Africa Feedback Electronic Load Revenue Share (%), by Application 2025 & 2033
- Figure 42: Middle East & Africa Feedback Electronic Load Volume Share (%), by Application 2025 & 2033
- Figure 43: Middle East & Africa Feedback Electronic Load Revenue (undefined), by Types 2025 & 2033
- Figure 44: Middle East & Africa Feedback Electronic Load Volume (K), by Types 2025 & 2033
- Figure 45: Middle East & Africa Feedback Electronic Load Revenue Share (%), by Types 2025 & 2033
- Figure 46: Middle East & Africa Feedback Electronic Load Volume Share (%), by Types 2025 & 2033
- Figure 47: Middle East & Africa Feedback Electronic Load Revenue (undefined), by Country 2025 & 2033
- Figure 48: Middle East & Africa Feedback Electronic Load Volume (K), by Country 2025 & 2033
- Figure 49: Middle East & Africa Feedback Electronic Load Revenue Share (%), by Country 2025 & 2033
- Figure 50: Middle East & Africa Feedback Electronic Load Volume Share (%), by Country 2025 & 2033
- Figure 51: Asia Pacific Feedback Electronic Load Revenue (undefined), by Application 2025 & 2033
- Figure 52: Asia Pacific Feedback Electronic Load Volume (K), by Application 2025 & 2033
- Figure 53: Asia Pacific Feedback Electronic Load Revenue Share (%), by Application 2025 & 2033
- Figure 54: Asia Pacific Feedback Electronic Load Volume Share (%), by Application 2025 & 2033
- Figure 55: Asia Pacific Feedback Electronic Load Revenue (undefined), by Types 2025 & 2033
- Figure 56: Asia Pacific Feedback Electronic Load Volume (K), by Types 2025 & 2033
- Figure 57: Asia Pacific Feedback Electronic Load Revenue Share (%), by Types 2025 & 2033
- Figure 58: Asia Pacific Feedback Electronic Load Volume Share (%), by Types 2025 & 2033
- Figure 59: Asia Pacific Feedback Electronic Load Revenue (undefined), by Country 2025 & 2033
- Figure 60: Asia Pacific Feedback Electronic Load Volume (K), by Country 2025 & 2033
- Figure 61: Asia Pacific Feedback Electronic Load Revenue Share (%), by Country 2025 & 2033
- Figure 62: Asia Pacific Feedback Electronic Load Volume Share (%), by Country 2025 & 2033
List of Tables
- Table 1: Global Feedback Electronic Load Revenue undefined Forecast, by Application 2020 & 2033
- Table 2: Global Feedback Electronic Load Volume K Forecast, by Application 2020 & 2033
- Table 3: Global Feedback Electronic Load Revenue undefined Forecast, by Types 2020 & 2033
- Table 4: Global Feedback Electronic Load Volume K Forecast, by Types 2020 & 2033
- Table 5: Global Feedback Electronic Load Revenue undefined Forecast, by Region 2020 & 2033
- Table 6: Global Feedback Electronic Load Volume K Forecast, by Region 2020 & 2033
- Table 7: Global Feedback Electronic Load Revenue undefined Forecast, by Application 2020 & 2033
- Table 8: Global Feedback Electronic Load Volume K Forecast, by Application 2020 & 2033
- Table 9: Global Feedback Electronic Load Revenue undefined Forecast, by Types 2020 & 2033
- Table 10: Global Feedback Electronic Load Volume K Forecast, by Types 2020 & 2033
- Table 11: Global Feedback Electronic Load Revenue undefined Forecast, by Country 2020 & 2033
- Table 12: Global Feedback Electronic Load Volume K Forecast, by Country 2020 & 2033
- Table 13: United States Feedback Electronic Load Revenue (undefined) Forecast, by Application 2020 & 2033
- Table 14: United States Feedback Electronic Load Volume (K) Forecast, by Application 2020 & 2033
- Table 15: Canada Feedback Electronic Load Revenue (undefined) Forecast, by Application 2020 & 2033
- Table 16: Canada Feedback Electronic Load Volume (K) Forecast, by Application 2020 & 2033
- Table 17: Mexico Feedback Electronic Load Revenue (undefined) Forecast, by Application 2020 & 2033
- Table 18: Mexico Feedback Electronic Load Volume (K) Forecast, by Application 2020 & 2033
- Table 19: Global Feedback Electronic Load Revenue undefined Forecast, by Application 2020 & 2033
- Table 20: Global Feedback Electronic Load Volume K Forecast, by Application 2020 & 2033
- Table 21: Global Feedback Electronic Load Revenue undefined Forecast, by Types 2020 & 2033
- Table 22: Global Feedback Electronic Load Volume K Forecast, by Types 2020 & 2033
- Table 23: Global Feedback Electronic Load Revenue undefined Forecast, by Country 2020 & 2033
- Table 24: Global Feedback Electronic Load Volume K Forecast, by Country 2020 & 2033
- Table 25: Brazil Feedback Electronic Load Revenue (undefined) Forecast, by Application 2020 & 2033
- Table 26: Brazil Feedback Electronic Load Volume (K) Forecast, by Application 2020 & 2033
- Table 27: Argentina Feedback Electronic Load Revenue (undefined) Forecast, by Application 2020 & 2033
- Table 28: Argentina Feedback Electronic Load Volume (K) Forecast, by Application 2020 & 2033
- Table 29: Rest of South America Feedback Electronic Load Revenue (undefined) Forecast, by Application 2020 & 2033
- Table 30: Rest of South America Feedback Electronic Load Volume (K) Forecast, by Application 2020 & 2033
- Table 31: Global Feedback Electronic Load Revenue undefined Forecast, by Application 2020 & 2033
- Table 32: Global Feedback Electronic Load Volume K Forecast, by Application 2020 & 2033
- Table 33: Global Feedback Electronic Load Revenue undefined Forecast, by Types 2020 & 2033
- Table 34: Global Feedback Electronic Load Volume K Forecast, by Types 2020 & 2033
- Table 35: Global Feedback Electronic Load Revenue undefined Forecast, by Country 2020 & 2033
- Table 36: Global Feedback Electronic Load Volume K Forecast, by Country 2020 & 2033
- Table 37: United Kingdom Feedback Electronic Load Revenue (undefined) Forecast, by Application 2020 & 2033
- Table 38: United Kingdom Feedback Electronic Load Volume (K) Forecast, by Application 2020 & 2033
- Table 39: Germany Feedback Electronic Load Revenue (undefined) Forecast, by Application 2020 & 2033
- Table 40: Germany Feedback Electronic Load Volume (K) Forecast, by Application 2020 & 2033
- Table 41: France Feedback Electronic Load Revenue (undefined) Forecast, by Application 2020 & 2033
- Table 42: France Feedback Electronic Load Volume (K) Forecast, by Application 2020 & 2033
- Table 43: Italy Feedback Electronic Load Revenue (undefined) Forecast, by Application 2020 & 2033
- Table 44: Italy Feedback Electronic Load Volume (K) Forecast, by Application 2020 & 2033
- Table 45: Spain Feedback Electronic Load Revenue (undefined) Forecast, by Application 2020 & 2033
- Table 46: Spain Feedback Electronic Load Volume (K) Forecast, by Application 2020 & 2033
- Table 47: Russia Feedback Electronic Load Revenue (undefined) Forecast, by Application 2020 & 2033
- Table 48: Russia Feedback Electronic Load Volume (K) Forecast, by Application 2020 & 2033
- Table 49: Benelux Feedback Electronic Load Revenue (undefined) Forecast, by Application 2020 & 2033
- Table 50: Benelux Feedback Electronic Load Volume (K) Forecast, by Application 2020 & 2033
- Table 51: Nordics Feedback Electronic Load Revenue (undefined) Forecast, by Application 2020 & 2033
- Table 52: Nordics Feedback Electronic Load Volume (K) Forecast, by Application 2020 & 2033
- Table 53: Rest of Europe Feedback Electronic Load Revenue (undefined) Forecast, by Application 2020 & 2033
- Table 54: Rest of Europe Feedback Electronic Load Volume (K) Forecast, by Application 2020 & 2033
- Table 55: Global Feedback Electronic Load Revenue undefined Forecast, by Application 2020 & 2033
- Table 56: Global Feedback Electronic Load Volume K Forecast, by Application 2020 & 2033
- Table 57: Global Feedback Electronic Load Revenue undefined Forecast, by Types 2020 & 2033
- Table 58: Global Feedback Electronic Load Volume K Forecast, by Types 2020 & 2033
- Table 59: Global Feedback Electronic Load Revenue undefined Forecast, by Country 2020 & 2033
- Table 60: Global Feedback Electronic Load Volume K Forecast, by Country 2020 & 2033
- Table 61: Turkey Feedback Electronic Load Revenue (undefined) Forecast, by Application 2020 & 2033
- Table 62: Turkey Feedback Electronic Load Volume (K) Forecast, by Application 2020 & 2033
- Table 63: Israel Feedback Electronic Load Revenue (undefined) Forecast, by Application 2020 & 2033
- Table 64: Israel Feedback Electronic Load Volume (K) Forecast, by Application 2020 & 2033
- Table 65: GCC Feedback Electronic Load Revenue (undefined) Forecast, by Application 2020 & 2033
- Table 66: GCC Feedback Electronic Load Volume (K) Forecast, by Application 2020 & 2033
- Table 67: North Africa Feedback Electronic Load Revenue (undefined) Forecast, by Application 2020 & 2033
- Table 68: North Africa Feedback Electronic Load Volume (K) Forecast, by Application 2020 & 2033
- Table 69: South Africa Feedback Electronic Load Revenue (undefined) Forecast, by Application 2020 & 2033
- Table 70: South Africa Feedback Electronic Load Volume (K) Forecast, by Application 2020 & 2033
- Table 71: Rest of Middle East & Africa Feedback Electronic Load Revenue (undefined) Forecast, by Application 2020 & 2033
- Table 72: Rest of Middle East & Africa Feedback Electronic Load Volume (K) Forecast, by Application 2020 & 2033
- Table 73: Global Feedback Electronic Load Revenue undefined Forecast, by Application 2020 & 2033
- Table 74: Global Feedback Electronic Load Volume K Forecast, by Application 2020 & 2033
- Table 75: Global Feedback Electronic Load Revenue undefined Forecast, by Types 2020 & 2033
- Table 76: Global Feedback Electronic Load Volume K Forecast, by Types 2020 & 2033
- Table 77: Global Feedback Electronic Load Revenue undefined Forecast, by Country 2020 & 2033
- Table 78: Global Feedback Electronic Load Volume K Forecast, by Country 2020 & 2033
- Table 79: China Feedback Electronic Load Revenue (undefined) Forecast, by Application 2020 & 2033
- Table 80: China Feedback Electronic Load Volume (K) Forecast, by Application 2020 & 2033
- Table 81: India Feedback Electronic Load Revenue (undefined) Forecast, by Application 2020 & 2033
- Table 82: India Feedback Electronic Load Volume (K) Forecast, by Application 2020 & 2033
- Table 83: Japan Feedback Electronic Load Revenue (undefined) Forecast, by Application 2020 & 2033
- Table 84: Japan Feedback Electronic Load Volume (K) Forecast, by Application 2020 & 2033
- Table 85: South Korea Feedback Electronic Load Revenue (undefined) Forecast, by Application 2020 & 2033
- Table 86: South Korea Feedback Electronic Load Volume (K) Forecast, by Application 2020 & 2033
- Table 87: ASEAN Feedback Electronic Load Revenue (undefined) Forecast, by Application 2020 & 2033
- Table 88: ASEAN Feedback Electronic Load Volume (K) Forecast, by Application 2020 & 2033
- Table 89: Oceania Feedback Electronic Load Revenue (undefined) Forecast, by Application 2020 & 2033
- Table 90: Oceania Feedback Electronic Load Volume (K) Forecast, by Application 2020 & 2033
- Table 91: Rest of Asia Pacific Feedback Electronic Load Revenue (undefined) Forecast, by Application 2020 & 2033
- Table 92: Rest of Asia Pacific Feedback Electronic Load Volume (K) Forecast, by Application 2020 & 2033
Frequently Asked Questions
1. What is the projected Compound Annual Growth Rate (CAGR) of the Feedback Electronic Load?
The projected CAGR is approximately 8.37%.
2. Which companies are prominent players in the Feedback Electronic Load?
Key companies in the market include EA Elektro-Automatik, Shandong Wocen Power Equipment Co., Ltd., Shandong Hoteam Electric CO., LTD, VILVA, Shanghai Hanbiao Electronic Technology Co., Ltd, ITECH ELECTRONIC CO., LTD., Auspicious Thing Cherry Electronics (Suzhou) co., LTD., , Ainuo Instrument Co., Ltd., , Shenzhen Tewerd Technology Company Co., Ltd., Shandong BOS Energy Technology Co., LTD, Yangzhou Ding Hua Electronics Co.Ltd, Keway Power Electric(Tianjin)Co., Ltd, Shanghai wenshun Electric Appliance Co., Ltd..
3. What are the main segments of the Feedback Electronic Load?
The market segments include Application, Types.
4. Can you provide details about the market size?
The market size is estimated to be USD XXX N/A as of 2022.
5. What are some drivers contributing to market growth?
N/A
6. What are the notable trends driving market growth?
N/A
7. Are there any restraints impacting market growth?
N/A
8. Can you provide examples of recent developments in the market?
N/A
9. What pricing options are available for accessing the report?
Pricing options include single-user, multi-user, and enterprise licenses priced at USD 3350.00, USD 5025.00, and USD 6700.00 respectively.
10. Is the market size provided in terms of value or volume?
The market size is provided in terms of value, measured in N/A and volume, measured in K.
11. Are there any specific market keywords associated with the report?
Yes, the market keyword associated with the report is "Feedback Electronic Load," which aids in identifying and referencing the specific market segment covered.
12. How do I determine which pricing option suits my needs best?
The pricing options vary based on user requirements and access needs. Individual users may opt for single-user licenses, while businesses requiring broader access may choose multi-user or enterprise licenses for cost-effective access to the report.
13. Are there any additional resources or data provided in the Feedback Electronic Load report?
While the report offers comprehensive insights, it's advisable to review the specific contents or supplementary materials provided to ascertain if additional resources or data are available.
14. How can I stay updated on further developments or reports in the Feedback Electronic Load?
To stay informed about further developments, trends, and reports in the Feedback Electronic Load, consider subscribing to industry newsletters, following relevant companies and organizations, or regularly checking reputable industry news sources and publications.
Methodology
Step 1 - Identification of Relevant Samples Size from Population Database


Step 2 - Approaches for Defining Global Market Size (Value, Volume* & Price*)

Note*: In applicable scenarios
Step 3 - Data Sources
Primary Research
- Web Analytics
- Survey Reports
- Research Institute
- Latest Research Reports
- Opinion Leaders
Secondary Research
- Annual Reports
- White Paper
- Latest Press Release
- Industry Association
- Paid Database
- Investor Presentations

Step 4 - Data Triangulation
Involves using different sources of information in order to increase the validity of a study
These sources are likely to be stakeholders in a program - participants, other researchers, program staff, other community members, and so on.
Then we put all data in single framework & apply various statistical tools to find out the dynamic on the market.
During the analysis stage, feedback from the stakeholder groups would be compared to determine areas of agreement as well as areas of divergence