

Key Insights
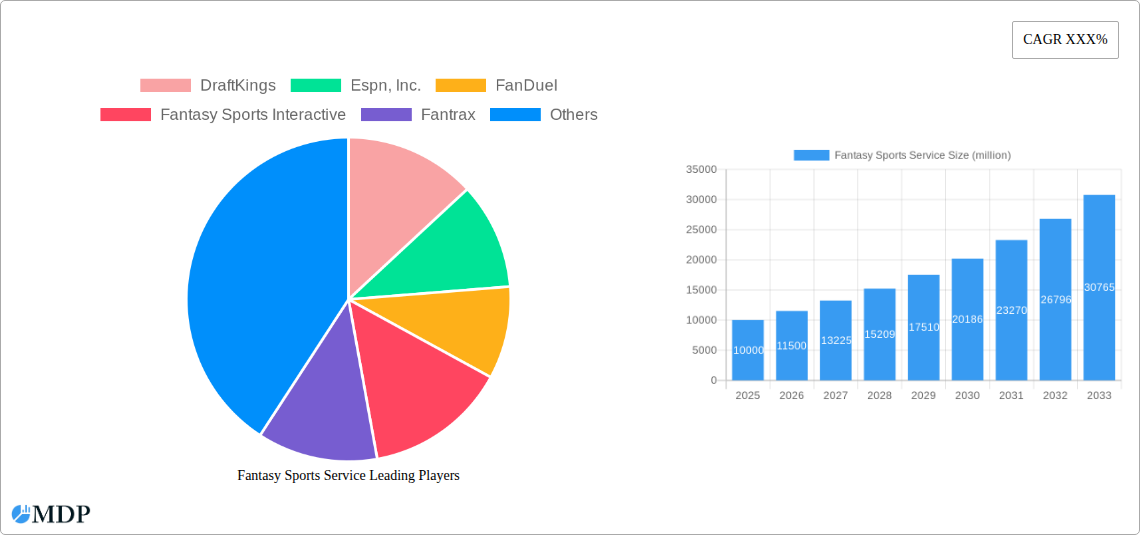
The fantasy sports service market is experiencing robust growth, driven by increasing smartphone penetration, the rising popularity of esports, and the engagement of a younger demographic with interactive gaming experiences. Technological advancements, including improved user interfaces and the integration of artificial intelligence for enhanced player experience and predictive analytics, are further fueling this expansion. The market's competitive landscape is characterized by established players like DraftKings, FanDuel, and ESPN, alongside smaller, niche providers catering to specific sports or fantasy formats. These companies are constantly innovating to offer unique features, such as improved scoring systems, daily fantasy contests, and enhanced social interaction within their platforms, to attract and retain users. The market's expansion is also influenced by strategic partnerships between fantasy sports platforms and sports leagues and media companies, expanding their reach and brand recognition. We estimate the market size to be around $10 billion in 2025, with a Compound Annual Growth Rate (CAGR) of approximately 15% between 2025 and 2033. This growth will be influenced by factors such as the increasing accessibility of high-speed internet and the growing popularity of fantasy sports among casual and dedicated sports fans alike.
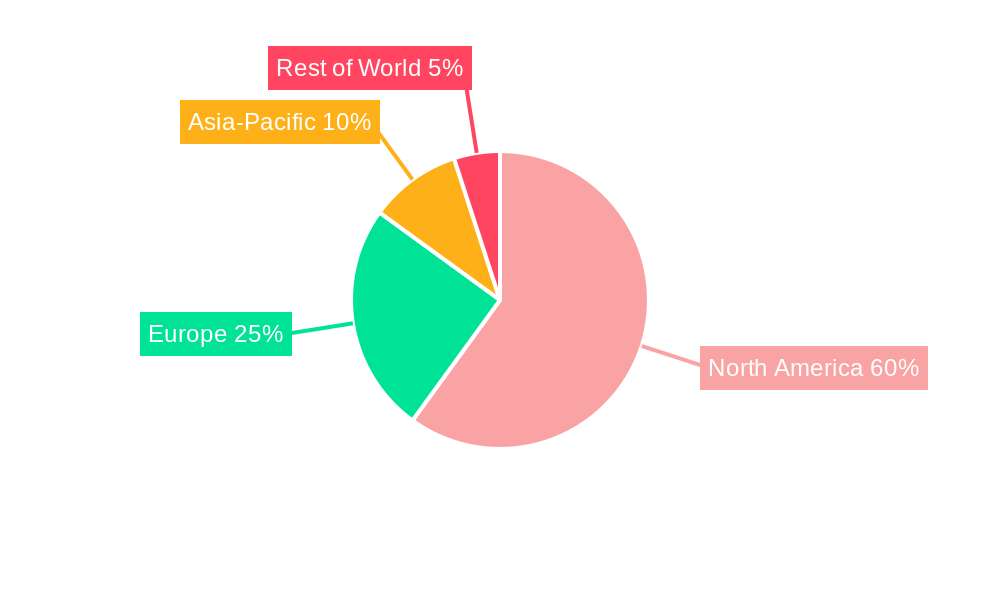
Despite this growth, regulatory challenges and concerns related to responsible gaming present potential restraints. Maintaining user engagement in the face of increasing competition also poses a significant challenge. The market is segmented by platform (web and mobile), sport type (football, basketball, baseball, etc.), and user demographics. Companies are focusing on data analytics to improve their offerings and personalize user experiences, further driving market growth. Regional variations in market penetration and regulatory frameworks contribute to differing growth rates across various geographical locations, with North America currently dominating the market. The forecast period of 2025-2033 anticipates continued expansion driven by evolving technology, innovative game formats, and increasing mainstream acceptance of fantasy sports as a legitimate form of entertainment.
Fantasy Sports Service Market Report: A Comprehensive Analysis (2019-2033)
This comprehensive report provides an in-depth analysis of the global fantasy sports service market, projecting a market value exceeding $XX million by 2033. The report covers the period from 2019 to 2033, with a base year of 2025 and a forecast period from 2025 to 2033. It leverages historical data (2019-2024) to provide actionable insights for industry stakeholders, including leading companies like DraftKings, ESPN Inc., FanDuel, and more. This report is crucial for understanding market dynamics, competitive landscapes, and future growth potential.
Fantasy Sports Service Market Dynamics & Concentration
The fantasy sports service market, valued at $XX million in 2025, exhibits a moderately concentrated landscape dominated by established players like DraftKings, FanDuel, and ESPN Inc. These companies account for a significant portion of the overall market share, estimated at XX%. However, smaller players like Fantasy Sports Interactive and Fantrax continue to carve niches through innovative features and targeted marketing. Market concentration is influenced by several factors:
- Innovation Drivers: The constant introduction of new game formats, enhanced user interfaces, and integration with advanced data analytics drive market growth and attract new players. This leads to ongoing competition among players to stay ahead of the curve.
- Regulatory Frameworks: Varying regulatory landscapes across different jurisdictions influence market expansion. Changes in regulations regarding gambling and data privacy can significantly impact market dynamics and player participation.
- Product Substitutes: The market faces competition from other forms of entertainment and gaming, but its unique engagement and community aspects offer a distinct advantage.
- End-User Trends: Growing adoption of mobile devices and increasing accessibility of high-speed internet are major catalysts for market growth. The increasing popularity of esports also contributes to the overall growth.
- M&A Activities: The market has witnessed a significant number of mergers and acquisitions (M&As) in recent years, estimated at XX deals between 2019 and 2024. This consolidation trend is expected to continue, shaping the competitive landscape further.
Fantasy Sports Service Industry Trends & Analysis
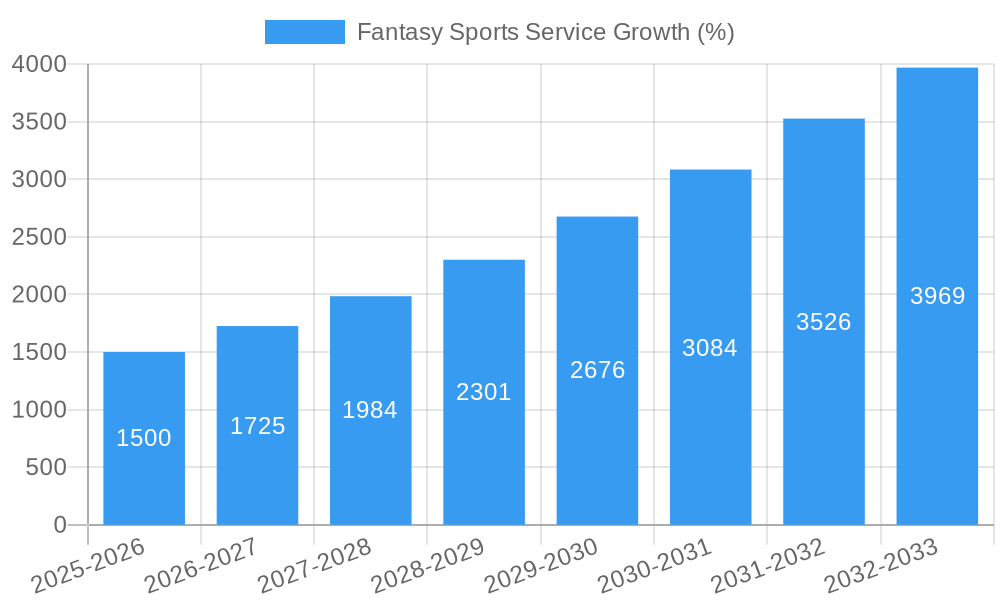
The fantasy sports service market is experiencing robust growth, with a projected Compound Annual Growth Rate (CAGR) of XX% during the forecast period (2025-2033). This growth is propelled by several key factors:
- Market Growth Drivers: Rising disposable incomes in key markets, expanding internet penetration, and increasing popularity of fantasy sports among younger demographics are all major contributors. Technological advancements, like improved user interfaces and predictive analytics, also play a vital role.
- Technological Disruptions: The integration of Artificial Intelligence (AI), machine learning, and big data analytics continues to improve the user experience, offering personalized recommendations and predictive insights. This enhances engagement and fosters a more competitive landscape.
- Consumer Preferences: The demand for personalized experiences, social interaction within fantasy leagues, and readily available data are driving market trends. Mobile-first strategies and innovative game formats are paramount.
- Competitive Dynamics: Intense competition among established players and the emergence of new entrants are fueling innovation and pushing the boundaries of user experience and game mechanics. The market sees constant efforts in improving product features to maintain a competitive edge. Market penetration rates are predicted to reach XX% by 2033.
Leading Markets & Segments in Fantasy Sports Service
The North American market currently dominates the global fantasy sports service market, accounting for an estimated XX% of the global revenue in 2025. This dominance is attributed to several factors:
- Key Drivers in North America:
- Strong established player base: High awareness and penetration of fantasy sports among the population
- Advanced technological infrastructure: Robust internet infrastructure and high smartphone penetration.
- Favorable regulatory environment: Relatively clear and stable regulatory frameworks in many regions.
- Strong professional sports leagues: The significant presence of major professional leagues fosters engagement and excitement.
The dominance of North America reflects a combination of early adoption, well-established player bases, and supportive regulatory frameworks. Other regions, however, show significant growth potential, with Asia and Europe anticipated to experience substantial growth during the forecast period.
Fantasy Sports Service Product Developments
Recent years have witnessed significant advancements in fantasy sports service offerings. The incorporation of AI-powered predictive analytics, enhanced user interfaces, and the introduction of innovative game formats are all shaping the market. Companies are also focusing on improving mobile applications and integrating social features to enhance user engagement and community building. These advancements aim to differentiate offerings and capture larger market shares by providing a seamless and captivating experience for users.
Key Drivers of Fantasy Sports Service Growth
Several factors contribute to the continued growth of the fantasy sports service market:
- Technological Advancements: AI-powered analytics, improved mobile experiences, and enhanced game formats are improving the user experience, driving engagement, and attracting new users.
- Economic Factors: Rising disposable incomes, particularly among younger demographics, are fueling spending on entertainment and gaming.
- Regulatory Changes: Favorable regulatory changes in some regions are opening up new market opportunities and attracting more investment.
Challenges in the Fantasy Sports Service Market
The market faces certain challenges:
- Regulatory Hurdles: Varying regulations across different jurisdictions and ongoing debates surrounding the legal status of daily fantasy sports create uncertainty and complexities for market expansion.
- Competitive Pressures: Intense competition among established players and the emergence of new entrants require continuous innovation and investment to maintain a competitive edge. This leads to pricing pressures and limits profit margins.
- Data Security and Privacy Concerns: Maintaining user data privacy and security is critical, given the sensitive information involved. Data breaches can negatively impact user trust and brand reputation.
Emerging Opportunities in Fantasy Sports Service
Several factors represent key opportunities for future market expansion:
- Technological Breakthroughs: Advances in AI, VR/AR, and blockchain technology hold significant potential to revolutionize user experience, introduce new game modes, and offer enhanced security and transparency.
- Strategic Partnerships: Collaborations with professional sports leagues, media companies, and technology providers can significantly expand market reach and create new revenue streams.
- Market Expansion in Emerging Economies: Untapped potential exists in emerging markets with growing internet and smartphone penetration, offering opportunities for market expansion and growth.
Leading Players in the Fantasy Sports Service Sector
- DraftKings
- ESPN Inc.
- FanDuel
- Fantasy Sports Interactive
- Fantrax
- FOX Sports
- NFL Fantasy
- Sportech Inc.
- Spotlight Sports Group
- Yahoo Inc.
Key Milestones in Fantasy Sports Service Industry
- 2020: Increased adoption of mobile fantasy sports apps.
- 2021: Several significant M&A deals reshaped the competitive landscape.
- 2022: Introduction of innovative game formats and enhanced data analytics features.
- 2023: Focus on improved user interfaces and personalized experiences.
- 2024: Growing integration of AI and machine learning for improved predictions and recommendations.
Strategic Outlook for Fantasy Sports Service Market
The fantasy sports service market is poised for continued growth, driven by technological advancements, increasing user engagement, and expansion into new markets. Strategic partnerships and focused innovation will be key for players to maintain a competitive edge and capture a larger share of this growing market. The focus on personalized experiences, seamless user interfaces, and innovative game mechanics will be crucial for success in the coming years. The market is expected to see further consolidation and an increased emphasis on data analytics to optimize user engagement and enhance the overall fantasy sports experience.
Fantasy Sports Service Segmentation
-
1. Application
- 1.1. Mobile Terminal
- 1.2. PC Terminal
-
2. Type
- 2.1. Football
- 2.2. Volleyball
- 2.3. Others
Fantasy Sports Service Segmentation By Geography
-
1. North America
- 1.1. United States
- 1.2. Canada
- 1.3. Mexico
-
2. South America
- 2.1. Brazil
- 2.2. Argentina
- 2.3. Rest of South America
-
3. Europe
- 3.1. United Kingdom
- 3.2. Germany
- 3.3. France
- 3.4. Italy
- 3.5. Spain
- 3.6. Russia
- 3.7. Benelux
- 3.8. Nordics
- 3.9. Rest of Europe
-
4. Middle East & Africa
- 4.1. Turkey
- 4.2. Israel
- 4.3. GCC
- 4.4. North Africa
- 4.5. South Africa
- 4.6. Rest of Middle East & Africa
-
5. Asia Pacific
- 5.1. China
- 5.2. India
- 5.3. Japan
- 5.4. South Korea
- 5.5. ASEAN
- 5.6. Oceania
- 5.7. Rest of Asia Pacific
Fantasy Sports Service REPORT HIGHLIGHTS
| Aspects | Details |
|---|---|
| Study Period | 2019-2033 |
| Base Year | 2024 |
| Estimated Year | 2025 |
| Forecast Period | 2025-2033 |
| Historical Period | 2019-2024 |
| Growth Rate | CAGR of XXX% from 2019-2033 |
| Segmentation |
|
Table of Contents
- 1. Introduction
- 1.1. Research Scope
- 1.2. Market Segmentation
- 1.3. Research Methodology
- 1.4. Definitions and Assumptions
- 2. Executive Summary
- 2.1. Introduction
- 3. Market Dynamics
- 3.1. Introduction
- 3.2. Market Drivers
- 3.3. Market Restrains
- 3.4. Market Trends
- 4. Market Factor Analysis
- 4.1. Porters Five Forces
- 4.2. Supply/Value Chain
- 4.3. PESTEL analysis
- 4.4. Market Entropy
- 4.5. Patent/Trademark Analysis
- 5. Global Fantasy Sports Service Analysis, Insights and Forecast, 2019-2031
- 5.1. Market Analysis, Insights and Forecast - by Application
- 5.1.1. Mobile Terminal
- 5.1.2. PC Terminal
- 5.2. Market Analysis, Insights and Forecast - by Type
- 5.2.1. Football
- 5.2.2. Volleyball
- 5.2.3. Others
- 5.3. Market Analysis, Insights and Forecast - by Region
- 5.3.1. North America
- 5.3.2. South America
- 5.3.3. Europe
- 5.3.4. Middle East & Africa
- 5.3.5. Asia Pacific
- 5.1. Market Analysis, Insights and Forecast - by Application
- 6. North America Fantasy Sports Service Analysis, Insights and Forecast, 2019-2031
- 6.1. Market Analysis, Insights and Forecast - by Application
- 6.1.1. Mobile Terminal
- 6.1.2. PC Terminal
- 6.2. Market Analysis, Insights and Forecast - by Type
- 6.2.1. Football
- 6.2.2. Volleyball
- 6.2.3. Others
- 6.1. Market Analysis, Insights and Forecast - by Application
- 7. South America Fantasy Sports Service Analysis, Insights and Forecast, 2019-2031
- 7.1. Market Analysis, Insights and Forecast - by Application
- 7.1.1. Mobile Terminal
- 7.1.2. PC Terminal
- 7.2. Market Analysis, Insights and Forecast - by Type
- 7.2.1. Football
- 7.2.2. Volleyball
- 7.2.3. Others
- 7.1. Market Analysis, Insights and Forecast - by Application
- 8. Europe Fantasy Sports Service Analysis, Insights and Forecast, 2019-2031
- 8.1. Market Analysis, Insights and Forecast - by Application
- 8.1.1. Mobile Terminal
- 8.1.2. PC Terminal
- 8.2. Market Analysis, Insights and Forecast - by Type
- 8.2.1. Football
- 8.2.2. Volleyball
- 8.2.3. Others
- 8.1. Market Analysis, Insights and Forecast - by Application
- 9. Middle East & Africa Fantasy Sports Service Analysis, Insights and Forecast, 2019-2031
- 9.1. Market Analysis, Insights and Forecast - by Application
- 9.1.1. Mobile Terminal
- 9.1.2. PC Terminal
- 9.2. Market Analysis, Insights and Forecast - by Type
- 9.2.1. Football
- 9.2.2. Volleyball
- 9.2.3. Others
- 9.1. Market Analysis, Insights and Forecast - by Application
- 10. Asia Pacific Fantasy Sports Service Analysis, Insights and Forecast, 2019-2031
- 10.1. Market Analysis, Insights and Forecast - by Application
- 10.1.1. Mobile Terminal
- 10.1.2. PC Terminal
- 10.2. Market Analysis, Insights and Forecast - by Type
- 10.2.1. Football
- 10.2.2. Volleyball
- 10.2.3. Others
- 10.1. Market Analysis, Insights and Forecast - by Application
- 11. Competitive Analysis
- 11.1. Global Market Share Analysis 2024
- 11.2. Company Profiles
- 11.2.1 DraftKings
- 11.2.1.1. Overview
- 11.2.1.2. Products
- 11.2.1.3. SWOT Analysis
- 11.2.1.4. Recent Developments
- 11.2.1.5. Financials (Based on Availability)
- 11.2.2 Espn Inc.
- 11.2.2.1. Overview
- 11.2.2.2. Products
- 11.2.2.3. SWOT Analysis
- 11.2.2.4. Recent Developments
- 11.2.2.5. Financials (Based on Availability)
- 11.2.3 FanDuel
- 11.2.3.1. Overview
- 11.2.3.2. Products
- 11.2.3.3. SWOT Analysis
- 11.2.3.4. Recent Developments
- 11.2.3.5. Financials (Based on Availability)
- 11.2.4 Fantasy Sports Interactive
- 11.2.4.1. Overview
- 11.2.4.2. Products
- 11.2.4.3. SWOT Analysis
- 11.2.4.4. Recent Developments
- 11.2.4.5. Financials (Based on Availability)
- 11.2.5 Fantrax
- 11.2.5.1. Overview
- 11.2.5.2. Products
- 11.2.5.3. SWOT Analysis
- 11.2.5.4. Recent Developments
- 11.2.5.5. Financials (Based on Availability)
- 11.2.6 FOX Sports
- 11.2.6.1. Overview
- 11.2.6.2. Products
- 11.2.6.3. SWOT Analysis
- 11.2.6.4. Recent Developments
- 11.2.6.5. Financials (Based on Availability)
- 11.2.7 NFL Fantasy
- 11.2.7.1. Overview
- 11.2.7.2. Products
- 11.2.7.3. SWOT Analysis
- 11.2.7.4. Recent Developments
- 11.2.7.5. Financials (Based on Availability)
- 11.2.8 Sportech Inc.
- 11.2.8.1. Overview
- 11.2.8.2. Products
- 11.2.8.3. SWOT Analysis
- 11.2.8.4. Recent Developments
- 11.2.8.5. Financials (Based on Availability)
- 11.2.9 Spotlight Sports Group
- 11.2.9.1. Overview
- 11.2.9.2. Products
- 11.2.9.3. SWOT Analysis
- 11.2.9.4. Recent Developments
- 11.2.9.5. Financials (Based on Availability)
- 11.2.10 Yahoo Inc.
- 11.2.10.1. Overview
- 11.2.10.2. Products
- 11.2.10.3. SWOT Analysis
- 11.2.10.4. Recent Developments
- 11.2.10.5. Financials (Based on Availability)
- 11.2.1 DraftKings
List of Figures
- Figure 1: Global Fantasy Sports Service Revenue Breakdown (million, %) by Region 2024 & 2032
- Figure 2: North America Fantasy Sports Service Revenue (million), by Application 2024 & 2032
- Figure 3: North America Fantasy Sports Service Revenue Share (%), by Application 2024 & 2032
- Figure 4: North America Fantasy Sports Service Revenue (million), by Type 2024 & 2032
- Figure 5: North America Fantasy Sports Service Revenue Share (%), by Type 2024 & 2032
- Figure 6: North America Fantasy Sports Service Revenue (million), by Country 2024 & 2032
- Figure 7: North America Fantasy Sports Service Revenue Share (%), by Country 2024 & 2032
- Figure 8: South America Fantasy Sports Service Revenue (million), by Application 2024 & 2032
- Figure 9: South America Fantasy Sports Service Revenue Share (%), by Application 2024 & 2032
- Figure 10: South America Fantasy Sports Service Revenue (million), by Type 2024 & 2032
- Figure 11: South America Fantasy Sports Service Revenue Share (%), by Type 2024 & 2032
- Figure 12: South America Fantasy Sports Service Revenue (million), by Country 2024 & 2032
- Figure 13: South America Fantasy Sports Service Revenue Share (%), by Country 2024 & 2032
- Figure 14: Europe Fantasy Sports Service Revenue (million), by Application 2024 & 2032
- Figure 15: Europe Fantasy Sports Service Revenue Share (%), by Application 2024 & 2032
- Figure 16: Europe Fantasy Sports Service Revenue (million), by Type 2024 & 2032
- Figure 17: Europe Fantasy Sports Service Revenue Share (%), by Type 2024 & 2032
- Figure 18: Europe Fantasy Sports Service Revenue (million), by Country 2024 & 2032
- Figure 19: Europe Fantasy Sports Service Revenue Share (%), by Country 2024 & 2032
- Figure 20: Middle East & Africa Fantasy Sports Service Revenue (million), by Application 2024 & 2032
- Figure 21: Middle East & Africa Fantasy Sports Service Revenue Share (%), by Application 2024 & 2032
- Figure 22: Middle East & Africa Fantasy Sports Service Revenue (million), by Type 2024 & 2032
- Figure 23: Middle East & Africa Fantasy Sports Service Revenue Share (%), by Type 2024 & 2032
- Figure 24: Middle East & Africa Fantasy Sports Service Revenue (million), by Country 2024 & 2032
- Figure 25: Middle East & Africa Fantasy Sports Service Revenue Share (%), by Country 2024 & 2032
- Figure 26: Asia Pacific Fantasy Sports Service Revenue (million), by Application 2024 & 2032
- Figure 27: Asia Pacific Fantasy Sports Service Revenue Share (%), by Application 2024 & 2032
- Figure 28: Asia Pacific Fantasy Sports Service Revenue (million), by Type 2024 & 2032
- Figure 29: Asia Pacific Fantasy Sports Service Revenue Share (%), by Type 2024 & 2032
- Figure 30: Asia Pacific Fantasy Sports Service Revenue (million), by Country 2024 & 2032
- Figure 31: Asia Pacific Fantasy Sports Service Revenue Share (%), by Country 2024 & 2032
List of Tables
- Table 1: Global Fantasy Sports Service Revenue million Forecast, by Region 2019 & 2032
- Table 2: Global Fantasy Sports Service Revenue million Forecast, by Application 2019 & 2032
- Table 3: Global Fantasy Sports Service Revenue million Forecast, by Type 2019 & 2032
- Table 4: Global Fantasy Sports Service Revenue million Forecast, by Region 2019 & 2032
- Table 5: Global Fantasy Sports Service Revenue million Forecast, by Application 2019 & 2032
- Table 6: Global Fantasy Sports Service Revenue million Forecast, by Type 2019 & 2032
- Table 7: Global Fantasy Sports Service Revenue million Forecast, by Country 2019 & 2032
- Table 8: United States Fantasy Sports Service Revenue (million) Forecast, by Application 2019 & 2032
- Table 9: Canada Fantasy Sports Service Revenue (million) Forecast, by Application 2019 & 2032
- Table 10: Mexico Fantasy Sports Service Revenue (million) Forecast, by Application 2019 & 2032
- Table 11: Global Fantasy Sports Service Revenue million Forecast, by Application 2019 & 2032
- Table 12: Global Fantasy Sports Service Revenue million Forecast, by Type 2019 & 2032
- Table 13: Global Fantasy Sports Service Revenue million Forecast, by Country 2019 & 2032
- Table 14: Brazil Fantasy Sports Service Revenue (million) Forecast, by Application 2019 & 2032
- Table 15: Argentina Fantasy Sports Service Revenue (million) Forecast, by Application 2019 & 2032
- Table 16: Rest of South America Fantasy Sports Service Revenue (million) Forecast, by Application 2019 & 2032
- Table 17: Global Fantasy Sports Service Revenue million Forecast, by Application 2019 & 2032
- Table 18: Global Fantasy Sports Service Revenue million Forecast, by Type 2019 & 2032
- Table 19: Global Fantasy Sports Service Revenue million Forecast, by Country 2019 & 2032
- Table 20: United Kingdom Fantasy Sports Service Revenue (million) Forecast, by Application 2019 & 2032
- Table 21: Germany Fantasy Sports Service Revenue (million) Forecast, by Application 2019 & 2032
- Table 22: France Fantasy Sports Service Revenue (million) Forecast, by Application 2019 & 2032
- Table 23: Italy Fantasy Sports Service Revenue (million) Forecast, by Application 2019 & 2032
- Table 24: Spain Fantasy Sports Service Revenue (million) Forecast, by Application 2019 & 2032
- Table 25: Russia Fantasy Sports Service Revenue (million) Forecast, by Application 2019 & 2032
- Table 26: Benelux Fantasy Sports Service Revenue (million) Forecast, by Application 2019 & 2032
- Table 27: Nordics Fantasy Sports Service Revenue (million) Forecast, by Application 2019 & 2032
- Table 28: Rest of Europe Fantasy Sports Service Revenue (million) Forecast, by Application 2019 & 2032
- Table 29: Global Fantasy Sports Service Revenue million Forecast, by Application 2019 & 2032
- Table 30: Global Fantasy Sports Service Revenue million Forecast, by Type 2019 & 2032
- Table 31: Global Fantasy Sports Service Revenue million Forecast, by Country 2019 & 2032
- Table 32: Turkey Fantasy Sports Service Revenue (million) Forecast, by Application 2019 & 2032
- Table 33: Israel Fantasy Sports Service Revenue (million) Forecast, by Application 2019 & 2032
- Table 34: GCC Fantasy Sports Service Revenue (million) Forecast, by Application 2019 & 2032
- Table 35: North Africa Fantasy Sports Service Revenue (million) Forecast, by Application 2019 & 2032
- Table 36: South Africa Fantasy Sports Service Revenue (million) Forecast, by Application 2019 & 2032
- Table 37: Rest of Middle East & Africa Fantasy Sports Service Revenue (million) Forecast, by Application 2019 & 2032
- Table 38: Global Fantasy Sports Service Revenue million Forecast, by Application 2019 & 2032
- Table 39: Global Fantasy Sports Service Revenue million Forecast, by Type 2019 & 2032
- Table 40: Global Fantasy Sports Service Revenue million Forecast, by Country 2019 & 2032
- Table 41: China Fantasy Sports Service Revenue (million) Forecast, by Application 2019 & 2032
- Table 42: India Fantasy Sports Service Revenue (million) Forecast, by Application 2019 & 2032
- Table 43: Japan Fantasy Sports Service Revenue (million) Forecast, by Application 2019 & 2032
- Table 44: South Korea Fantasy Sports Service Revenue (million) Forecast, by Application 2019 & 2032
- Table 45: ASEAN Fantasy Sports Service Revenue (million) Forecast, by Application 2019 & 2032
- Table 46: Oceania Fantasy Sports Service Revenue (million) Forecast, by Application 2019 & 2032
- Table 47: Rest of Asia Pacific Fantasy Sports Service Revenue (million) Forecast, by Application 2019 & 2032
Frequently Asked Questions
1. What is the projected Compound Annual Growth Rate (CAGR) of the Fantasy Sports Service?
The projected CAGR is approximately XXX%.
2. Which companies are prominent players in the Fantasy Sports Service?
Key companies in the market include DraftKings, Espn, Inc., FanDuel, Fantasy Sports Interactive, Fantrax, FOX Sports, NFL Fantasy, Sportech Inc., Spotlight Sports Group, Yahoo Inc..
3. What are the main segments of the Fantasy Sports Service?
The market segments include Application, Type.
4. Can you provide details about the market size?
The market size is estimated to be USD XXX million as of 2022.
5. What are some drivers contributing to market growth?
N/A
6. What are the notable trends driving market growth?
N/A
7. Are there any restraints impacting market growth?
N/A
8. Can you provide examples of recent developments in the market?
N/A
9. What pricing options are available for accessing the report?
Pricing options include single-user, multi-user, and enterprise licenses priced at USD 2900.00, USD 4350.00, and USD 5800.00 respectively.
10. Is the market size provided in terms of value or volume?
The market size is provided in terms of value, measured in million.
11. Are there any specific market keywords associated with the report?
Yes, the market keyword associated with the report is "Fantasy Sports Service," which aids in identifying and referencing the specific market segment covered.
12. How do I determine which pricing option suits my needs best?
The pricing options vary based on user requirements and access needs. Individual users may opt for single-user licenses, while businesses requiring broader access may choose multi-user or enterprise licenses for cost-effective access to the report.
13. Are there any additional resources or data provided in the Fantasy Sports Service report?
While the report offers comprehensive insights, it's advisable to review the specific contents or supplementary materials provided to ascertain if additional resources or data are available.
14. How can I stay updated on further developments or reports in the Fantasy Sports Service?
To stay informed about further developments, trends, and reports in the Fantasy Sports Service, consider subscribing to industry newsletters, following relevant companies and organizations, or regularly checking reputable industry news sources and publications.
Methodology
Step 1 - Identification of Relevant Samples Size from Population Database


Step 2 - Approaches for Defining Global Market Size (Value, Volume* & Price*)

Note*: In applicable scenarios
Step 3 - Data Sources
Primary Research
- Web Analytics
- Survey Reports
- Research Institute
- Latest Research Reports
- Opinion Leaders
Secondary Research
- Annual Reports
- White Paper
- Latest Press Release
- Industry Association
- Paid Database
- Investor Presentations

Step 4 - Data Triangulation
Involves using different sources of information in order to increase the validity of a study
These sources are likely to be stakeholders in a program - participants, other researchers, program staff, other community members, and so on.
Then we put all data in single framework & apply various statistical tools to find out the dynamic on the market.
During the analysis stage, feedback from the stakeholder groups would be compared to determine areas of agreement as well as areas of divergence
