

Key Insights
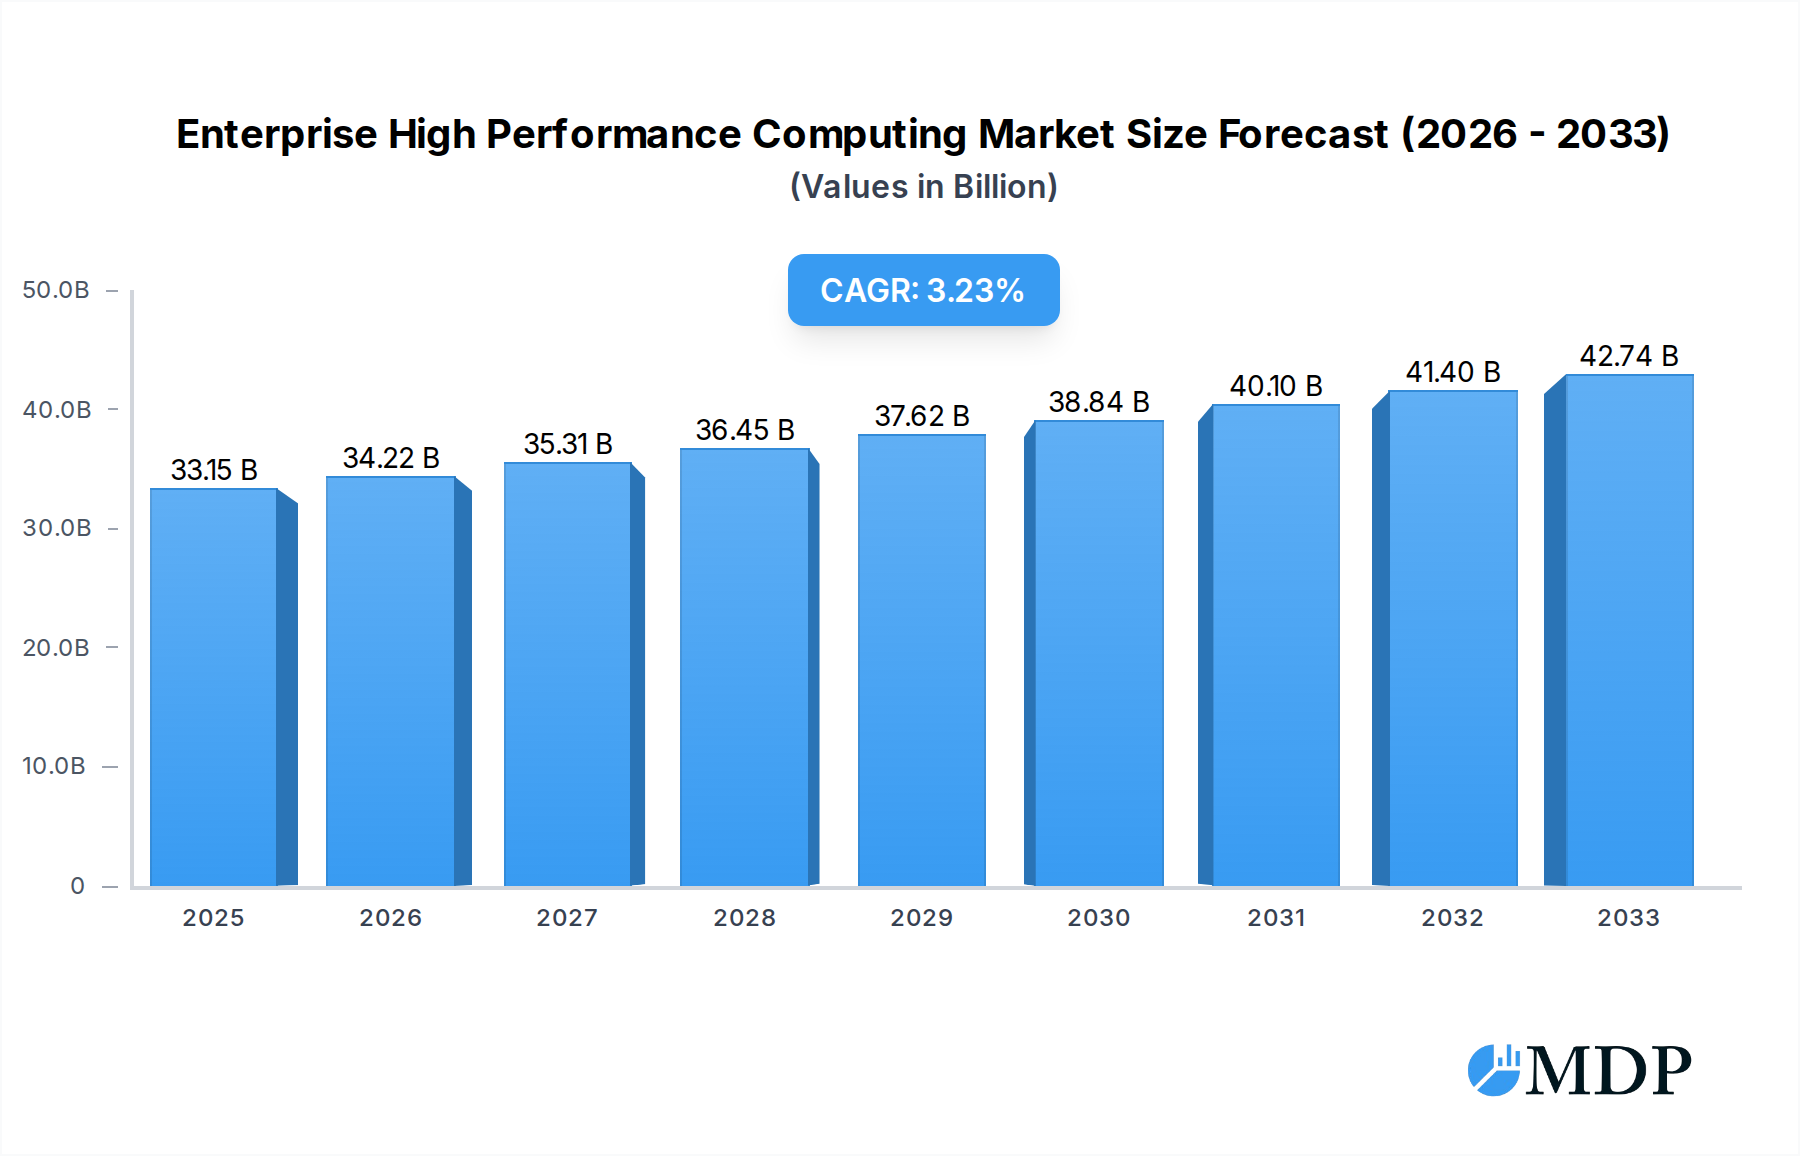
The Enterprise High-Performance Computing (HPC) market is poised for significant growth, projected to reach an estimated $33,150 million by 2025. This robust expansion is underpinned by a compound annual growth rate (CAGR) of 3.2% over the forecast period from 2025 to 2033. The increasing demand for advanced computational power across diverse industries is a primary driver. Sectors like financial services, leveraging HPC for complex risk analysis and algorithmic trading, and life sciences, utilizing it for drug discovery, genomic sequencing, and personalized medicine, are at the forefront of this adoption. Furthermore, the manufacturing sector is increasingly employing HPC for sophisticated simulations, design optimization, and predictive maintenance, while the oil and gas industry relies on it for seismic data processing and reservoir simulation. The automotive industry is also a key beneficiary, utilizing HPC for vehicle design, crash simulations, and the development of autonomous driving technologies. This pervasive need for accelerated data processing and complex problem-solving is fueling consistent market expansion.

Enterprise High Performance Computing Market Size (In Billion)
Emerging trends and technological advancements are further shaping the enterprise HPC landscape. The growing adoption of cloud-based HPC services is democratizing access to powerful computing resources, enabling smaller enterprises to benefit from HPC without substantial upfront investments in hardware. This shift towards hybrid and multi-cloud environments allows for greater flexibility and scalability. The continuous evolution of hardware, including faster processors, specialized accelerators like GPUs and FPGAs, and high-speed interconnects, is enhancing the performance and efficiency of HPC systems. While the significant initial investment and the need for specialized expertise can act as restraints, the compelling return on investment derived from enhanced innovation, faster time-to-market, and improved operational efficiency are mitigating these challenges. Key players such as Amazon, IBM, Hewlett Packard Enterprise, and Microsoft are actively investing in R&D and expanding their HPC offerings, catering to the evolving demands of the global market.
Enterprise High Performance Computing Company Market Share
Gain unparalleled insights into the Enterprise High Performance Computing (HPC) market with this comprehensive report. Spanning a study period from 2019 to 2033, with a base year of 2025 and a detailed forecast period of 2025–2033, this analysis leverages historical data from 2019–2024 to predict future trends and opportunities. Explore the burgeoning global HPC market size, estimated to reach over a million by the forecast period, driven by massive data processing demands across diverse sectors.
This report is your definitive guide to understanding the competitive landscape, technological advancements, and strategic imperatives shaping the future of Enterprise HPC. We dissect the impact of cloud HPC services, on-premise HPC solutions, and the transformative role of HPC in automotive, manufacturing, financial services, life sciences, oil and gas, and other critical industries. Uncover the innovations from leading players like Amazon, Bright Computing, Cray, Dell EMC, Ephesoft, Hewlett Packard Enterprise, IBM, Lenovo, Mellanox Technologies, Microsoft, Panasas, Pure Storage, and Verne Global.
Enterprise High Performance Computing Market Dynamics & Concentration
The Enterprise High Performance Computing market exhibits a dynamic interplay of innovation, competition, and strategic consolidation. Market concentration is moderately high, with a few dominant players controlling significant market share, estimated at over 25% for the top three vendors. Innovation drivers are primarily fueled by the relentless demand for faster processing speeds, larger data handling capabilities, and advancements in AI and machine learning. Regulatory frameworks, while largely supportive of technological advancement, are evolving to address data privacy and security concerns, particularly impacting financial services and life sciences segments. Product substitutes, such as advanced workstations and specialized cloud offerings, are continuously emerging, compelling HPC vendors to innovate rapidly. End-user trends showcase a strong shift towards cloud-based HPC solutions for scalability and cost-effectiveness, while on-premise deployments remain crucial for highly sensitive data and specialized workloads. Mergers and acquisitions (M&A) activities are a significant indicator of market maturity, with an estimated 15-20 major M&A deals recorded over the historical period, aimed at expanding product portfolios and market reach.
Enterprise High Performance Computing Industry Trends & Analysis
The Enterprise High Performance Computing (HPC) industry is on an unprecedented growth trajectory, projected to witness a Compound Annual Growth Rate (CAGR) of approximately 12% from 2025 to 2033. This remarkable expansion is propelled by a confluence of factors, chief among them being the exponential growth of data generated across virtually all industries. Organizations are increasingly leveraging HPC to process massive datasets, derive actionable insights, and accelerate innovation cycles, especially in fields like scientific research, drug discovery, financial modeling, and complex engineering simulations. Technological disruptions are a constant feature, with advancements in processor architectures, accelerated computing (GPUs, FPGAs), high-speed interconnects (e.g., InfiniBand), and advanced storage solutions continuously pushing the boundaries of performance and efficiency. The integration of Artificial Intelligence (AI) and Machine Learning (ML) workloads is a defining trend, transforming HPC from a tool for traditional scientific computing to a pivotal platform for AI-driven decision-making and predictive analytics. Consumer preferences are shifting towards flexible, scalable, and cost-effective solutions. This has led to a significant surge in the adoption of cloud HPC services, which offer on-demand access to powerful computing resources without the substantial upfront investment in hardware and infrastructure. However, on-premise HPC deployments remain vital for organizations with stringent data sovereignty requirements, unique security needs, or exceptionally demanding and predictable workloads. The competitive dynamics within the HPC market are intense, characterized by strategic partnerships, product differentiation, and a constant race to offer superior performance and value. Companies are investing heavily in research and development to optimize software and hardware for emerging AI workloads and to improve energy efficiency, a growing concern for large-scale HPC deployments. Market penetration of HPC solutions is steadily increasing, moving beyond traditional research institutions and large enterprises to encompass a broader range of mid-sized businesses seeking to gain a competitive edge through advanced computational capabilities. The ongoing digital transformation across industries is the fundamental catalyst, underscoring the indispensable role of HPC in solving complex problems and driving future advancements.
Leading Markets & Segments in Enterprise High Performance Computing
The Enterprise High Performance Computing market demonstrates distinct regional and sectoral dominance, driven by specific industry needs and economic policies. North America currently holds a dominant position, largely due to its robust technological infrastructure, significant investments in research and development, and the strong presence of leading technology companies and government research institutions. The United States, in particular, is a powerhouse in HPC adoption across all key segments.
Dominant Application Segments:
- Life Sciences: This segment is a significant driver of HPC adoption. The pursuit of groundbreaking drug discoveries, personalized medicine, genomic sequencing, and complex molecular simulations requires immense computational power. Factors like increasing healthcare expenditure, a growing prevalence of chronic diseases, and advancements in bioinformatics research contribute to its dominance. For example, the development of new vaccines and therapies often relies on extensive simulations that are only feasible with HPC.
- Financial Services: HPC is crucial for high-frequency trading, risk management, fraud detection, and complex financial modeling. The need for real-time data analysis and low-latency processing in this sector fuels demand for powerful computing solutions. Regulatory pressures to enhance security and compliance also indirectly boost HPC adoption for advanced analytics.
- Manufacturing: The automotive industry, a subset of manufacturing, heavily utilizes HPC for computational fluid dynamics (CFD) simulations, crash testing, product design, and optimizing manufacturing processes. Advances in digital twins and Industry 4.0 initiatives are further accelerating HPC adoption for predictive maintenance and smart factory solutions.
Dominant Deployment Types:
- Cloud Services: While on-premise HPC remains critical for certain use cases, the cloud services segment is experiencing the most rapid growth. Its dominance is attributed to its inherent scalability, flexibility, and cost-effectiveness. Businesses can access cutting-edge HPC resources on-demand, avoiding large capital expenditures and the complexities of managing physical infrastructure. This is particularly appealing for emerging players and organizations with fluctuating computational needs. The economic policies favoring cloud adoption, along with the extensive cloud infrastructure built by major providers like Amazon and Microsoft, further solidify this trend.
The continued investment in R&D, coupled with government initiatives promoting technological advancement and digital transformation across these sectors, will sustain the growth and influence of these leading markets and segments in the coming years.
Enterprise High Performance Computing Product Developments
Recent product developments in Enterprise HPC are characterized by a focus on enhanced performance, AI/ML optimization, and energy efficiency. Innovations include next-generation CPUs and GPUs with significantly improved processing capabilities, enabling faster execution of complex simulations and data analytics. High-speed interconnect technologies are being refined to reduce latency and increase data throughput, crucial for distributed computing environments. Furthermore, specialized hardware accelerators and software frameworks are emerging to streamline AI and ML workloads, making HPC platforms more accessible for these rapidly expanding applications. Competitive advantages are being forged through integrated solutions that combine hardware, software, and cloud services, offering end-to-end capabilities for diverse enterprise needs.
Key Drivers of Enterprise High Performance Computing Growth
The growth of the Enterprise HPC market is propelled by several pivotal factors. Technological advancements in processor architectures, memory, and storage are continuously delivering more powerful and efficient systems. The escalating volume and complexity of data generated by industries like AI, IoT, and scientific research necessitate HPC solutions for effective analysis and insight generation. Economic factors, including the increasing realization of ROI from HPC investments in R&D and product development, further fuel adoption. Additionally, regulatory mandates in sectors like pharmaceuticals and finance, requiring advanced analytics for compliance and discovery, act as significant growth catalysts. The widespread digital transformation initiatives across all industries are fundamentally driving the demand for high-performance computing capabilities.
Challenges in the Enterprise High Performance Computing Market
Despite robust growth, the Enterprise HPC market faces notable challenges. High upfront costs associated with acquiring and maintaining HPC infrastructure remain a barrier for some organizations. Complexity in managing and optimizing HPC systems requires specialized expertise, leading to a talent shortage. Scalability limitations, particularly for on-premise solutions, can hinder rapid expansion to meet fluctuating demands. Furthermore, energy consumption and its associated operational costs and environmental impact are growing concerns. Intense competitive pressures and the rapid pace of technological obsolescence necessitate continuous investment and innovation, adding to the financial burden.
Emerging Opportunities in Enterprise High Performance Computing
Emerging opportunities in Enterprise HPC are primarily driven by technological breakthroughs and evolving market demands. The continued integration of Artificial Intelligence (AI) and Machine Learning (ML) workloads presents a massive growth avenue, as enterprises seek to leverage HPC for advanced analytics, predictive modeling, and AI-driven innovation. The expansion of cloud HPC services offers new market access, particularly for small and medium-sized enterprises (SMEs) that can now afford powerful computing resources. Strategic partnerships between hardware vendors, software providers, and cloud service providers are creating integrated, end-to-end solutions that simplify adoption. Furthermore, the growing focus on sustainable computing presents an opportunity for vendors to develop and offer energy-efficient HPC solutions.
Leading Players in the Enterprise High Performance Computing Sector
- Amazon
- Bright Computing
- Cray
- Dell EMC
- Ephesoft
- Hewlett Packard Enterprise
- IBM
- Lenovo
- Mellanox Technologies
- Microsoft
- Panasas
- Pure Storage
- Verne Global
Key Milestones in Enterprise High Performance Computing Industry
- 2019: Introduction of new GPU architectures significantly boosting AI/ML performance.
- 2020: Increased adoption of containerization technologies (e.g., Docker, Kubernetes) for HPC workloads.
- 2021: Major cloud providers expand their HPC offerings, driving wider accessibility.
- 2022: Significant advancements in interconnect technologies (e.g., InfiniBand) for faster data transfer.
- 2023: Growing focus on exascale computing and its implications for enterprise adoption.
- 2024: Emergence of specialized HPC solutions optimized for quantum computing integration.
Strategic Outlook for Enterprise High Performance Computing Market
The strategic outlook for the Enterprise HPC market is exceptionally positive, fueled by sustained demand for advanced computational power. The increasing adoption of AI/ML and the ongoing digital transformation across industries will continue to be key growth accelerators. The expansion of cloud HPC services will democratize access to powerful computing, enabling a broader range of businesses to leverage HPC for competitive advantage. Strategic opportunities lie in developing more integrated, user-friendly, and energy-efficient HPC solutions, alongside fostering deeper partnerships to address complex industry-specific challenges. The market is poised for continued innovation and significant expansion.
Enterprise High Performance Computing Segmentation
-
1. Application
- 1.1. Automotive
- 1.2. Manufacturing
- 1.3. Financial Services
- 1.4. Life Sciences
- 1.5. Oil and Gas
- 1.6. Others
-
2. Types
- 2.1. On-Premise
- 2.2. Cloud Services
Enterprise High Performance Computing Segmentation By Geography
-
1. North America
- 1.1. United States
- 1.2. Canada
- 1.3. Mexico
-
2. South America
- 2.1. Brazil
- 2.2. Argentina
- 2.3. Rest of South America
-
3. Europe
- 3.1. United Kingdom
- 3.2. Germany
- 3.3. France
- 3.4. Italy
- 3.5. Spain
- 3.6. Russia
- 3.7. Benelux
- 3.8. Nordics
- 3.9. Rest of Europe
-
4. Middle East & Africa
- 4.1. Turkey
- 4.2. Israel
- 4.3. GCC
- 4.4. North Africa
- 4.5. South Africa
- 4.6. Rest of Middle East & Africa
-
5. Asia Pacific
- 5.1. China
- 5.2. India
- 5.3. Japan
- 5.4. South Korea
- 5.5. ASEAN
- 5.6. Oceania
- 5.7. Rest of Asia Pacific
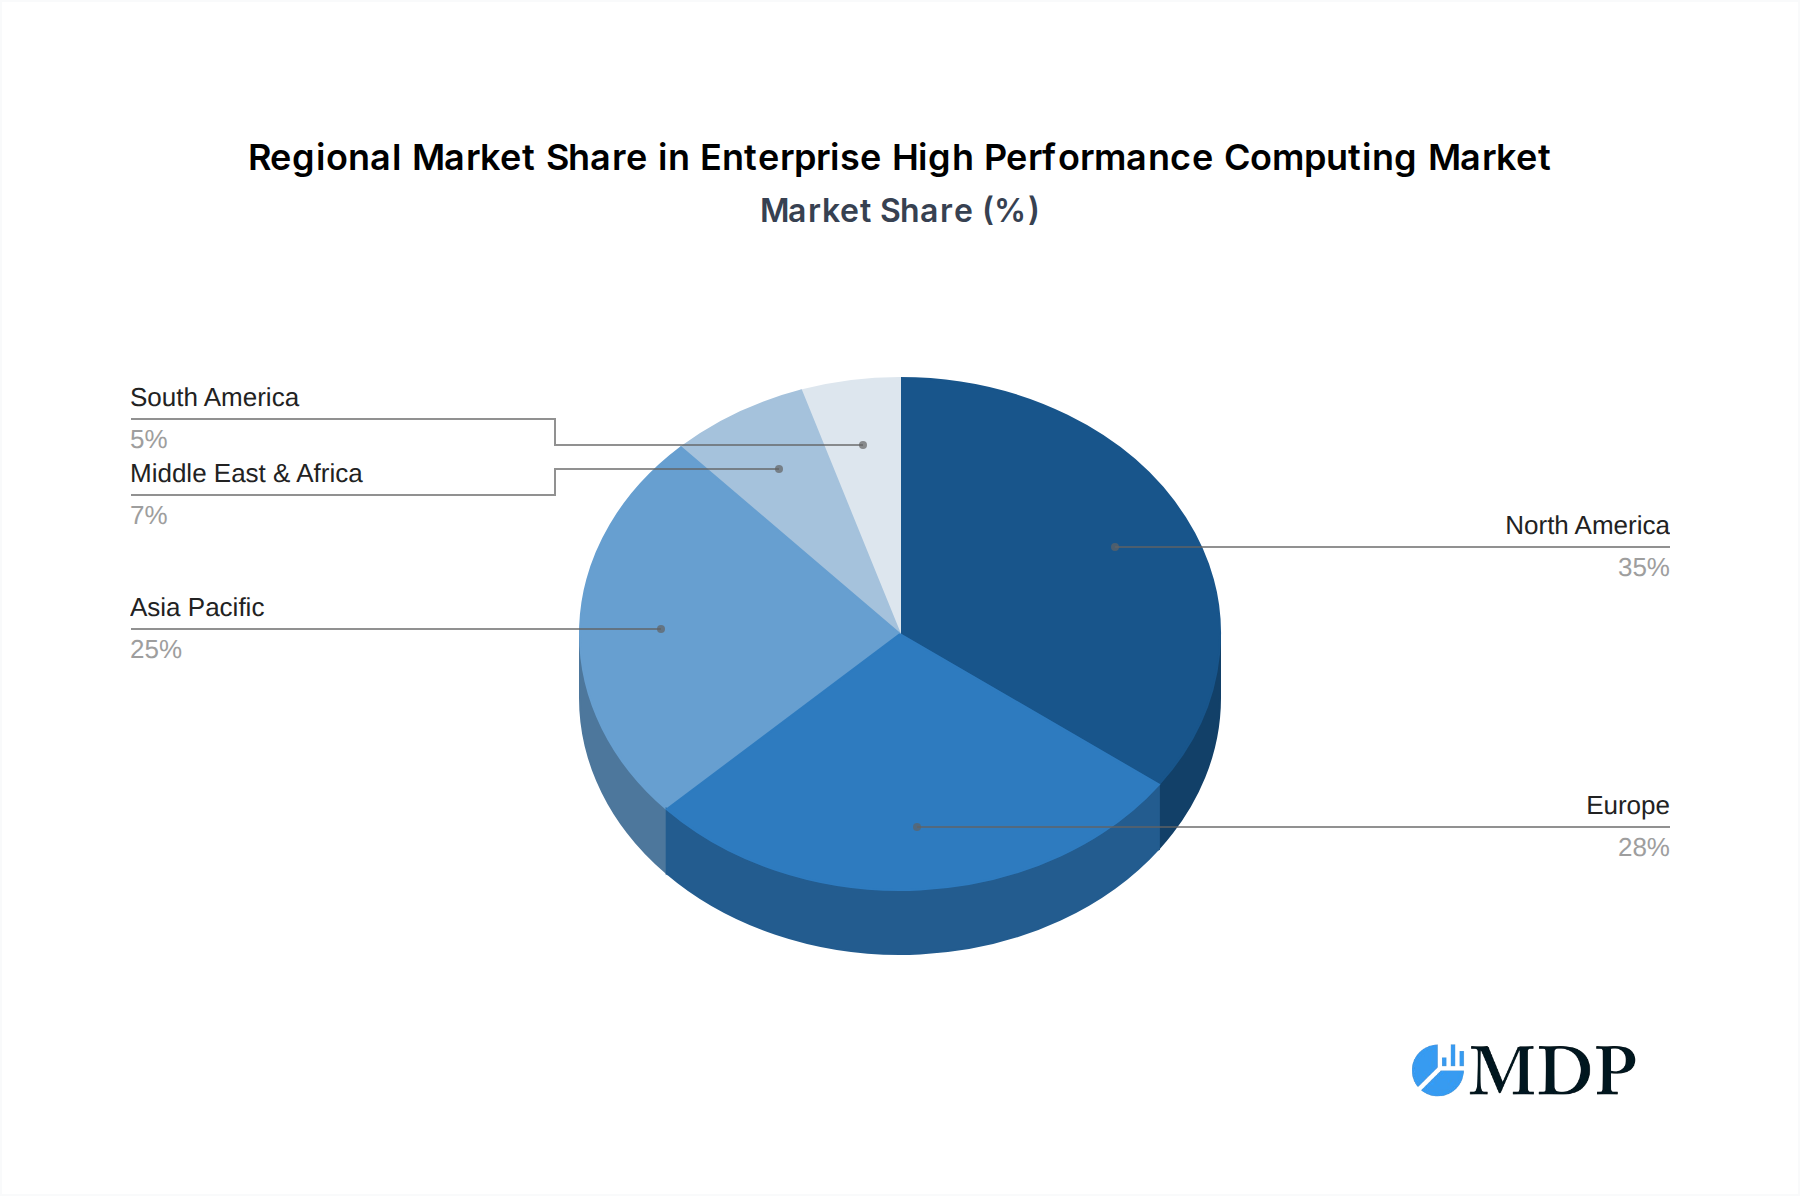
Enterprise High Performance Computing Regional Market Share
Geographic Coverage of Enterprise High Performance Computing
Enterprise High Performance Computing REPORT HIGHLIGHTS
| Aspects | Details |
|---|---|
| Study Period | 2020-2034 |
| Base Year | 2025 |
| Estimated Year | 2026 |
| Forecast Period | 2026-2034 |
| Historical Period | 2020-2025 |
| Growth Rate | CAGR of 3.2% from 2020-2034 |
| Segmentation |
|
Table of Contents
- 1. Introduction
- 1.1. Research Scope
- 1.2. Market Segmentation
- 1.3. Research Methodology
- 1.4. Definitions and Assumptions
- 2. Executive Summary
- 2.1. Introduction
- 3. Market Dynamics
- 3.1. Introduction
- 3.2. Market Drivers
- 3.3. Market Restrains
- 3.4. Market Trends
- 4. Market Factor Analysis
- 4.1. Porters Five Forces
- 4.2. Supply/Value Chain
- 4.3. PESTEL analysis
- 4.4. Market Entropy
- 4.5. Patent/Trademark Analysis
- 5. Global Enterprise High Performance Computing Analysis, Insights and Forecast, 2020-2032
- 5.1. Market Analysis, Insights and Forecast - by Application
- 5.1.1. Automotive
- 5.1.2. Manufacturing
- 5.1.3. Financial Services
- 5.1.4. Life Sciences
- 5.1.5. Oil and Gas
- 5.1.6. Others
- 5.2. Market Analysis, Insights and Forecast - by Types
- 5.2.1. On-Premise
- 5.2.2. Cloud Services
- 5.3. Market Analysis, Insights and Forecast - by Region
- 5.3.1. North America
- 5.3.2. South America
- 5.3.3. Europe
- 5.3.4. Middle East & Africa
- 5.3.5. Asia Pacific
- 5.1. Market Analysis, Insights and Forecast - by Application
- 6. North America Enterprise High Performance Computing Analysis, Insights and Forecast, 2020-2032
- 6.1. Market Analysis, Insights and Forecast - by Application
- 6.1.1. Automotive
- 6.1.2. Manufacturing
- 6.1.3. Financial Services
- 6.1.4. Life Sciences
- 6.1.5. Oil and Gas
- 6.1.6. Others
- 6.2. Market Analysis, Insights and Forecast - by Types
- 6.2.1. On-Premise
- 6.2.2. Cloud Services
- 6.1. Market Analysis, Insights and Forecast - by Application
- 7. South America Enterprise High Performance Computing Analysis, Insights and Forecast, 2020-2032
- 7.1. Market Analysis, Insights and Forecast - by Application
- 7.1.1. Automotive
- 7.1.2. Manufacturing
- 7.1.3. Financial Services
- 7.1.4. Life Sciences
- 7.1.5. Oil and Gas
- 7.1.6. Others
- 7.2. Market Analysis, Insights and Forecast - by Types
- 7.2.1. On-Premise
- 7.2.2. Cloud Services
- 7.1. Market Analysis, Insights and Forecast - by Application
- 8. Europe Enterprise High Performance Computing Analysis, Insights and Forecast, 2020-2032
- 8.1. Market Analysis, Insights and Forecast - by Application
- 8.1.1. Automotive
- 8.1.2. Manufacturing
- 8.1.3. Financial Services
- 8.1.4. Life Sciences
- 8.1.5. Oil and Gas
- 8.1.6. Others
- 8.2. Market Analysis, Insights and Forecast - by Types
- 8.2.1. On-Premise
- 8.2.2. Cloud Services
- 8.1. Market Analysis, Insights and Forecast - by Application
- 9. Middle East & Africa Enterprise High Performance Computing Analysis, Insights and Forecast, 2020-2032
- 9.1. Market Analysis, Insights and Forecast - by Application
- 9.1.1. Automotive
- 9.1.2. Manufacturing
- 9.1.3. Financial Services
- 9.1.4. Life Sciences
- 9.1.5. Oil and Gas
- 9.1.6. Others
- 9.2. Market Analysis, Insights and Forecast - by Types
- 9.2.1. On-Premise
- 9.2.2. Cloud Services
- 9.1. Market Analysis, Insights and Forecast - by Application
- 10. Asia Pacific Enterprise High Performance Computing Analysis, Insights and Forecast, 2020-2032
- 10.1. Market Analysis, Insights and Forecast - by Application
- 10.1.1. Automotive
- 10.1.2. Manufacturing
- 10.1.3. Financial Services
- 10.1.4. Life Sciences
- 10.1.5. Oil and Gas
- 10.1.6. Others
- 10.2. Market Analysis, Insights and Forecast - by Types
- 10.2.1. On-Premise
- 10.2.2. Cloud Services
- 10.1. Market Analysis, Insights and Forecast - by Application
- 11. Competitive Analysis
- 11.1. Global Market Share Analysis 2025
- 11.2. Company Profiles
- 11.2.1 Amazon
- 11.2.1.1. Overview
- 11.2.1.2. Products
- 11.2.1.3. SWOT Analysis
- 11.2.1.4. Recent Developments
- 11.2.1.5. Financials (Based on Availability)
- 11.2.2 Bright Computing
- 11.2.2.1. Overview
- 11.2.2.2. Products
- 11.2.2.3. SWOT Analysis
- 11.2.2.4. Recent Developments
- 11.2.2.5. Financials (Based on Availability)
- 11.2.3 Cray
- 11.2.3.1. Overview
- 11.2.3.2. Products
- 11.2.3.3. SWOT Analysis
- 11.2.3.4. Recent Developments
- 11.2.3.5. Financials (Based on Availability)
- 11.2.4 Dell EMC
- 11.2.4.1. Overview
- 11.2.4.2. Products
- 11.2.4.3. SWOT Analysis
- 11.2.4.4. Recent Developments
- 11.2.4.5. Financials (Based on Availability)
- 11.2.5 Ephesoft
- 11.2.5.1. Overview
- 11.2.5.2. Products
- 11.2.5.3. SWOT Analysis
- 11.2.5.4. Recent Developments
- 11.2.5.5. Financials (Based on Availability)
- 11.2.6 Hewlett Packard Enterprise
- 11.2.6.1. Overview
- 11.2.6.2. Products
- 11.2.6.3. SWOT Analysis
- 11.2.6.4. Recent Developments
- 11.2.6.5. Financials (Based on Availability)
- 11.2.7 IBM
- 11.2.7.1. Overview
- 11.2.7.2. Products
- 11.2.7.3. SWOT Analysis
- 11.2.7.4. Recent Developments
- 11.2.7.5. Financials (Based on Availability)
- 11.2.8 Lenovo
- 11.2.8.1. Overview
- 11.2.8.2. Products
- 11.2.8.3. SWOT Analysis
- 11.2.8.4. Recent Developments
- 11.2.8.5. Financials (Based on Availability)
- 11.2.9 Mellanox Technologies
- 11.2.9.1. Overview
- 11.2.9.2. Products
- 11.2.9.3. SWOT Analysis
- 11.2.9.4. Recent Developments
- 11.2.9.5. Financials (Based on Availability)
- 11.2.10 Microsoft
- 11.2.10.1. Overview
- 11.2.10.2. Products
- 11.2.10.3. SWOT Analysis
- 11.2.10.4. Recent Developments
- 11.2.10.5. Financials (Based on Availability)
- 11.2.11 Panasas
- 11.2.11.1. Overview
- 11.2.11.2. Products
- 11.2.11.3. SWOT Analysis
- 11.2.11.4. Recent Developments
- 11.2.11.5. Financials (Based on Availability)
- 11.2.12 Pure Storage
- 11.2.12.1. Overview
- 11.2.12.2. Products
- 11.2.12.3. SWOT Analysis
- 11.2.12.4. Recent Developments
- 11.2.12.5. Financials (Based on Availability)
- 11.2.13 Verne Global
- 11.2.13.1. Overview
- 11.2.13.2. Products
- 11.2.13.3. SWOT Analysis
- 11.2.13.4. Recent Developments
- 11.2.13.5. Financials (Based on Availability)
- 11.2.1 Amazon
List of Figures
- Figure 1: Global Enterprise High Performance Computing Revenue Breakdown (million, %) by Region 2025 & 2033
- Figure 2: North America Enterprise High Performance Computing Revenue (million), by Application 2025 & 2033
- Figure 3: North America Enterprise High Performance Computing Revenue Share (%), by Application 2025 & 2033
- Figure 4: North America Enterprise High Performance Computing Revenue (million), by Types 2025 & 2033
- Figure 5: North America Enterprise High Performance Computing Revenue Share (%), by Types 2025 & 2033
- Figure 6: North America Enterprise High Performance Computing Revenue (million), by Country 2025 & 2033
- Figure 7: North America Enterprise High Performance Computing Revenue Share (%), by Country 2025 & 2033
- Figure 8: South America Enterprise High Performance Computing Revenue (million), by Application 2025 & 2033
- Figure 9: South America Enterprise High Performance Computing Revenue Share (%), by Application 2025 & 2033
- Figure 10: South America Enterprise High Performance Computing Revenue (million), by Types 2025 & 2033
- Figure 11: South America Enterprise High Performance Computing Revenue Share (%), by Types 2025 & 2033
- Figure 12: South America Enterprise High Performance Computing Revenue (million), by Country 2025 & 2033
- Figure 13: South America Enterprise High Performance Computing Revenue Share (%), by Country 2025 & 2033
- Figure 14: Europe Enterprise High Performance Computing Revenue (million), by Application 2025 & 2033
- Figure 15: Europe Enterprise High Performance Computing Revenue Share (%), by Application 2025 & 2033
- Figure 16: Europe Enterprise High Performance Computing Revenue (million), by Types 2025 & 2033
- Figure 17: Europe Enterprise High Performance Computing Revenue Share (%), by Types 2025 & 2033
- Figure 18: Europe Enterprise High Performance Computing Revenue (million), by Country 2025 & 2033
- Figure 19: Europe Enterprise High Performance Computing Revenue Share (%), by Country 2025 & 2033
- Figure 20: Middle East & Africa Enterprise High Performance Computing Revenue (million), by Application 2025 & 2033
- Figure 21: Middle East & Africa Enterprise High Performance Computing Revenue Share (%), by Application 2025 & 2033
- Figure 22: Middle East & Africa Enterprise High Performance Computing Revenue (million), by Types 2025 & 2033
- Figure 23: Middle East & Africa Enterprise High Performance Computing Revenue Share (%), by Types 2025 & 2033
- Figure 24: Middle East & Africa Enterprise High Performance Computing Revenue (million), by Country 2025 & 2033
- Figure 25: Middle East & Africa Enterprise High Performance Computing Revenue Share (%), by Country 2025 & 2033
- Figure 26: Asia Pacific Enterprise High Performance Computing Revenue (million), by Application 2025 & 2033
- Figure 27: Asia Pacific Enterprise High Performance Computing Revenue Share (%), by Application 2025 & 2033
- Figure 28: Asia Pacific Enterprise High Performance Computing Revenue (million), by Types 2025 & 2033
- Figure 29: Asia Pacific Enterprise High Performance Computing Revenue Share (%), by Types 2025 & 2033
- Figure 30: Asia Pacific Enterprise High Performance Computing Revenue (million), by Country 2025 & 2033
- Figure 31: Asia Pacific Enterprise High Performance Computing Revenue Share (%), by Country 2025 & 2033
List of Tables
- Table 1: Global Enterprise High Performance Computing Revenue million Forecast, by Application 2020 & 2033
- Table 2: Global Enterprise High Performance Computing Revenue million Forecast, by Types 2020 & 2033
- Table 3: Global Enterprise High Performance Computing Revenue million Forecast, by Region 2020 & 2033
- Table 4: Global Enterprise High Performance Computing Revenue million Forecast, by Application 2020 & 2033
- Table 5: Global Enterprise High Performance Computing Revenue million Forecast, by Types 2020 & 2033
- Table 6: Global Enterprise High Performance Computing Revenue million Forecast, by Country 2020 & 2033
- Table 7: United States Enterprise High Performance Computing Revenue (million) Forecast, by Application 2020 & 2033
- Table 8: Canada Enterprise High Performance Computing Revenue (million) Forecast, by Application 2020 & 2033
- Table 9: Mexico Enterprise High Performance Computing Revenue (million) Forecast, by Application 2020 & 2033
- Table 10: Global Enterprise High Performance Computing Revenue million Forecast, by Application 2020 & 2033
- Table 11: Global Enterprise High Performance Computing Revenue million Forecast, by Types 2020 & 2033
- Table 12: Global Enterprise High Performance Computing Revenue million Forecast, by Country 2020 & 2033
- Table 13: Brazil Enterprise High Performance Computing Revenue (million) Forecast, by Application 2020 & 2033
- Table 14: Argentina Enterprise High Performance Computing Revenue (million) Forecast, by Application 2020 & 2033
- Table 15: Rest of South America Enterprise High Performance Computing Revenue (million) Forecast, by Application 2020 & 2033
- Table 16: Global Enterprise High Performance Computing Revenue million Forecast, by Application 2020 & 2033
- Table 17: Global Enterprise High Performance Computing Revenue million Forecast, by Types 2020 & 2033
- Table 18: Global Enterprise High Performance Computing Revenue million Forecast, by Country 2020 & 2033
- Table 19: United Kingdom Enterprise High Performance Computing Revenue (million) Forecast, by Application 2020 & 2033
- Table 20: Germany Enterprise High Performance Computing Revenue (million) Forecast, by Application 2020 & 2033
- Table 21: France Enterprise High Performance Computing Revenue (million) Forecast, by Application 2020 & 2033
- Table 22: Italy Enterprise High Performance Computing Revenue (million) Forecast, by Application 2020 & 2033
- Table 23: Spain Enterprise High Performance Computing Revenue (million) Forecast, by Application 2020 & 2033
- Table 24: Russia Enterprise High Performance Computing Revenue (million) Forecast, by Application 2020 & 2033
- Table 25: Benelux Enterprise High Performance Computing Revenue (million) Forecast, by Application 2020 & 2033
- Table 26: Nordics Enterprise High Performance Computing Revenue (million) Forecast, by Application 2020 & 2033
- Table 27: Rest of Europe Enterprise High Performance Computing Revenue (million) Forecast, by Application 2020 & 2033
- Table 28: Global Enterprise High Performance Computing Revenue million Forecast, by Application 2020 & 2033
- Table 29: Global Enterprise High Performance Computing Revenue million Forecast, by Types 2020 & 2033
- Table 30: Global Enterprise High Performance Computing Revenue million Forecast, by Country 2020 & 2033
- Table 31: Turkey Enterprise High Performance Computing Revenue (million) Forecast, by Application 2020 & 2033
- Table 32: Israel Enterprise High Performance Computing Revenue (million) Forecast, by Application 2020 & 2033
- Table 33: GCC Enterprise High Performance Computing Revenue (million) Forecast, by Application 2020 & 2033
- Table 34: North Africa Enterprise High Performance Computing Revenue (million) Forecast, by Application 2020 & 2033
- Table 35: South Africa Enterprise High Performance Computing Revenue (million) Forecast, by Application 2020 & 2033
- Table 36: Rest of Middle East & Africa Enterprise High Performance Computing Revenue (million) Forecast, by Application 2020 & 2033
- Table 37: Global Enterprise High Performance Computing Revenue million Forecast, by Application 2020 & 2033
- Table 38: Global Enterprise High Performance Computing Revenue million Forecast, by Types 2020 & 2033
- Table 39: Global Enterprise High Performance Computing Revenue million Forecast, by Country 2020 & 2033
- Table 40: China Enterprise High Performance Computing Revenue (million) Forecast, by Application 2020 & 2033
- Table 41: India Enterprise High Performance Computing Revenue (million) Forecast, by Application 2020 & 2033
- Table 42: Japan Enterprise High Performance Computing Revenue (million) Forecast, by Application 2020 & 2033
- Table 43: South Korea Enterprise High Performance Computing Revenue (million) Forecast, by Application 2020 & 2033
- Table 44: ASEAN Enterprise High Performance Computing Revenue (million) Forecast, by Application 2020 & 2033
- Table 45: Oceania Enterprise High Performance Computing Revenue (million) Forecast, by Application 2020 & 2033
- Table 46: Rest of Asia Pacific Enterprise High Performance Computing Revenue (million) Forecast, by Application 2020 & 2033
Frequently Asked Questions
1. What is the projected Compound Annual Growth Rate (CAGR) of the Enterprise High Performance Computing?
The projected CAGR is approximately 3.2%.
2. Which companies are prominent players in the Enterprise High Performance Computing?
Key companies in the market include Amazon, Bright Computing, Cray, Dell EMC, Ephesoft, Hewlett Packard Enterprise, IBM, Lenovo, Mellanox Technologies, Microsoft, Panasas, Pure Storage, Verne Global.
3. What are the main segments of the Enterprise High Performance Computing?
The market segments include Application, Types.
4. Can you provide details about the market size?
The market size is estimated to be USD 33150 million as of 2022.
5. What are some drivers contributing to market growth?
N/A
6. What are the notable trends driving market growth?
N/A
7. Are there any restraints impacting market growth?
N/A
8. Can you provide examples of recent developments in the market?
N/A
9. What pricing options are available for accessing the report?
Pricing options include single-user, multi-user, and enterprise licenses priced at USD 2900.00, USD 4350.00, and USD 5800.00 respectively.
10. Is the market size provided in terms of value or volume?
The market size is provided in terms of value, measured in million.
11. Are there any specific market keywords associated with the report?
Yes, the market keyword associated with the report is "Enterprise High Performance Computing," which aids in identifying and referencing the specific market segment covered.
12. How do I determine which pricing option suits my needs best?
The pricing options vary based on user requirements and access needs. Individual users may opt for single-user licenses, while businesses requiring broader access may choose multi-user or enterprise licenses for cost-effective access to the report.
13. Are there any additional resources or data provided in the Enterprise High Performance Computing report?
While the report offers comprehensive insights, it's advisable to review the specific contents or supplementary materials provided to ascertain if additional resources or data are available.
14. How can I stay updated on further developments or reports in the Enterprise High Performance Computing?
To stay informed about further developments, trends, and reports in the Enterprise High Performance Computing, consider subscribing to industry newsletters, following relevant companies and organizations, or regularly checking reputable industry news sources and publications.
Methodology
Step 1 - Identification of Relevant Samples Size from Population Database


Step 2 - Approaches for Defining Global Market Size (Value, Volume* & Price*)

Note*: In applicable scenarios
Step 3 - Data Sources
Primary Research
- Web Analytics
- Survey Reports
- Research Institute
- Latest Research Reports
- Opinion Leaders
Secondary Research
- Annual Reports
- White Paper
- Latest Press Release
- Industry Association
- Paid Database
- Investor Presentations

Step 4 - Data Triangulation
Involves using different sources of information in order to increase the validity of a study
These sources are likely to be stakeholders in a program - participants, other researchers, program staff, other community members, and so on.
Then we put all data in single framework & apply various statistical tools to find out the dynamic on the market.
During the analysis stage, feedback from the stakeholder groups would be compared to determine areas of agreement as well as areas of divergence