

Key Insights
The global Employee Survey Tool market is poised for substantial growth, projected to reach USD 14.98 billion in 2025. This expansion is driven by a growing organizational emphasis on employee engagement, feedback mechanisms, and data-driven HR strategies. Companies are increasingly recognizing the critical role of employee sentiment in boosting productivity, reducing turnover, and fostering a positive work culture. The Compound Annual Growth Rate (CAGR) of 7.63% underscores this robust upward trajectory, indicating sustained demand for sophisticated tools that facilitate the collection, analysis, and actioning of employee feedback. The market is characterized by a dynamic ecosystem of providers, offering solutions tailored to the diverse needs of both Small and Medium-sized Enterprises (SMEs) and large enterprises. This segmenting ensures accessibility and scalability, allowing organizations of all sizes to leverage employee survey insights for strategic decision-making and operational improvements.

Employee Survey Tool Market Size (In Billion)
The market's growth is further fueled by the increasing adoption of cloud-based solutions, offering flexibility, cost-effectiveness, and advanced analytical capabilities. While on-premises solutions continue to serve specific security or customization needs, the trend clearly favors cloud deployment. Key market drivers include the need for enhanced employee retention, the pursuit of a competitive employer brand, and the imperative to comply with evolving workplace regulations and employee well-being standards. While challenges such as data privacy concerns and the risk of survey fatigue exist, the pervasive understanding of employee feedback as a strategic asset is expected to outweigh these restraints. The market is witnessing innovation in areas like sentiment analysis, AI-powered insights, and integration with other HR platforms, promising even more sophisticated and actionable outcomes for organizations investing in employee survey tools.

Employee Survey Tool Company Market Share
Employee Survey Tool Market: Comprehensive Analysis and Future Outlook (2019–2033)
This in-depth report provides a definitive analysis of the global Employee Survey Tool market, offering critical insights into its dynamics, trends, and future trajectory. Covering the Study Period (2019–2033), with a Base Year of 2025 and Forecast Period (2025–2033), this report is an indispensable resource for stakeholders seeking to understand and capitalize on market opportunities. We analyze the competitive landscape, technological advancements, and evolving end-user needs, providing actionable intelligence for businesses operating within or looking to enter this burgeoning sector. This report is tailored for SMEs and Large Enterprises, examining both Cloud-based and On-premises deployment types.
Employee Survey Tool Market Dynamics & Concentration
The Employee Survey Tool market is characterized by a moderate to high level of concentration, driven by a mix of established players and emerging innovators. The innovation drivers are primarily centered around enhancing data analytics capabilities, improving user experience, and integrating advanced AI for sentiment analysis and predictive insights. Regulatory frameworks, particularly concerning data privacy and employee well-being, are increasingly shaping market strategies, compelling vendors to prioritize robust security measures and compliance certifications. Product substitutes, such as direct feedback mechanisms, one-on-one meetings, and internal communication platforms, exert some pressure, but dedicated employee survey tools offer superior depth and analytical power for engagement and performance monitoring. End-user trends reveal a growing demand for continuous feedback, personalized employee experiences, and data-driven HR decision-making. Merger and acquisition (M&A) activities are a significant feature, with approximately 500 M&A deals recorded between 2019 and 2024, indicating a trend towards consolidation and the acquisition of innovative technologies. Leading players like SurveyMonkey and Qualtrics XM hold substantial market shares, estimated at 15% and 12% respectively, with a combined market share of over 25% among the top 5 companies.
Employee Survey Tool Industry Trends & Analysis
The Employee Survey Tool industry is poised for robust growth, projected to expand at a Compound Annual Growth Rate (CAGR) of approximately 15% from 2025 to 2033. This expansion is fueled by several key market growth drivers, including the escalating recognition of employee engagement as a critical factor for organizational success and the increasing adoption of hybrid and remote work models, necessitating new avenues for feedback and connection. Technological disruptions are at the forefront, with AI and machine learning significantly enhancing survey design, data analysis, and personalized reporting. Advanced Natural Language Processing (NLP) enables deeper qualitative insights from open-ended responses, while predictive analytics helps identify potential retention risks. Consumer preferences are shifting towards more intuitive, mobile-first survey experiences and the integration of survey data with other HR platforms for a holistic employee view. Competitive dynamics are intense, with a constant drive for feature differentiation, including advanced analytics, real-time reporting, and seamless integration capabilities. Market penetration is steadily increasing, with an estimated 60% of large enterprises and 40% of SMEs currently utilizing some form of employee survey tools by 2025, a figure expected to rise to over 80% for large enterprises and 65% for SMEs by 2033.
Leading Markets & Segments in Employee Survey Tool
North America, particularly the United States, represents the dominant region in the Employee Survey Tool market, accounting for an estimated 45% of the global market share in 2025. This dominance is driven by a strong economy, a mature HR technology landscape, and a high adoption rate of advanced analytics and employee engagement initiatives. Within North America, the United States is the leading country, with a market share estimated at 35%.
Application Segment Dominance:
- Large Enterprises: This segment holds the largest market share, estimated at 60% in 2025, due to their larger employee base, more complex organizational structures, and greater budget allocation for HR technology. Key drivers include the need for comprehensive talent management, performance improvement, and compliance.
- SMEs: While smaller in individual spend, the sheer volume of SMEs makes this a rapidly growing segment, projected to grow at a CAGR of 18%. The increasing affordability and accessibility of cloud-based solutions are key accelerators.
Type Segment Dominance:
- Cloud-based: This segment overwhelmingly dominates, accounting for an estimated 85% of the market in 2025 and projected to grow to 90% by 2033. The key drivers include scalability, cost-effectiveness, ease of deployment, and continuous updates without significant IT overhead.
- On-premises: This segment is gradually declining, with an estimated 15% market share in 2025, expected to reduce to 10% by 2033. Its adoption is primarily limited to organizations with highly stringent data security and regulatory requirements that mandate local data storage.
Employee Survey Tool Product Developments
Product developments in the Employee Survey Tool market are increasingly focused on AI-powered analytics, seamless integration with HRIS, and advanced reporting dashboards. Innovations like sentiment analysis through Natural Language Processing (NLP) provide deeper insights into employee feedback, while gamified survey experiences are being introduced to boost participation rates. Platforms are also emphasizing continuous feedback loops, moving beyond annual surveys to enable real-time pulse checks and performance management. Competitive advantages are being built on the breadth of integrations, the depth of customizable analytics, and the ease of use for both administrators and respondents. The market is witnessing a convergence of survey capabilities with broader employee experience platforms.
Key Drivers of Employee Survey Tool Growth
The Employee Survey Tool market's growth is propelled by several interconnected factors. Technologically, the maturation of AI and machine learning for sophisticated data analysis and predictive insights is a significant driver. Economically, the increasing recognition of employee engagement as a key differentiator for business success, leading to higher HR budgets, fuels demand. Regulatory factors, such as evolving labor laws and the growing emphasis on employee well-being and mental health, also necessitate robust feedback mechanisms. For instance, compliance with new data privacy regulations, like GDPR and CCPA, encourages the use of secure and compliant survey tools. The shift towards remote and hybrid work environments further amplifies the need for digital tools to maintain connection and gather feedback.
Challenges in the Employee Survey Tool Market
Despite robust growth, the Employee Survey Tool market faces certain challenges. Regulatory hurdles, particularly regarding data privacy and security, require continuous investment in compliance and can slow down adoption for organizations with complex global operations. Supply chain issues, while less direct for software, can impact hardware integrations or the availability of support services. Competitive pressures are intense, leading to price sensitivity and demanding constant innovation. Overcoming survey fatigue among employees, where respondents become desensitized to frequent surveys, remains a critical operational challenge for effective data collection. Ensuring data accuracy and mitigating bias in survey design also present ongoing technical and methodological challenges.
Emerging Opportunities in Employee Survey Tool
Catalysts driving long-term growth in the Employee Survey Tool market include several promising avenues. Technological breakthroughs in AI, particularly in areas like predictive analytics for employee churn and personalized feedback analysis, will unlock new levels of insight. Strategic partnerships between survey tool providers and other HR technology companies (e.g., HRIS, performance management, learning management systems) will create integrated ecosystems, offering comprehensive employee experience solutions. Market expansion strategies, including targeting emerging economies and developing niche solutions for specific industries or employee demographics, represent significant growth potential. The increasing focus on Diversity, Equity, and Inclusion (DEI) will also drive demand for specialized survey tools to measure and improve these critical areas.
Leading Players in the Employee Survey Tool Sector
- Connecteam
- SurveyMonkey
- Monday.com
- Nfield
- Zoho Survey
- SurveyLegend
- Google Forms
- Trakstar
- Culture Amp
- SurveyLab
- TINYpulse Engage
- Startquestion
- Qualtrics XM
- ChartHop
- Betterworks
- SHRM
- DeskAlerts
Key Milestones in Employee Survey Tool Industry
- 2019: Increased adoption of AI in survey analytics for sentiment analysis.
- 2020: Surge in demand for remote work engagement surveys due to the COVID-19 pandemic.
- 2021: Enhanced integration capabilities with broader HR tech stacks become a key differentiator.
- 2022: Focus on continuous feedback and real-time pulse surveys gains significant traction.
- 2023: Development of specialized DEI (Diversity, Equity, and Inclusion) survey modules.
- 2024: Increased investment in predictive analytics for employee retention and engagement forecasting.
Strategic Outlook for Employee Survey Tool Market
The strategic outlook for the Employee Survey Tool market is highly optimistic, driven by an ongoing digital transformation in HR and a sustained focus on employee experience. Growth accelerators will include the deeper integration of AI for predictive and prescriptive analytics, enabling organizations to proactively address employee concerns. The expansion of the market into emerging economies and the development of industry-specific solutions will broaden its reach. Furthermore, the convergence of employee survey tools with broader employee engagement and experience platforms will create a more holistic and impactful offering. Strategic partnerships and potential M&A activities will continue to shape the competitive landscape, driving innovation and market consolidation. The increasing emphasis on data-driven decision-making in HR ensures a robust future for sophisticated employee survey solutions.
Employee Survey Tool Segmentation
-
1. Application
- 1.1. SMEs
- 1.2. Large Enterprises
-
2. Types
- 2.1. Cloud-based
- 2.2. On-premises
Employee Survey Tool Segmentation By Geography
-
1. North America
- 1.1. United States
- 1.2. Canada
- 1.3. Mexico
-
2. South America
- 2.1. Brazil
- 2.2. Argentina
- 2.3. Rest of South America
-
3. Europe
- 3.1. United Kingdom
- 3.2. Germany
- 3.3. France
- 3.4. Italy
- 3.5. Spain
- 3.6. Russia
- 3.7. Benelux
- 3.8. Nordics
- 3.9. Rest of Europe
-
4. Middle East & Africa
- 4.1. Turkey
- 4.2. Israel
- 4.3. GCC
- 4.4. North Africa
- 4.5. South Africa
- 4.6. Rest of Middle East & Africa
-
5. Asia Pacific
- 5.1. China
- 5.2. India
- 5.3. Japan
- 5.4. South Korea
- 5.5. ASEAN
- 5.6. Oceania
- 5.7. Rest of Asia Pacific
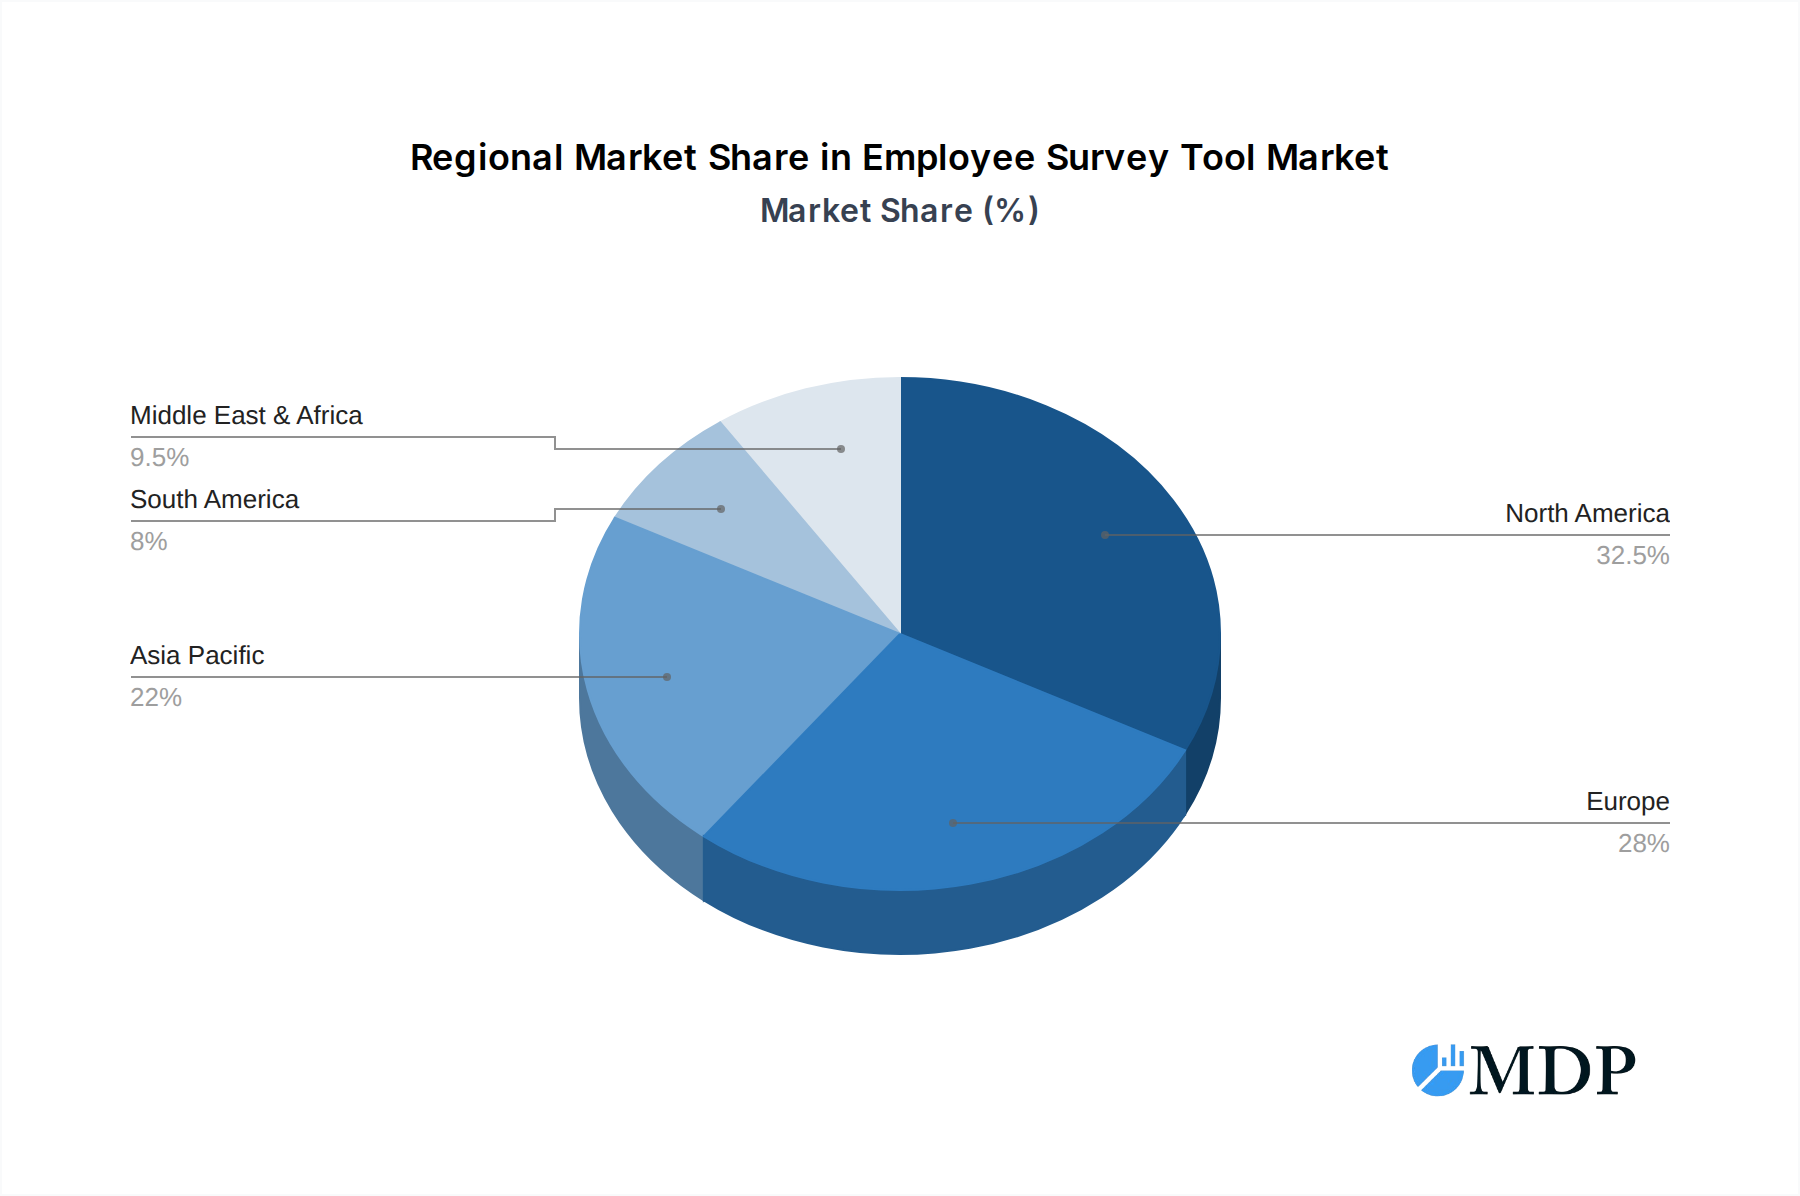
Employee Survey Tool Regional Market Share
Geographic Coverage of Employee Survey Tool
Employee Survey Tool REPORT HIGHLIGHTS
| Aspects | Details |
|---|---|
| Study Period | 2020-2034 |
| Base Year | 2025 |
| Estimated Year | 2026 |
| Forecast Period | 2026-2034 |
| Historical Period | 2020-2025 |
| Growth Rate | CAGR of 7.63% from 2020-2034 |
| Segmentation |
|
Table of Contents
- 1. Introduction
- 1.1. Research Scope
- 1.2. Market Segmentation
- 1.3. Research Methodology
- 1.4. Definitions and Assumptions
- 2. Executive Summary
- 2.1. Introduction
- 3. Market Dynamics
- 3.1. Introduction
- 3.2. Market Drivers
- 3.3. Market Restrains
- 3.4. Market Trends
- 4. Market Factor Analysis
- 4.1. Porters Five Forces
- 4.2. Supply/Value Chain
- 4.3. PESTEL analysis
- 4.4. Market Entropy
- 4.5. Patent/Trademark Analysis
- 5. Global Employee Survey Tool Analysis, Insights and Forecast, 2020-2032
- 5.1. Market Analysis, Insights and Forecast - by Application
- 5.1.1. SMEs
- 5.1.2. Large Enterprises
- 5.2. Market Analysis, Insights and Forecast - by Types
- 5.2.1. Cloud-based
- 5.2.2. On-premises
- 5.3. Market Analysis, Insights and Forecast - by Region
- 5.3.1. North America
- 5.3.2. South America
- 5.3.3. Europe
- 5.3.4. Middle East & Africa
- 5.3.5. Asia Pacific
- 5.1. Market Analysis, Insights and Forecast - by Application
- 6. North America Employee Survey Tool Analysis, Insights and Forecast, 2020-2032
- 6.1. Market Analysis, Insights and Forecast - by Application
- 6.1.1. SMEs
- 6.1.2. Large Enterprises
- 6.2. Market Analysis, Insights and Forecast - by Types
- 6.2.1. Cloud-based
- 6.2.2. On-premises
- 6.1. Market Analysis, Insights and Forecast - by Application
- 7. South America Employee Survey Tool Analysis, Insights and Forecast, 2020-2032
- 7.1. Market Analysis, Insights and Forecast - by Application
- 7.1.1. SMEs
- 7.1.2. Large Enterprises
- 7.2. Market Analysis, Insights and Forecast - by Types
- 7.2.1. Cloud-based
- 7.2.2. On-premises
- 7.1. Market Analysis, Insights and Forecast - by Application
- 8. Europe Employee Survey Tool Analysis, Insights and Forecast, 2020-2032
- 8.1. Market Analysis, Insights and Forecast - by Application
- 8.1.1. SMEs
- 8.1.2. Large Enterprises
- 8.2. Market Analysis, Insights and Forecast - by Types
- 8.2.1. Cloud-based
- 8.2.2. On-premises
- 8.1. Market Analysis, Insights and Forecast - by Application
- 9. Middle East & Africa Employee Survey Tool Analysis, Insights and Forecast, 2020-2032
- 9.1. Market Analysis, Insights and Forecast - by Application
- 9.1.1. SMEs
- 9.1.2. Large Enterprises
- 9.2. Market Analysis, Insights and Forecast - by Types
- 9.2.1. Cloud-based
- 9.2.2. On-premises
- 9.1. Market Analysis, Insights and Forecast - by Application
- 10. Asia Pacific Employee Survey Tool Analysis, Insights and Forecast, 2020-2032
- 10.1. Market Analysis, Insights and Forecast - by Application
- 10.1.1. SMEs
- 10.1.2. Large Enterprises
- 10.2. Market Analysis, Insights and Forecast - by Types
- 10.2.1. Cloud-based
- 10.2.2. On-premises
- 10.1. Market Analysis, Insights and Forecast - by Application
- 11. Competitive Analysis
- 11.1. Global Market Share Analysis 2025
- 11.2. Company Profiles
- 11.2.1 Connecteam
- 11.2.1.1. Overview
- 11.2.1.2. Products
- 11.2.1.3. SWOT Analysis
- 11.2.1.4. Recent Developments
- 11.2.1.5. Financials (Based on Availability)
- 11.2.2 SurveyMonkey
- 11.2.2.1. Overview
- 11.2.2.2. Products
- 11.2.2.3. SWOT Analysis
- 11.2.2.4. Recent Developments
- 11.2.2.5. Financials (Based on Availability)
- 11.2.3 Monday.com
- 11.2.3.1. Overview
- 11.2.3.2. Products
- 11.2.3.3. SWOT Analysis
- 11.2.3.4. Recent Developments
- 11.2.3.5. Financials (Based on Availability)
- 11.2.4 Nfield
- 11.2.4.1. Overview
- 11.2.4.2. Products
- 11.2.4.3. SWOT Analysis
- 11.2.4.4. Recent Developments
- 11.2.4.5. Financials (Based on Availability)
- 11.2.5 Zoho Survey
- 11.2.5.1. Overview
- 11.2.5.2. Products
- 11.2.5.3. SWOT Analysis
- 11.2.5.4. Recent Developments
- 11.2.5.5. Financials (Based on Availability)
- 11.2.6 SurveyLegend
- 11.2.6.1. Overview
- 11.2.6.2. Products
- 11.2.6.3. SWOT Analysis
- 11.2.6.4. Recent Developments
- 11.2.6.5. Financials (Based on Availability)
- 11.2.7 Google Forms
- 11.2.7.1. Overview
- 11.2.7.2. Products
- 11.2.7.3. SWOT Analysis
- 11.2.7.4. Recent Developments
- 11.2.7.5. Financials (Based on Availability)
- 11.2.8 Trakstar
- 11.2.8.1. Overview
- 11.2.8.2. Products
- 11.2.8.3. SWOT Analysis
- 11.2.8.4. Recent Developments
- 11.2.8.5. Financials (Based on Availability)
- 11.2.9 Culture Amp
- 11.2.9.1. Overview
- 11.2.9.2. Products
- 11.2.9.3. SWOT Analysis
- 11.2.9.4. Recent Developments
- 11.2.9.5. Financials (Based on Availability)
- 11.2.10 SurveyLab
- 11.2.10.1. Overview
- 11.2.10.2. Products
- 11.2.10.3. SWOT Analysis
- 11.2.10.4. Recent Developments
- 11.2.10.5. Financials (Based on Availability)
- 11.2.11 TINYpulse Engage
- 11.2.11.1. Overview
- 11.2.11.2. Products
- 11.2.11.3. SWOT Analysis
- 11.2.11.4. Recent Developments
- 11.2.11.5. Financials (Based on Availability)
- 11.2.12 Startquestion
- 11.2.12.1. Overview
- 11.2.12.2. Products
- 11.2.12.3. SWOT Analysis
- 11.2.12.4. Recent Developments
- 11.2.12.5. Financials (Based on Availability)
- 11.2.13 Qualtrics XM
- 11.2.13.1. Overview
- 11.2.13.2. Products
- 11.2.13.3. SWOT Analysis
- 11.2.13.4. Recent Developments
- 11.2.13.5. Financials (Based on Availability)
- 11.2.14 ChartHop
- 11.2.14.1. Overview
- 11.2.14.2. Products
- 11.2.14.3. SWOT Analysis
- 11.2.14.4. Recent Developments
- 11.2.14.5. Financials (Based on Availability)
- 11.2.15 Betterworks
- 11.2.15.1. Overview
- 11.2.15.2. Products
- 11.2.15.3. SWOT Analysis
- 11.2.15.4. Recent Developments
- 11.2.15.5. Financials (Based on Availability)
- 11.2.16 SHRM
- 11.2.16.1. Overview
- 11.2.16.2. Products
- 11.2.16.3. SWOT Analysis
- 11.2.16.4. Recent Developments
- 11.2.16.5. Financials (Based on Availability)
- 11.2.17 DeskAlerts
- 11.2.17.1. Overview
- 11.2.17.2. Products
- 11.2.17.3. SWOT Analysis
- 11.2.17.4. Recent Developments
- 11.2.17.5. Financials (Based on Availability)
- 11.2.1 Connecteam
List of Figures
- Figure 1: Global Employee Survey Tool Revenue Breakdown (billion, %) by Region 2025 & 2033
- Figure 2: North America Employee Survey Tool Revenue (billion), by Application 2025 & 2033
- Figure 3: North America Employee Survey Tool Revenue Share (%), by Application 2025 & 2033
- Figure 4: North America Employee Survey Tool Revenue (billion), by Types 2025 & 2033
- Figure 5: North America Employee Survey Tool Revenue Share (%), by Types 2025 & 2033
- Figure 6: North America Employee Survey Tool Revenue (billion), by Country 2025 & 2033
- Figure 7: North America Employee Survey Tool Revenue Share (%), by Country 2025 & 2033
- Figure 8: South America Employee Survey Tool Revenue (billion), by Application 2025 & 2033
- Figure 9: South America Employee Survey Tool Revenue Share (%), by Application 2025 & 2033
- Figure 10: South America Employee Survey Tool Revenue (billion), by Types 2025 & 2033
- Figure 11: South America Employee Survey Tool Revenue Share (%), by Types 2025 & 2033
- Figure 12: South America Employee Survey Tool Revenue (billion), by Country 2025 & 2033
- Figure 13: South America Employee Survey Tool Revenue Share (%), by Country 2025 & 2033
- Figure 14: Europe Employee Survey Tool Revenue (billion), by Application 2025 & 2033
- Figure 15: Europe Employee Survey Tool Revenue Share (%), by Application 2025 & 2033
- Figure 16: Europe Employee Survey Tool Revenue (billion), by Types 2025 & 2033
- Figure 17: Europe Employee Survey Tool Revenue Share (%), by Types 2025 & 2033
- Figure 18: Europe Employee Survey Tool Revenue (billion), by Country 2025 & 2033
- Figure 19: Europe Employee Survey Tool Revenue Share (%), by Country 2025 & 2033
- Figure 20: Middle East & Africa Employee Survey Tool Revenue (billion), by Application 2025 & 2033
- Figure 21: Middle East & Africa Employee Survey Tool Revenue Share (%), by Application 2025 & 2033
- Figure 22: Middle East & Africa Employee Survey Tool Revenue (billion), by Types 2025 & 2033
- Figure 23: Middle East & Africa Employee Survey Tool Revenue Share (%), by Types 2025 & 2033
- Figure 24: Middle East & Africa Employee Survey Tool Revenue (billion), by Country 2025 & 2033
- Figure 25: Middle East & Africa Employee Survey Tool Revenue Share (%), by Country 2025 & 2033
- Figure 26: Asia Pacific Employee Survey Tool Revenue (billion), by Application 2025 & 2033
- Figure 27: Asia Pacific Employee Survey Tool Revenue Share (%), by Application 2025 & 2033
- Figure 28: Asia Pacific Employee Survey Tool Revenue (billion), by Types 2025 & 2033
- Figure 29: Asia Pacific Employee Survey Tool Revenue Share (%), by Types 2025 & 2033
- Figure 30: Asia Pacific Employee Survey Tool Revenue (billion), by Country 2025 & 2033
- Figure 31: Asia Pacific Employee Survey Tool Revenue Share (%), by Country 2025 & 2033
List of Tables
- Table 1: Global Employee Survey Tool Revenue billion Forecast, by Application 2020 & 2033
- Table 2: Global Employee Survey Tool Revenue billion Forecast, by Types 2020 & 2033
- Table 3: Global Employee Survey Tool Revenue billion Forecast, by Region 2020 & 2033
- Table 4: Global Employee Survey Tool Revenue billion Forecast, by Application 2020 & 2033
- Table 5: Global Employee Survey Tool Revenue billion Forecast, by Types 2020 & 2033
- Table 6: Global Employee Survey Tool Revenue billion Forecast, by Country 2020 & 2033
- Table 7: United States Employee Survey Tool Revenue (billion) Forecast, by Application 2020 & 2033
- Table 8: Canada Employee Survey Tool Revenue (billion) Forecast, by Application 2020 & 2033
- Table 9: Mexico Employee Survey Tool Revenue (billion) Forecast, by Application 2020 & 2033
- Table 10: Global Employee Survey Tool Revenue billion Forecast, by Application 2020 & 2033
- Table 11: Global Employee Survey Tool Revenue billion Forecast, by Types 2020 & 2033
- Table 12: Global Employee Survey Tool Revenue billion Forecast, by Country 2020 & 2033
- Table 13: Brazil Employee Survey Tool Revenue (billion) Forecast, by Application 2020 & 2033
- Table 14: Argentina Employee Survey Tool Revenue (billion) Forecast, by Application 2020 & 2033
- Table 15: Rest of South America Employee Survey Tool Revenue (billion) Forecast, by Application 2020 & 2033
- Table 16: Global Employee Survey Tool Revenue billion Forecast, by Application 2020 & 2033
- Table 17: Global Employee Survey Tool Revenue billion Forecast, by Types 2020 & 2033
- Table 18: Global Employee Survey Tool Revenue billion Forecast, by Country 2020 & 2033
- Table 19: United Kingdom Employee Survey Tool Revenue (billion) Forecast, by Application 2020 & 2033
- Table 20: Germany Employee Survey Tool Revenue (billion) Forecast, by Application 2020 & 2033
- Table 21: France Employee Survey Tool Revenue (billion) Forecast, by Application 2020 & 2033
- Table 22: Italy Employee Survey Tool Revenue (billion) Forecast, by Application 2020 & 2033
- Table 23: Spain Employee Survey Tool Revenue (billion) Forecast, by Application 2020 & 2033
- Table 24: Russia Employee Survey Tool Revenue (billion) Forecast, by Application 2020 & 2033
- Table 25: Benelux Employee Survey Tool Revenue (billion) Forecast, by Application 2020 & 2033
- Table 26: Nordics Employee Survey Tool Revenue (billion) Forecast, by Application 2020 & 2033
- Table 27: Rest of Europe Employee Survey Tool Revenue (billion) Forecast, by Application 2020 & 2033
- Table 28: Global Employee Survey Tool Revenue billion Forecast, by Application 2020 & 2033
- Table 29: Global Employee Survey Tool Revenue billion Forecast, by Types 2020 & 2033
- Table 30: Global Employee Survey Tool Revenue billion Forecast, by Country 2020 & 2033
- Table 31: Turkey Employee Survey Tool Revenue (billion) Forecast, by Application 2020 & 2033
- Table 32: Israel Employee Survey Tool Revenue (billion) Forecast, by Application 2020 & 2033
- Table 33: GCC Employee Survey Tool Revenue (billion) Forecast, by Application 2020 & 2033
- Table 34: North Africa Employee Survey Tool Revenue (billion) Forecast, by Application 2020 & 2033
- Table 35: South Africa Employee Survey Tool Revenue (billion) Forecast, by Application 2020 & 2033
- Table 36: Rest of Middle East & Africa Employee Survey Tool Revenue (billion) Forecast, by Application 2020 & 2033
- Table 37: Global Employee Survey Tool Revenue billion Forecast, by Application 2020 & 2033
- Table 38: Global Employee Survey Tool Revenue billion Forecast, by Types 2020 & 2033
- Table 39: Global Employee Survey Tool Revenue billion Forecast, by Country 2020 & 2033
- Table 40: China Employee Survey Tool Revenue (billion) Forecast, by Application 2020 & 2033
- Table 41: India Employee Survey Tool Revenue (billion) Forecast, by Application 2020 & 2033
- Table 42: Japan Employee Survey Tool Revenue (billion) Forecast, by Application 2020 & 2033
- Table 43: South Korea Employee Survey Tool Revenue (billion) Forecast, by Application 2020 & 2033
- Table 44: ASEAN Employee Survey Tool Revenue (billion) Forecast, by Application 2020 & 2033
- Table 45: Oceania Employee Survey Tool Revenue (billion) Forecast, by Application 2020 & 2033
- Table 46: Rest of Asia Pacific Employee Survey Tool Revenue (billion) Forecast, by Application 2020 & 2033
Frequently Asked Questions
1. What is the projected Compound Annual Growth Rate (CAGR) of the Employee Survey Tool?
The projected CAGR is approximately 7.63%.
2. Which companies are prominent players in the Employee Survey Tool?
Key companies in the market include Connecteam, SurveyMonkey, Monday.com, Nfield, Zoho Survey, SurveyLegend, Google Forms, Trakstar, Culture Amp, SurveyLab, TINYpulse Engage, Startquestion, Qualtrics XM, ChartHop, Betterworks, SHRM, DeskAlerts.
3. What are the main segments of the Employee Survey Tool?
The market segments include Application, Types.
4. Can you provide details about the market size?
The market size is estimated to be USD 14.98 billion as of 2022.
5. What are some drivers contributing to market growth?
N/A
6. What are the notable trends driving market growth?
N/A
7. Are there any restraints impacting market growth?
N/A
8. Can you provide examples of recent developments in the market?
N/A
9. What pricing options are available for accessing the report?
Pricing options include single-user, multi-user, and enterprise licenses priced at USD 4900.00, USD 7350.00, and USD 9800.00 respectively.
10. Is the market size provided in terms of value or volume?
The market size is provided in terms of value, measured in billion.
11. Are there any specific market keywords associated with the report?
Yes, the market keyword associated with the report is "Employee Survey Tool," which aids in identifying and referencing the specific market segment covered.
12. How do I determine which pricing option suits my needs best?
The pricing options vary based on user requirements and access needs. Individual users may opt for single-user licenses, while businesses requiring broader access may choose multi-user or enterprise licenses for cost-effective access to the report.
13. Are there any additional resources or data provided in the Employee Survey Tool report?
While the report offers comprehensive insights, it's advisable to review the specific contents or supplementary materials provided to ascertain if additional resources or data are available.
14. How can I stay updated on further developments or reports in the Employee Survey Tool?
To stay informed about further developments, trends, and reports in the Employee Survey Tool, consider subscribing to industry newsletters, following relevant companies and organizations, or regularly checking reputable industry news sources and publications.
Methodology
Step 1 - Identification of Relevant Samples Size from Population Database


Step 2 - Approaches for Defining Global Market Size (Value, Volume* & Price*)

Note*: In applicable scenarios
Step 3 - Data Sources
Primary Research
- Web Analytics
- Survey Reports
- Research Institute
- Latest Research Reports
- Opinion Leaders
Secondary Research
- Annual Reports
- White Paper
- Latest Press Release
- Industry Association
- Paid Database
- Investor Presentations

Step 4 - Data Triangulation
Involves using different sources of information in order to increase the validity of a study
These sources are likely to be stakeholders in a program - participants, other researchers, program staff, other community members, and so on.
Then we put all data in single framework & apply various statistical tools to find out the dynamic on the market.
During the analysis stage, feedback from the stakeholder groups would be compared to determine areas of agreement as well as areas of divergence