

Key Insights
The global market for Electromagnetic Stimulation Therapy Apparatus is experiencing robust growth, driven by rising prevalence of neurological and musculoskeletal disorders, technological advancements leading to improved efficacy and safety profiles, and increasing awareness among patients and healthcare professionals. The market, currently valued at approximately $2.5 billion in 2025, is projected to exhibit a Compound Annual Growth Rate (CAGR) of around 8% from 2025 to 2033, reaching an estimated market size of $4.5 billion by 2033. This growth is fueled by several key factors including the increasing adoption of minimally invasive procedures, the development of personalized treatment approaches targeting specific patient needs, and reimbursement policy changes that support wider access to these therapies. Leading companies like Medtronic, Abbott Laboratories, and Boston Scientific are driving innovation and market expansion through continuous research and development, strategic partnerships, and mergers and acquisitions. The market is segmented by application (neuromodulation, pain management, and others), device type, and end-user (hospitals, clinics, and homecare settings). Competitive pressures and the potential for regulatory hurdles pose some challenges, but the overall market outlook remains positive, given the continued unmet medical needs and the potential for expanded applications of electromagnetic stimulation technology.
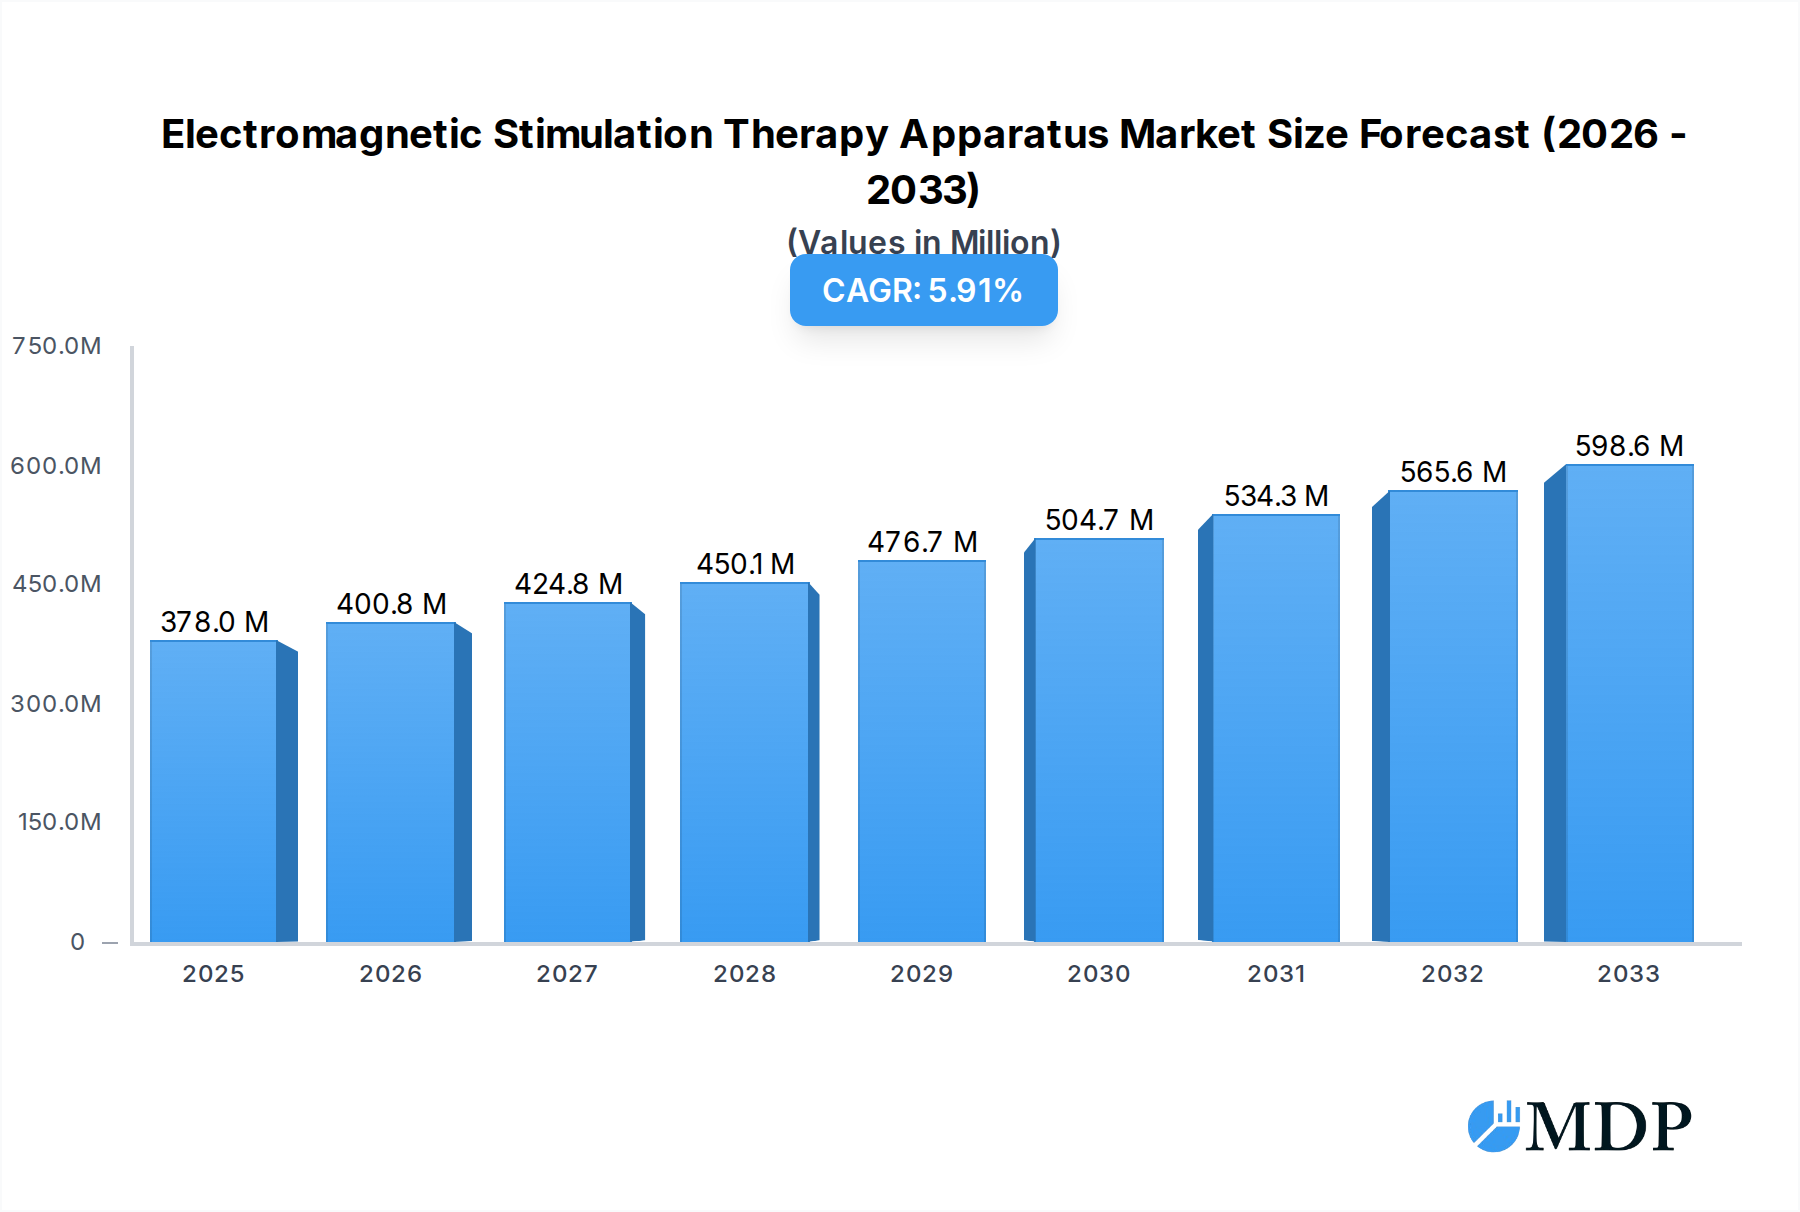
Electromagnetic Stimulation Therapy Apparatus Market Size (In Billion)
This growth trajectory is further reinforced by the expanding geriatric population, which is highly susceptible to age-related neurological conditions. Furthermore, a rising preference for non-pharmacological treatment options, due to concerns about side effects associated with conventional drugs, is contributing to a significant uptake of electromagnetic stimulation therapies. While technological advancements are pushing the boundaries of effectiveness, pricing considerations and the need for specialized training for healthcare professionals remain potential constraints. Ongoing research efforts focusing on optimizing stimulation parameters, enhancing patient comfort, and broadening therapeutic indications will significantly influence the market's future trajectory. The competitive landscape is dynamic, with both established players and emerging companies continuously striving for technological differentiation and market share expansion.

Electromagnetic Stimulation Therapy Apparatus Company Market Share
Electromagnetic Stimulation Therapy Apparatus Market Report: 2019-2033
This comprehensive report provides a detailed analysis of the global Electromagnetic Stimulation Therapy Apparatus market, offering invaluable insights for industry stakeholders, investors, and strategic decision-makers. With a study period spanning 2019-2033, a base year of 2025, and a forecast period of 2025-2033, this report leverages rigorous research methodologies to project a market valued at $xx million by 2033, exhibiting a CAGR of xx% during the forecast period. The report covers key market segments, leading players, and emerging trends shaping this dynamic sector. Maximize your understanding of this rapidly evolving market and gain a competitive edge.
Electromagnetic Stimulation Therapy Apparatus Market Dynamics & Concentration
The global electromagnetic stimulation therapy apparatus market is characterized by a moderately consolidated landscape, with a few major players holding significant market share. In 2024, the top five companies – Medtronic, Abbott Laboratories, Boston Scientific, Synapse Biomedical, and Nevro – collectively accounted for an estimated xx% of the global market. Market concentration is influenced by factors such as stringent regulatory approvals, high R&D investments, and the need for specialized manufacturing capabilities.
- Innovation Drivers: Continuous advancements in technology, including the development of non-invasive and minimally invasive devices, are driving market growth. The integration of AI and machine learning for personalized treatment plans is also a significant factor.
- Regulatory Frameworks: Stringent regulatory approvals and reimbursement policies vary across different geographies, influencing market dynamics. Compliance with regulations such as those from the FDA (in the US) and EMA (in Europe) are crucial for market entry and success.
- Product Substitutes: While electromagnetic stimulation therapy offers unique advantages, it faces competition from alternative treatment options, including pharmacological interventions and surgical procedures. This competitive landscape necessitates continuous innovation and differentiation.
- End-User Trends: The increasing prevalence of neurological and musculoskeletal disorders, coupled with a growing preference for non-pharmacological treatments, fuels market demand. The aging population globally significantly contributes to this trend.
- M&A Activities: The past five years have witnessed xx mergers and acquisitions in the electromagnetic stimulation therapy apparatus sector, reflecting consolidation trends and efforts by major players to expand their product portfolios and market reach.
Electromagnetic Stimulation Therapy Apparatus Industry Trends & Analysis
The electromagnetic stimulation therapy apparatus market is experiencing robust growth driven by several key factors. Technological advancements, such as the development of more targeted and effective stimulation techniques, are improving treatment outcomes and expanding the range of treatable conditions. The market exhibits a strong preference for minimally invasive and non-invasive procedures, aligning with the global push for less-invasive healthcare solutions. The rising prevalence of chronic neurological disorders such as Parkinson's disease, epilepsy, and chronic pain is a major driver of market growth. This growing prevalence, coupled with increased awareness and acceptance of electromagnetic stimulation therapies, is expected to further propel market expansion. Competitive dynamics are intense, with leading players focusing on product innovation, strategic partnerships, and geographic expansion to maintain their market share.
The global market size is estimated to reach $xx million in 2025, with a projected CAGR of xx% from 2025 to 2033. Market penetration in developed regions is relatively high, with significant growth potential remaining in emerging markets as healthcare infrastructure improves and awareness increases. Technological disruptions, such as the integration of AI and machine learning into devices, are set to revolutionize personalized treatment and enhance efficacy, driving further market expansion.
Leading Markets & Segments in Electromagnetic Stimulation Therapy Apparatus
North America currently dominates the electromagnetic stimulation therapy apparatus market, holding approximately xx% of the global market share in 2024. This dominance is attributed to several factors:
- Strong Healthcare Infrastructure: Well-established healthcare infrastructure, including advanced hospitals and clinics, provides a robust platform for the adoption and implementation of electromagnetic stimulation therapies.
- High Healthcare Spending: High levels of healthcare expenditure contribute to the affordability and accessibility of advanced medical technologies.
- High Prevalence of Target Conditions: The region boasts a high prevalence of neurological and musculoskeletal disorders, driving demand for effective treatment options.
- Favorable Regulatory Environment: A relatively streamlined regulatory approval process facilitates faster market entry for new products.
Europe follows as the second-largest market, exhibiting significant growth potential driven by increasing investments in healthcare infrastructure and the rising prevalence of chronic diseases. Asia-Pacific is experiencing rapid growth, fueled by a growing population, expanding healthcare systems, and increasing disposable incomes.
Electromagnetic Stimulation Therapy Apparatus Product Developments
Recent product innovations include the development of smaller, more portable devices, improved targeting capabilities through advanced algorithms, and the integration of wireless connectivity for remote monitoring and data analysis. These advancements are enhancing patient comfort, treatment efficacy, and overall user experience. The market is witnessing a shift towards personalized treatment plans, driven by the integration of AI and machine learning to tailor stimulation parameters to individual patient needs. This focus on personalization and improved outcomes is driving the adoption of electromagnetic stimulation therapies across a wider range of applications.
Key Drivers of Electromagnetic Stimulation Therapy Apparatus Growth
The growth of the electromagnetic stimulation therapy apparatus market is propelled by several key factors:
- Technological Advancements: Continuous improvements in device design, stimulation techniques, and data analysis capabilities are driving adoption.
- Rising Prevalence of Chronic Diseases: The increasing global incidence of neurological and musculoskeletal disorders fuels market demand.
- Favorable Regulatory Landscape: Supportive regulatory frameworks in several key markets are facilitating market expansion.
- Increased Healthcare Spending: Growing healthcare expenditures are making advanced therapies more accessible.
Challenges in the Electromagnetic Stimulation Therapy Apparatus Market
Despite its strong growth trajectory, the market faces challenges:
- High Costs: The high cost of devices and treatments can limit accessibility in certain markets.
- Regulatory Hurdles: Strict regulatory requirements for approval can delay product launches and increase costs.
- Competition: The market is characterized by intense competition among established players and emerging companies.
- Reimbursement Challenges: Securing reimbursement from insurance providers can be challenging, impacting market penetration.
Emerging Opportunities in Electromagnetic Stimulation Therapy Apparatus
Significant long-term growth opportunities exist in the market:
- Expansion into Emerging Markets: Untapped market potential exists in developing economies with rising healthcare expenditure.
- Technological Innovations: Further advancements in AI, machine learning, and personalized medicine will drive market expansion.
- Strategic Partnerships: Collaborative efforts between device manufacturers, healthcare providers, and research institutions can accelerate innovation and market penetration.
Leading Players in the Electromagnetic Stimulation Therapy Apparatus Sector
Key Milestones in Electromagnetic Stimulation Therapy Apparatus Industry
- 2020: FDA approval of a new generation of non-invasive stimulation device for chronic pain management by Company X.
- 2021: Acquisition of Company Y by Medtronic expands its product portfolio in the market.
- 2022: Launch of a new minimally invasive device with enhanced targeting capabilities by Boston Scientific.
- 2023: Significant clinical trial results demonstrating the efficacy of electromagnetic stimulation for a new neurological condition published by Company Z.
- 2024: Strategic partnership between Company A and a major research institute to accelerate innovation in the field.
Strategic Outlook for Electromagnetic Stimulation Therapy Apparatus Market
The electromagnetic stimulation therapy apparatus market is poised for continued robust growth, driven by technological innovation, expanding indications, and rising healthcare spending. Strategic opportunities lie in developing personalized therapies, expanding into new geographic markets, and forging strategic collaborations to broaden market reach. Companies focusing on innovation, regulatory compliance, and effective market access strategies will be well-positioned to capitalize on the market’s significant growth potential in the coming years.
Electromagnetic Stimulation Therapy Apparatus Segmentation
-
1. Application
- 1.1. Hospital
- 1.2. Treatment Center
- 1.3. Specialist Clinic
- 1.4. Others
-
2. Types
- 2.1. Low Frequency Electromagnetic Therapy Apparatus
- 2.2. High Frequency Electromagnetic Therapy Apparatus
- 2.3. Radio Frequency Electromagnetic Therapy Apparatus
Electromagnetic Stimulation Therapy Apparatus Segmentation By Geography
-
1. North America
- 1.1. United States
- 1.2. Canada
- 1.3. Mexico
-
2. South America
- 2.1. Brazil
- 2.2. Argentina
- 2.3. Rest of South America
-
3. Europe
- 3.1. United Kingdom
- 3.2. Germany
- 3.3. France
- 3.4. Italy
- 3.5. Spain
- 3.6. Russia
- 3.7. Benelux
- 3.8. Nordics
- 3.9. Rest of Europe
-
4. Middle East & Africa
- 4.1. Turkey
- 4.2. Israel
- 4.3. GCC
- 4.4. North Africa
- 4.5. South Africa
- 4.6. Rest of Middle East & Africa
-
5. Asia Pacific
- 5.1. China
- 5.2. India
- 5.3. Japan
- 5.4. South Korea
- 5.5. ASEAN
- 5.6. Oceania
- 5.7. Rest of Asia Pacific
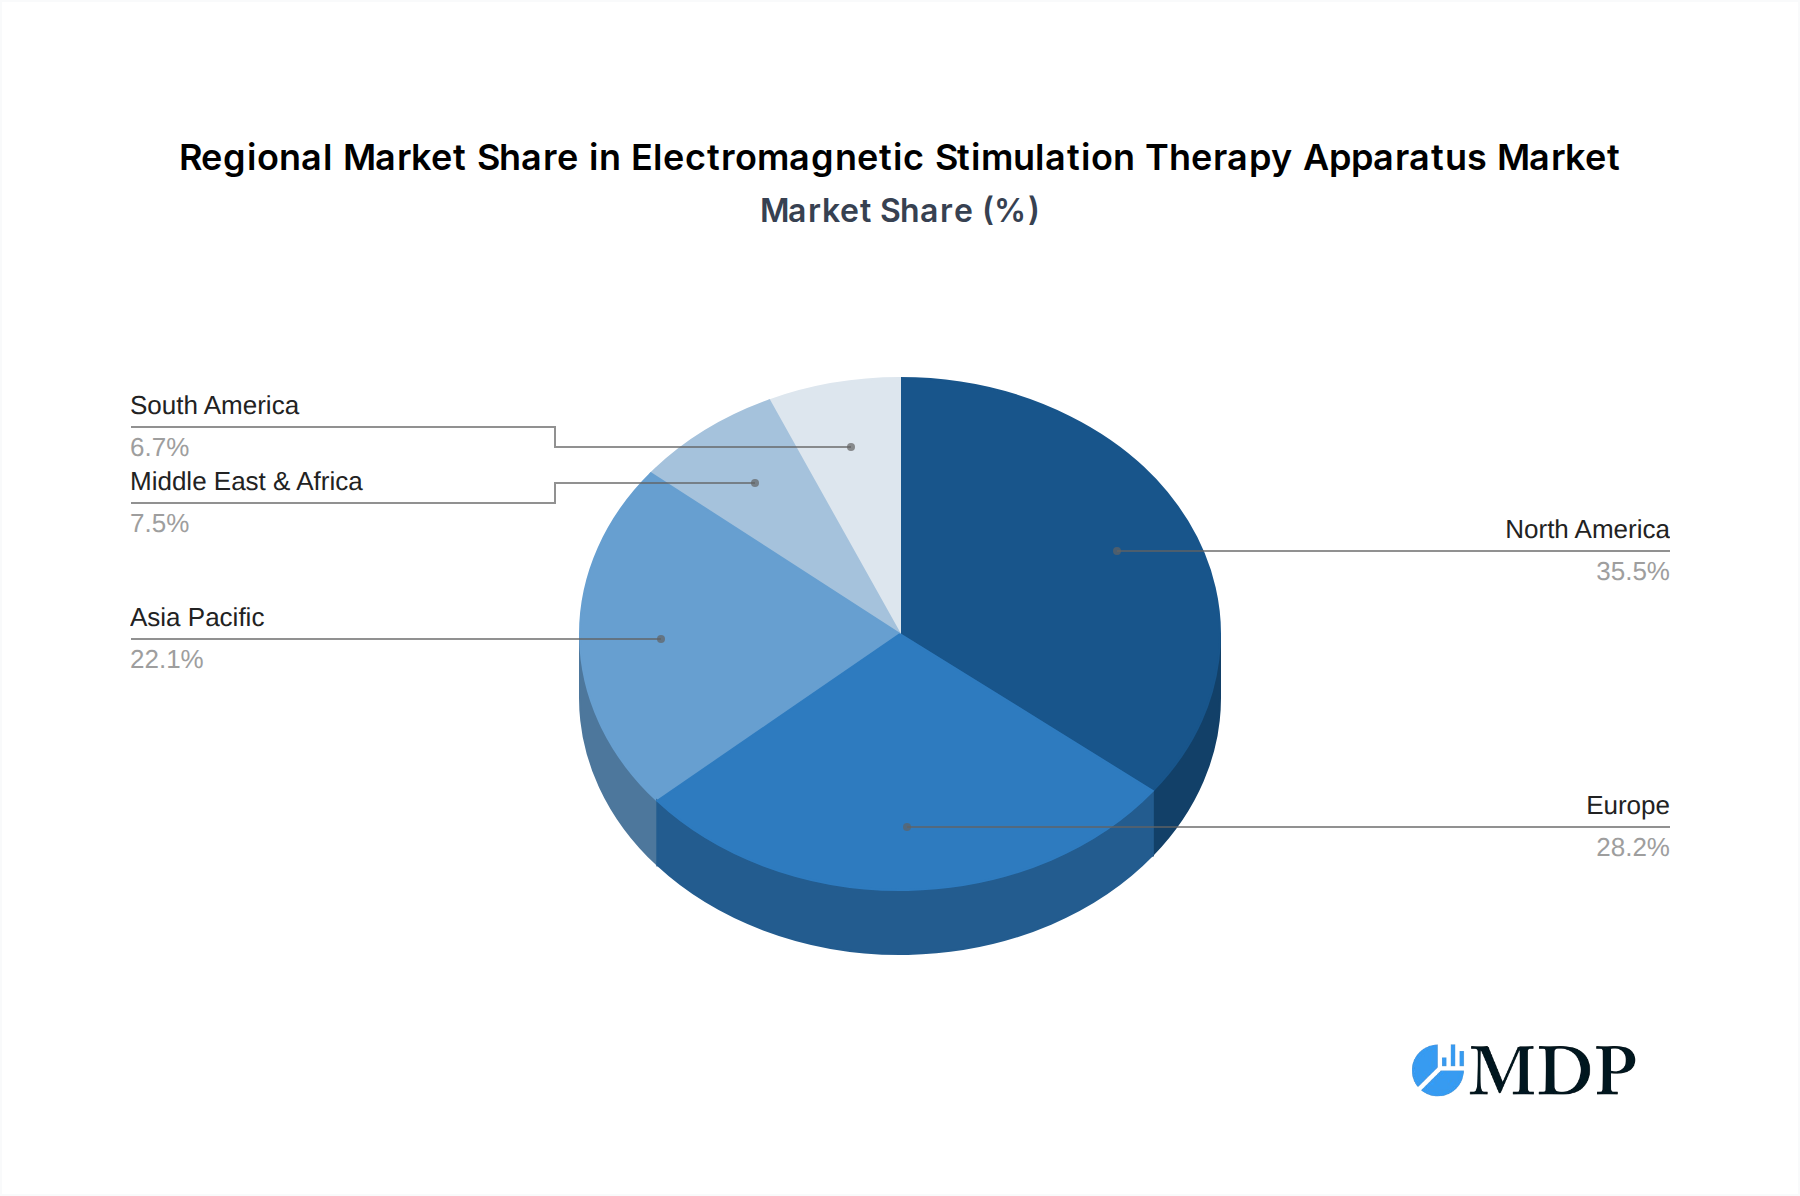
Electromagnetic Stimulation Therapy Apparatus Regional Market Share
Geographic Coverage of Electromagnetic Stimulation Therapy Apparatus
Electromagnetic Stimulation Therapy Apparatus REPORT HIGHLIGHTS
| Aspects | Details |
|---|---|
| Study Period | 2020-2034 |
| Base Year | 2025 |
| Estimated Year | 2026 |
| Forecast Period | 2026-2034 |
| Historical Period | 2020-2025 |
| Growth Rate | CAGR of 3.9% from 2020-2034 |
| Segmentation |
|
Table of Contents
- 1. Introduction
- 1.1. Research Scope
- 1.2. Market Segmentation
- 1.3. Research Objective
- 1.4. Definitions and Assumptions
- 2. Executive Summary
- 2.1. Market Snapshot
- 3. Market Dynamics
- 3.1. Market Drivers
- 3.2. Market Restrains
- 3.3. Market Trends
- 3.4. Market Opportunities
- 4. Market Factor Analysis
- 4.1. Porters Five Forces
- 4.1.1. Bargaining Power of Suppliers
- 4.1.2. Bargaining Power of Buyers
- 4.1.3. Threat of New Entrants
- 4.1.4. Threat of Substitutes
- 4.1.5. Competitive Rivalry
- 4.2. PESTEL analysis
- 4.3. BCG Analysis
- 4.3.1. Stars (High Growth, High Market Share)
- 4.3.2. Cash Cows (Low Growth, High Market Share)
- 4.3.3. Question Mark (High Growth, Low Market Share)
- 4.3.4. Dogs (Low Growth, Low Market Share)
- 4.4. Ansoff Matrix Analysis
- 4.5. Supply Chain Analysis
- 4.6. Regulatory Landscape
- 4.7. Current Market Potential and Opportunity Assessment (TAM–SAM–SOM Framework)
- 4.8. MDP Analyst Note
- 4.1. Porters Five Forces
- 5. Market Analysis, Insights and Forecast 2021-2033
- 5.1. Market Analysis, Insights and Forecast - by Application
- 5.1.1. Hospital
- 5.1.2. Treatment Center
- 5.1.3. Specialist Clinic
- 5.1.4. Others
- 5.2. Market Analysis, Insights and Forecast - by Types
- 5.2.1. Low Frequency Electromagnetic Therapy Apparatus
- 5.2.2. High Frequency Electromagnetic Therapy Apparatus
- 5.2.3. Radio Frequency Electromagnetic Therapy Apparatus
- 5.3. Market Analysis, Insights and Forecast - by Region
- 5.3.1. North America
- 5.3.2. South America
- 5.3.3. Europe
- 5.3.4. Middle East & Africa
- 5.3.5. Asia Pacific
- 5.1. Market Analysis, Insights and Forecast - by Application
- 6. Global Electromagnetic Stimulation Therapy Apparatus Analysis, Insights and Forecast, 2021-2033
- 6.1. Market Analysis, Insights and Forecast - by Application
- 6.1.1. Hospital
- 6.1.2. Treatment Center
- 6.1.3. Specialist Clinic
- 6.1.4. Others
- 6.2. Market Analysis, Insights and Forecast - by Types
- 6.2.1. Low Frequency Electromagnetic Therapy Apparatus
- 6.2.2. High Frequency Electromagnetic Therapy Apparatus
- 6.2.3. Radio Frequency Electromagnetic Therapy Apparatus
- 6.1. Market Analysis, Insights and Forecast - by Application
- 7. North America Electromagnetic Stimulation Therapy Apparatus Analysis, Insights and Forecast, 2020-2032
- 7.1. Market Analysis, Insights and Forecast - by Application
- 7.1.1. Hospital
- 7.1.2. Treatment Center
- 7.1.3. Specialist Clinic
- 7.1.4. Others
- 7.2. Market Analysis, Insights and Forecast - by Types
- 7.2.1. Low Frequency Electromagnetic Therapy Apparatus
- 7.2.2. High Frequency Electromagnetic Therapy Apparatus
- 7.2.3. Radio Frequency Electromagnetic Therapy Apparatus
- 7.1. Market Analysis, Insights and Forecast - by Application
- 8. South America Electromagnetic Stimulation Therapy Apparatus Analysis, Insights and Forecast, 2020-2032
- 8.1. Market Analysis, Insights and Forecast - by Application
- 8.1.1. Hospital
- 8.1.2. Treatment Center
- 8.1.3. Specialist Clinic
- 8.1.4. Others
- 8.2. Market Analysis, Insights and Forecast - by Types
- 8.2.1. Low Frequency Electromagnetic Therapy Apparatus
- 8.2.2. High Frequency Electromagnetic Therapy Apparatus
- 8.2.3. Radio Frequency Electromagnetic Therapy Apparatus
- 8.1. Market Analysis, Insights and Forecast - by Application
- 9. Europe Electromagnetic Stimulation Therapy Apparatus Analysis, Insights and Forecast, 2020-2032
- 9.1. Market Analysis, Insights and Forecast - by Application
- 9.1.1. Hospital
- 9.1.2. Treatment Center
- 9.1.3. Specialist Clinic
- 9.1.4. Others
- 9.2. Market Analysis, Insights and Forecast - by Types
- 9.2.1. Low Frequency Electromagnetic Therapy Apparatus
- 9.2.2. High Frequency Electromagnetic Therapy Apparatus
- 9.2.3. Radio Frequency Electromagnetic Therapy Apparatus
- 9.1. Market Analysis, Insights and Forecast - by Application
- 10. Middle East & Africa Electromagnetic Stimulation Therapy Apparatus Analysis, Insights and Forecast, 2020-2032
- 10.1. Market Analysis, Insights and Forecast - by Application
- 10.1.1. Hospital
- 10.1.2. Treatment Center
- 10.1.3. Specialist Clinic
- 10.1.4. Others
- 10.2. Market Analysis, Insights and Forecast - by Types
- 10.2.1. Low Frequency Electromagnetic Therapy Apparatus
- 10.2.2. High Frequency Electromagnetic Therapy Apparatus
- 10.2.3. Radio Frequency Electromagnetic Therapy Apparatus
- 10.1. Market Analysis, Insights and Forecast - by Application
- 11. Asia Pacific Electromagnetic Stimulation Therapy Apparatus Analysis, Insights and Forecast, 2020-2032
- 11.1. Market Analysis, Insights and Forecast - by Application
- 11.1.1. Hospital
- 11.1.2. Treatment Center
- 11.1.3. Specialist Clinic
- 11.1.4. Others
- 11.2. Market Analysis, Insights and Forecast - by Types
- 11.2.1. Low Frequency Electromagnetic Therapy Apparatus
- 11.2.2. High Frequency Electromagnetic Therapy Apparatus
- 11.2.3. Radio Frequency Electromagnetic Therapy Apparatus
- 11.1. Market Analysis, Insights and Forecast - by Application
- 12. Competitive Analysis
- 12.1. Company Profiles
- 12.1.1 Medtronic
- 12.1.1.1. Company Overview
- 12.1.1.2. Products
- 12.1.1.3. Company Financials
- 12.1.1.4. SWOT Analysis
- 12.1.2 Abbott Laboratories
- 12.1.2.1. Company Overview
- 12.1.2.2. Products
- 12.1.2.3. Company Financials
- 12.1.2.4. SWOT Analysis
- 12.1.3 Boston Scientific
- 12.1.3.1. Company Overview
- 12.1.3.2. Products
- 12.1.3.3. Company Financials
- 12.1.3.4. SWOT Analysis
- 12.1.4 Synapse Biomedical
- 12.1.4.1. Company Overview
- 12.1.4.2. Products
- 12.1.4.3. Company Financials
- 12.1.4.4. SWOT Analysis
- 12.1.5 Nevro
- 12.1.5.1. Company Overview
- 12.1.5.2. Products
- 12.1.5.3. Company Financials
- 12.1.5.4. SWOT Analysis
- 12.1.6 DJO Global
- 12.1.6.1. Company Overview
- 12.1.6.2. Products
- 12.1.6.3. Company Financials
- 12.1.6.4. SWOT Analysis
- 12.1.7 Axonics
- 12.1.7.1. Company Overview
- 12.1.7.2. Products
- 12.1.7.3. Company Financials
- 12.1.7.4. SWOT Analysis
- 12.1.8 Nalu Medical
- 12.1.8.1. Company Overview
- 12.1.8.2. Products
- 12.1.8.3. Company Financials
- 12.1.8.4. SWOT Analysis
- 12.1.9 Zynex Medical
- 12.1.9.1. Company Overview
- 12.1.9.2. Products
- 12.1.9.3. Company Financials
- 12.1.9.4. SWOT Analysis
- 12.1.10 Cefaly Technology
- 12.1.10.1. Company Overview
- 12.1.10.2. Products
- 12.1.10.3. Company Financials
- 12.1.10.4. SWOT Analysis
- 12.1.11 ElectroCore
- 12.1.11.1. Company Overview
- 12.1.11.2. Products
- 12.1.11.3. Company Financials
- 12.1.11.4. SWOT Analysis
- 12.1.12 Zimmer Biomet
- 12.1.12.1. Company Overview
- 12.1.12.2. Products
- 12.1.12.3. Company Financials
- 12.1.12.4. SWOT Analysis
- 12.1.1 Medtronic
- 12.2. Market Entropy
- 12.2.1 Company's Key Areas Served
- 12.2.2 Recent Developments
- 12.3. Company Market Share Analysis 2025
- 12.3.1 Top 5 Companies Market Share Analysis
- 12.3.2 Top 3 Companies Market Share Analysis
- 12.4. List of Potential Customers
- 13. Research Methodology
List of Figures
- Figure 1: Global Electromagnetic Stimulation Therapy Apparatus Revenue Breakdown (undefined, %) by Region 2025 & 2033
- Figure 2: Global Electromagnetic Stimulation Therapy Apparatus Volume Breakdown (K, %) by Region 2025 & 2033
- Figure 3: North America Electromagnetic Stimulation Therapy Apparatus Revenue (undefined), by Application 2025 & 2033
- Figure 4: North America Electromagnetic Stimulation Therapy Apparatus Volume (K), by Application 2025 & 2033
- Figure 5: North America Electromagnetic Stimulation Therapy Apparatus Revenue Share (%), by Application 2025 & 2033
- Figure 6: North America Electromagnetic Stimulation Therapy Apparatus Volume Share (%), by Application 2025 & 2033
- Figure 7: North America Electromagnetic Stimulation Therapy Apparatus Revenue (undefined), by Types 2025 & 2033
- Figure 8: North America Electromagnetic Stimulation Therapy Apparatus Volume (K), by Types 2025 & 2033
- Figure 9: North America Electromagnetic Stimulation Therapy Apparatus Revenue Share (%), by Types 2025 & 2033
- Figure 10: North America Electromagnetic Stimulation Therapy Apparatus Volume Share (%), by Types 2025 & 2033
- Figure 11: North America Electromagnetic Stimulation Therapy Apparatus Revenue (undefined), by Country 2025 & 2033
- Figure 12: North America Electromagnetic Stimulation Therapy Apparatus Volume (K), by Country 2025 & 2033
- Figure 13: North America Electromagnetic Stimulation Therapy Apparatus Revenue Share (%), by Country 2025 & 2033
- Figure 14: North America Electromagnetic Stimulation Therapy Apparatus Volume Share (%), by Country 2025 & 2033
- Figure 15: South America Electromagnetic Stimulation Therapy Apparatus Revenue (undefined), by Application 2025 & 2033
- Figure 16: South America Electromagnetic Stimulation Therapy Apparatus Volume (K), by Application 2025 & 2033
- Figure 17: South America Electromagnetic Stimulation Therapy Apparatus Revenue Share (%), by Application 2025 & 2033
- Figure 18: South America Electromagnetic Stimulation Therapy Apparatus Volume Share (%), by Application 2025 & 2033
- Figure 19: South America Electromagnetic Stimulation Therapy Apparatus Revenue (undefined), by Types 2025 & 2033
- Figure 20: South America Electromagnetic Stimulation Therapy Apparatus Volume (K), by Types 2025 & 2033
- Figure 21: South America Electromagnetic Stimulation Therapy Apparatus Revenue Share (%), by Types 2025 & 2033
- Figure 22: South America Electromagnetic Stimulation Therapy Apparatus Volume Share (%), by Types 2025 & 2033
- Figure 23: South America Electromagnetic Stimulation Therapy Apparatus Revenue (undefined), by Country 2025 & 2033
- Figure 24: South America Electromagnetic Stimulation Therapy Apparatus Volume (K), by Country 2025 & 2033
- Figure 25: South America Electromagnetic Stimulation Therapy Apparatus Revenue Share (%), by Country 2025 & 2033
- Figure 26: South America Electromagnetic Stimulation Therapy Apparatus Volume Share (%), by Country 2025 & 2033
- Figure 27: Europe Electromagnetic Stimulation Therapy Apparatus Revenue (undefined), by Application 2025 & 2033
- Figure 28: Europe Electromagnetic Stimulation Therapy Apparatus Volume (K), by Application 2025 & 2033
- Figure 29: Europe Electromagnetic Stimulation Therapy Apparatus Revenue Share (%), by Application 2025 & 2033
- Figure 30: Europe Electromagnetic Stimulation Therapy Apparatus Volume Share (%), by Application 2025 & 2033
- Figure 31: Europe Electromagnetic Stimulation Therapy Apparatus Revenue (undefined), by Types 2025 & 2033
- Figure 32: Europe Electromagnetic Stimulation Therapy Apparatus Volume (K), by Types 2025 & 2033
- Figure 33: Europe Electromagnetic Stimulation Therapy Apparatus Revenue Share (%), by Types 2025 & 2033
- Figure 34: Europe Electromagnetic Stimulation Therapy Apparatus Volume Share (%), by Types 2025 & 2033
- Figure 35: Europe Electromagnetic Stimulation Therapy Apparatus Revenue (undefined), by Country 2025 & 2033
- Figure 36: Europe Electromagnetic Stimulation Therapy Apparatus Volume (K), by Country 2025 & 2033
- Figure 37: Europe Electromagnetic Stimulation Therapy Apparatus Revenue Share (%), by Country 2025 & 2033
- Figure 38: Europe Electromagnetic Stimulation Therapy Apparatus Volume Share (%), by Country 2025 & 2033
- Figure 39: Middle East & Africa Electromagnetic Stimulation Therapy Apparatus Revenue (undefined), by Application 2025 & 2033
- Figure 40: Middle East & Africa Electromagnetic Stimulation Therapy Apparatus Volume (K), by Application 2025 & 2033
- Figure 41: Middle East & Africa Electromagnetic Stimulation Therapy Apparatus Revenue Share (%), by Application 2025 & 2033
- Figure 42: Middle East & Africa Electromagnetic Stimulation Therapy Apparatus Volume Share (%), by Application 2025 & 2033
- Figure 43: Middle East & Africa Electromagnetic Stimulation Therapy Apparatus Revenue (undefined), by Types 2025 & 2033
- Figure 44: Middle East & Africa Electromagnetic Stimulation Therapy Apparatus Volume (K), by Types 2025 & 2033
- Figure 45: Middle East & Africa Electromagnetic Stimulation Therapy Apparatus Revenue Share (%), by Types 2025 & 2033
- Figure 46: Middle East & Africa Electromagnetic Stimulation Therapy Apparatus Volume Share (%), by Types 2025 & 2033
- Figure 47: Middle East & Africa Electromagnetic Stimulation Therapy Apparatus Revenue (undefined), by Country 2025 & 2033
- Figure 48: Middle East & Africa Electromagnetic Stimulation Therapy Apparatus Volume (K), by Country 2025 & 2033
- Figure 49: Middle East & Africa Electromagnetic Stimulation Therapy Apparatus Revenue Share (%), by Country 2025 & 2033
- Figure 50: Middle East & Africa Electromagnetic Stimulation Therapy Apparatus Volume Share (%), by Country 2025 & 2033
- Figure 51: Asia Pacific Electromagnetic Stimulation Therapy Apparatus Revenue (undefined), by Application 2025 & 2033
- Figure 52: Asia Pacific Electromagnetic Stimulation Therapy Apparatus Volume (K), by Application 2025 & 2033
- Figure 53: Asia Pacific Electromagnetic Stimulation Therapy Apparatus Revenue Share (%), by Application 2025 & 2033
- Figure 54: Asia Pacific Electromagnetic Stimulation Therapy Apparatus Volume Share (%), by Application 2025 & 2033
- Figure 55: Asia Pacific Electromagnetic Stimulation Therapy Apparatus Revenue (undefined), by Types 2025 & 2033
- Figure 56: Asia Pacific Electromagnetic Stimulation Therapy Apparatus Volume (K), by Types 2025 & 2033
- Figure 57: Asia Pacific Electromagnetic Stimulation Therapy Apparatus Revenue Share (%), by Types 2025 & 2033
- Figure 58: Asia Pacific Electromagnetic Stimulation Therapy Apparatus Volume Share (%), by Types 2025 & 2033
- Figure 59: Asia Pacific Electromagnetic Stimulation Therapy Apparatus Revenue (undefined), by Country 2025 & 2033
- Figure 60: Asia Pacific Electromagnetic Stimulation Therapy Apparatus Volume (K), by Country 2025 & 2033
- Figure 61: Asia Pacific Electromagnetic Stimulation Therapy Apparatus Revenue Share (%), by Country 2025 & 2033
- Figure 62: Asia Pacific Electromagnetic Stimulation Therapy Apparatus Volume Share (%), by Country 2025 & 2033
List of Tables
- Table 1: Global Electromagnetic Stimulation Therapy Apparatus Revenue undefined Forecast, by Application 2020 & 2033
- Table 2: Global Electromagnetic Stimulation Therapy Apparatus Volume K Forecast, by Application 2020 & 2033
- Table 3: Global Electromagnetic Stimulation Therapy Apparatus Revenue undefined Forecast, by Types 2020 & 2033
- Table 4: Global Electromagnetic Stimulation Therapy Apparatus Volume K Forecast, by Types 2020 & 2033
- Table 5: Global Electromagnetic Stimulation Therapy Apparatus Revenue undefined Forecast, by Region 2020 & 2033
- Table 6: Global Electromagnetic Stimulation Therapy Apparatus Volume K Forecast, by Region 2020 & 2033
- Table 7: Global Electromagnetic Stimulation Therapy Apparatus Revenue undefined Forecast, by Application 2020 & 2033
- Table 8: Global Electromagnetic Stimulation Therapy Apparatus Volume K Forecast, by Application 2020 & 2033
- Table 9: Global Electromagnetic Stimulation Therapy Apparatus Revenue undefined Forecast, by Types 2020 & 2033
- Table 10: Global Electromagnetic Stimulation Therapy Apparatus Volume K Forecast, by Types 2020 & 2033
- Table 11: Global Electromagnetic Stimulation Therapy Apparatus Revenue undefined Forecast, by Country 2020 & 2033
- Table 12: Global Electromagnetic Stimulation Therapy Apparatus Volume K Forecast, by Country 2020 & 2033
- Table 13: United States Electromagnetic Stimulation Therapy Apparatus Revenue (undefined) Forecast, by Application 2020 & 2033
- Table 14: United States Electromagnetic Stimulation Therapy Apparatus Volume (K) Forecast, by Application 2020 & 2033
- Table 15: Canada Electromagnetic Stimulation Therapy Apparatus Revenue (undefined) Forecast, by Application 2020 & 2033
- Table 16: Canada Electromagnetic Stimulation Therapy Apparatus Volume (K) Forecast, by Application 2020 & 2033
- Table 17: Mexico Electromagnetic Stimulation Therapy Apparatus Revenue (undefined) Forecast, by Application 2020 & 2033
- Table 18: Mexico Electromagnetic Stimulation Therapy Apparatus Volume (K) Forecast, by Application 2020 & 2033
- Table 19: Global Electromagnetic Stimulation Therapy Apparatus Revenue undefined Forecast, by Application 2020 & 2033
- Table 20: Global Electromagnetic Stimulation Therapy Apparatus Volume K Forecast, by Application 2020 & 2033
- Table 21: Global Electromagnetic Stimulation Therapy Apparatus Revenue undefined Forecast, by Types 2020 & 2033
- Table 22: Global Electromagnetic Stimulation Therapy Apparatus Volume K Forecast, by Types 2020 & 2033
- Table 23: Global Electromagnetic Stimulation Therapy Apparatus Revenue undefined Forecast, by Country 2020 & 2033
- Table 24: Global Electromagnetic Stimulation Therapy Apparatus Volume K Forecast, by Country 2020 & 2033
- Table 25: Brazil Electromagnetic Stimulation Therapy Apparatus Revenue (undefined) Forecast, by Application 2020 & 2033
- Table 26: Brazil Electromagnetic Stimulation Therapy Apparatus Volume (K) Forecast, by Application 2020 & 2033
- Table 27: Argentina Electromagnetic Stimulation Therapy Apparatus Revenue (undefined) Forecast, by Application 2020 & 2033
- Table 28: Argentina Electromagnetic Stimulation Therapy Apparatus Volume (K) Forecast, by Application 2020 & 2033
- Table 29: Rest of South America Electromagnetic Stimulation Therapy Apparatus Revenue (undefined) Forecast, by Application 2020 & 2033
- Table 30: Rest of South America Electromagnetic Stimulation Therapy Apparatus Volume (K) Forecast, by Application 2020 & 2033
- Table 31: Global Electromagnetic Stimulation Therapy Apparatus Revenue undefined Forecast, by Application 2020 & 2033
- Table 32: Global Electromagnetic Stimulation Therapy Apparatus Volume K Forecast, by Application 2020 & 2033
- Table 33: Global Electromagnetic Stimulation Therapy Apparatus Revenue undefined Forecast, by Types 2020 & 2033
- Table 34: Global Electromagnetic Stimulation Therapy Apparatus Volume K Forecast, by Types 2020 & 2033
- Table 35: Global Electromagnetic Stimulation Therapy Apparatus Revenue undefined Forecast, by Country 2020 & 2033
- Table 36: Global Electromagnetic Stimulation Therapy Apparatus Volume K Forecast, by Country 2020 & 2033
- Table 37: United Kingdom Electromagnetic Stimulation Therapy Apparatus Revenue (undefined) Forecast, by Application 2020 & 2033
- Table 38: United Kingdom Electromagnetic Stimulation Therapy Apparatus Volume (K) Forecast, by Application 2020 & 2033
- Table 39: Germany Electromagnetic Stimulation Therapy Apparatus Revenue (undefined) Forecast, by Application 2020 & 2033
- Table 40: Germany Electromagnetic Stimulation Therapy Apparatus Volume (K) Forecast, by Application 2020 & 2033
- Table 41: France Electromagnetic Stimulation Therapy Apparatus Revenue (undefined) Forecast, by Application 2020 & 2033
- Table 42: France Electromagnetic Stimulation Therapy Apparatus Volume (K) Forecast, by Application 2020 & 2033
- Table 43: Italy Electromagnetic Stimulation Therapy Apparatus Revenue (undefined) Forecast, by Application 2020 & 2033
- Table 44: Italy Electromagnetic Stimulation Therapy Apparatus Volume (K) Forecast, by Application 2020 & 2033
- Table 45: Spain Electromagnetic Stimulation Therapy Apparatus Revenue (undefined) Forecast, by Application 2020 & 2033
- Table 46: Spain Electromagnetic Stimulation Therapy Apparatus Volume (K) Forecast, by Application 2020 & 2033
- Table 47: Russia Electromagnetic Stimulation Therapy Apparatus Revenue (undefined) Forecast, by Application 2020 & 2033
- Table 48: Russia Electromagnetic Stimulation Therapy Apparatus Volume (K) Forecast, by Application 2020 & 2033
- Table 49: Benelux Electromagnetic Stimulation Therapy Apparatus Revenue (undefined) Forecast, by Application 2020 & 2033
- Table 50: Benelux Electromagnetic Stimulation Therapy Apparatus Volume (K) Forecast, by Application 2020 & 2033
- Table 51: Nordics Electromagnetic Stimulation Therapy Apparatus Revenue (undefined) Forecast, by Application 2020 & 2033
- Table 52: Nordics Electromagnetic Stimulation Therapy Apparatus Volume (K) Forecast, by Application 2020 & 2033
- Table 53: Rest of Europe Electromagnetic Stimulation Therapy Apparatus Revenue (undefined) Forecast, by Application 2020 & 2033
- Table 54: Rest of Europe Electromagnetic Stimulation Therapy Apparatus Volume (K) Forecast, by Application 2020 & 2033
- Table 55: Global Electromagnetic Stimulation Therapy Apparatus Revenue undefined Forecast, by Application 2020 & 2033
- Table 56: Global Electromagnetic Stimulation Therapy Apparatus Volume K Forecast, by Application 2020 & 2033
- Table 57: Global Electromagnetic Stimulation Therapy Apparatus Revenue undefined Forecast, by Types 2020 & 2033
- Table 58: Global Electromagnetic Stimulation Therapy Apparatus Volume K Forecast, by Types 2020 & 2033
- Table 59: Global Electromagnetic Stimulation Therapy Apparatus Revenue undefined Forecast, by Country 2020 & 2033
- Table 60: Global Electromagnetic Stimulation Therapy Apparatus Volume K Forecast, by Country 2020 & 2033
- Table 61: Turkey Electromagnetic Stimulation Therapy Apparatus Revenue (undefined) Forecast, by Application 2020 & 2033
- Table 62: Turkey Electromagnetic Stimulation Therapy Apparatus Volume (K) Forecast, by Application 2020 & 2033
- Table 63: Israel Electromagnetic Stimulation Therapy Apparatus Revenue (undefined) Forecast, by Application 2020 & 2033
- Table 64: Israel Electromagnetic Stimulation Therapy Apparatus Volume (K) Forecast, by Application 2020 & 2033
- Table 65: GCC Electromagnetic Stimulation Therapy Apparatus Revenue (undefined) Forecast, by Application 2020 & 2033
- Table 66: GCC Electromagnetic Stimulation Therapy Apparatus Volume (K) Forecast, by Application 2020 & 2033
- Table 67: North Africa Electromagnetic Stimulation Therapy Apparatus Revenue (undefined) Forecast, by Application 2020 & 2033
- Table 68: North Africa Electromagnetic Stimulation Therapy Apparatus Volume (K) Forecast, by Application 2020 & 2033
- Table 69: South Africa Electromagnetic Stimulation Therapy Apparatus Revenue (undefined) Forecast, by Application 2020 & 2033
- Table 70: South Africa Electromagnetic Stimulation Therapy Apparatus Volume (K) Forecast, by Application 2020 & 2033
- Table 71: Rest of Middle East & Africa Electromagnetic Stimulation Therapy Apparatus Revenue (undefined) Forecast, by Application 2020 & 2033
- Table 72: Rest of Middle East & Africa Electromagnetic Stimulation Therapy Apparatus Volume (K) Forecast, by Application 2020 & 2033
- Table 73: Global Electromagnetic Stimulation Therapy Apparatus Revenue undefined Forecast, by Application 2020 & 2033
- Table 74: Global Electromagnetic Stimulation Therapy Apparatus Volume K Forecast, by Application 2020 & 2033
- Table 75: Global Electromagnetic Stimulation Therapy Apparatus Revenue undefined Forecast, by Types 2020 & 2033
- Table 76: Global Electromagnetic Stimulation Therapy Apparatus Volume K Forecast, by Types 2020 & 2033
- Table 77: Global Electromagnetic Stimulation Therapy Apparatus Revenue undefined Forecast, by Country 2020 & 2033
- Table 78: Global Electromagnetic Stimulation Therapy Apparatus Volume K Forecast, by Country 2020 & 2033
- Table 79: China Electromagnetic Stimulation Therapy Apparatus Revenue (undefined) Forecast, by Application 2020 & 2033
- Table 80: China Electromagnetic Stimulation Therapy Apparatus Volume (K) Forecast, by Application 2020 & 2033
- Table 81: India Electromagnetic Stimulation Therapy Apparatus Revenue (undefined) Forecast, by Application 2020 & 2033
- Table 82: India Electromagnetic Stimulation Therapy Apparatus Volume (K) Forecast, by Application 2020 & 2033
- Table 83: Japan Electromagnetic Stimulation Therapy Apparatus Revenue (undefined) Forecast, by Application 2020 & 2033
- Table 84: Japan Electromagnetic Stimulation Therapy Apparatus Volume (K) Forecast, by Application 2020 & 2033
- Table 85: South Korea Electromagnetic Stimulation Therapy Apparatus Revenue (undefined) Forecast, by Application 2020 & 2033
- Table 86: South Korea Electromagnetic Stimulation Therapy Apparatus Volume (K) Forecast, by Application 2020 & 2033
- Table 87: ASEAN Electromagnetic Stimulation Therapy Apparatus Revenue (undefined) Forecast, by Application 2020 & 2033
- Table 88: ASEAN Electromagnetic Stimulation Therapy Apparatus Volume (K) Forecast, by Application 2020 & 2033
- Table 89: Oceania Electromagnetic Stimulation Therapy Apparatus Revenue (undefined) Forecast, by Application 2020 & 2033
- Table 90: Oceania Electromagnetic Stimulation Therapy Apparatus Volume (K) Forecast, by Application 2020 & 2033
- Table 91: Rest of Asia Pacific Electromagnetic Stimulation Therapy Apparatus Revenue (undefined) Forecast, by Application 2020 & 2033
- Table 92: Rest of Asia Pacific Electromagnetic Stimulation Therapy Apparatus Volume (K) Forecast, by Application 2020 & 2033
Frequently Asked Questions
1. What is the projected Compound Annual Growth Rate (CAGR) of the Electromagnetic Stimulation Therapy Apparatus?
The projected CAGR is approximately 3.9%.
2. Which companies are prominent players in the Electromagnetic Stimulation Therapy Apparatus?
Key companies in the market include Medtronic, Abbott Laboratories, Boston Scientific, Synapse Biomedical, Nevro, DJO Global, Axonics, Nalu Medical, Zynex Medical, Cefaly Technology, ElectroCore, Zimmer Biomet.
3. What are the main segments of the Electromagnetic Stimulation Therapy Apparatus?
The market segments include Application, Types.
4. Can you provide details about the market size?
The market size is estimated to be USD XXX N/A as of 2022.
5. What are some drivers contributing to market growth?
N/A
6. What are the notable trends driving market growth?
N/A
7. Are there any restraints impacting market growth?
N/A
8. Can you provide examples of recent developments in the market?
N/A
9. What pricing options are available for accessing the report?
Pricing options include single-user, multi-user, and enterprise licenses priced at USD 3950.00, USD 5925.00, and USD 7900.00 respectively.
10. Is the market size provided in terms of value or volume?
The market size is provided in terms of value, measured in N/A and volume, measured in K.
11. Are there any specific market keywords associated with the report?
Yes, the market keyword associated with the report is "Electromagnetic Stimulation Therapy Apparatus," which aids in identifying and referencing the specific market segment covered.
12. How do I determine which pricing option suits my needs best?
The pricing options vary based on user requirements and access needs. Individual users may opt for single-user licenses, while businesses requiring broader access may choose multi-user or enterprise licenses for cost-effective access to the report.
13. Are there any additional resources or data provided in the Electromagnetic Stimulation Therapy Apparatus report?
While the report offers comprehensive insights, it's advisable to review the specific contents or supplementary materials provided to ascertain if additional resources or data are available.
14. How can I stay updated on further developments or reports in the Electromagnetic Stimulation Therapy Apparatus?
To stay informed about further developments, trends, and reports in the Electromagnetic Stimulation Therapy Apparatus, consider subscribing to industry newsletters, following relevant companies and organizations, or regularly checking reputable industry news sources and publications.
Methodology
Step 1 - Identification of Relevant Samples Size from Population Database


Step 2 - Approaches for Defining Global Market Size (Value, Volume* & Price*)

Note*: In applicable scenarios
Step 3 - Data Sources
Primary Research
- Web Analytics
- Survey Reports
- Research Institute
- Latest Research Reports
- Opinion Leaders
Secondary Research
- Annual Reports
- White Paper
- Latest Press Release
- Industry Association
- Paid Database
- Investor Presentations

Step 4 - Data Triangulation
Involves using different sources of information in order to increase the validity of a study
These sources are likely to be stakeholders in a program - participants, other researchers, program staff, other community members, and so on.
Then we put all data in single framework & apply various statistical tools to find out the dynamic on the market.
During the analysis stage, feedback from the stakeholder groups would be compared to determine areas of agreement as well as areas of divergence