

Key Insights
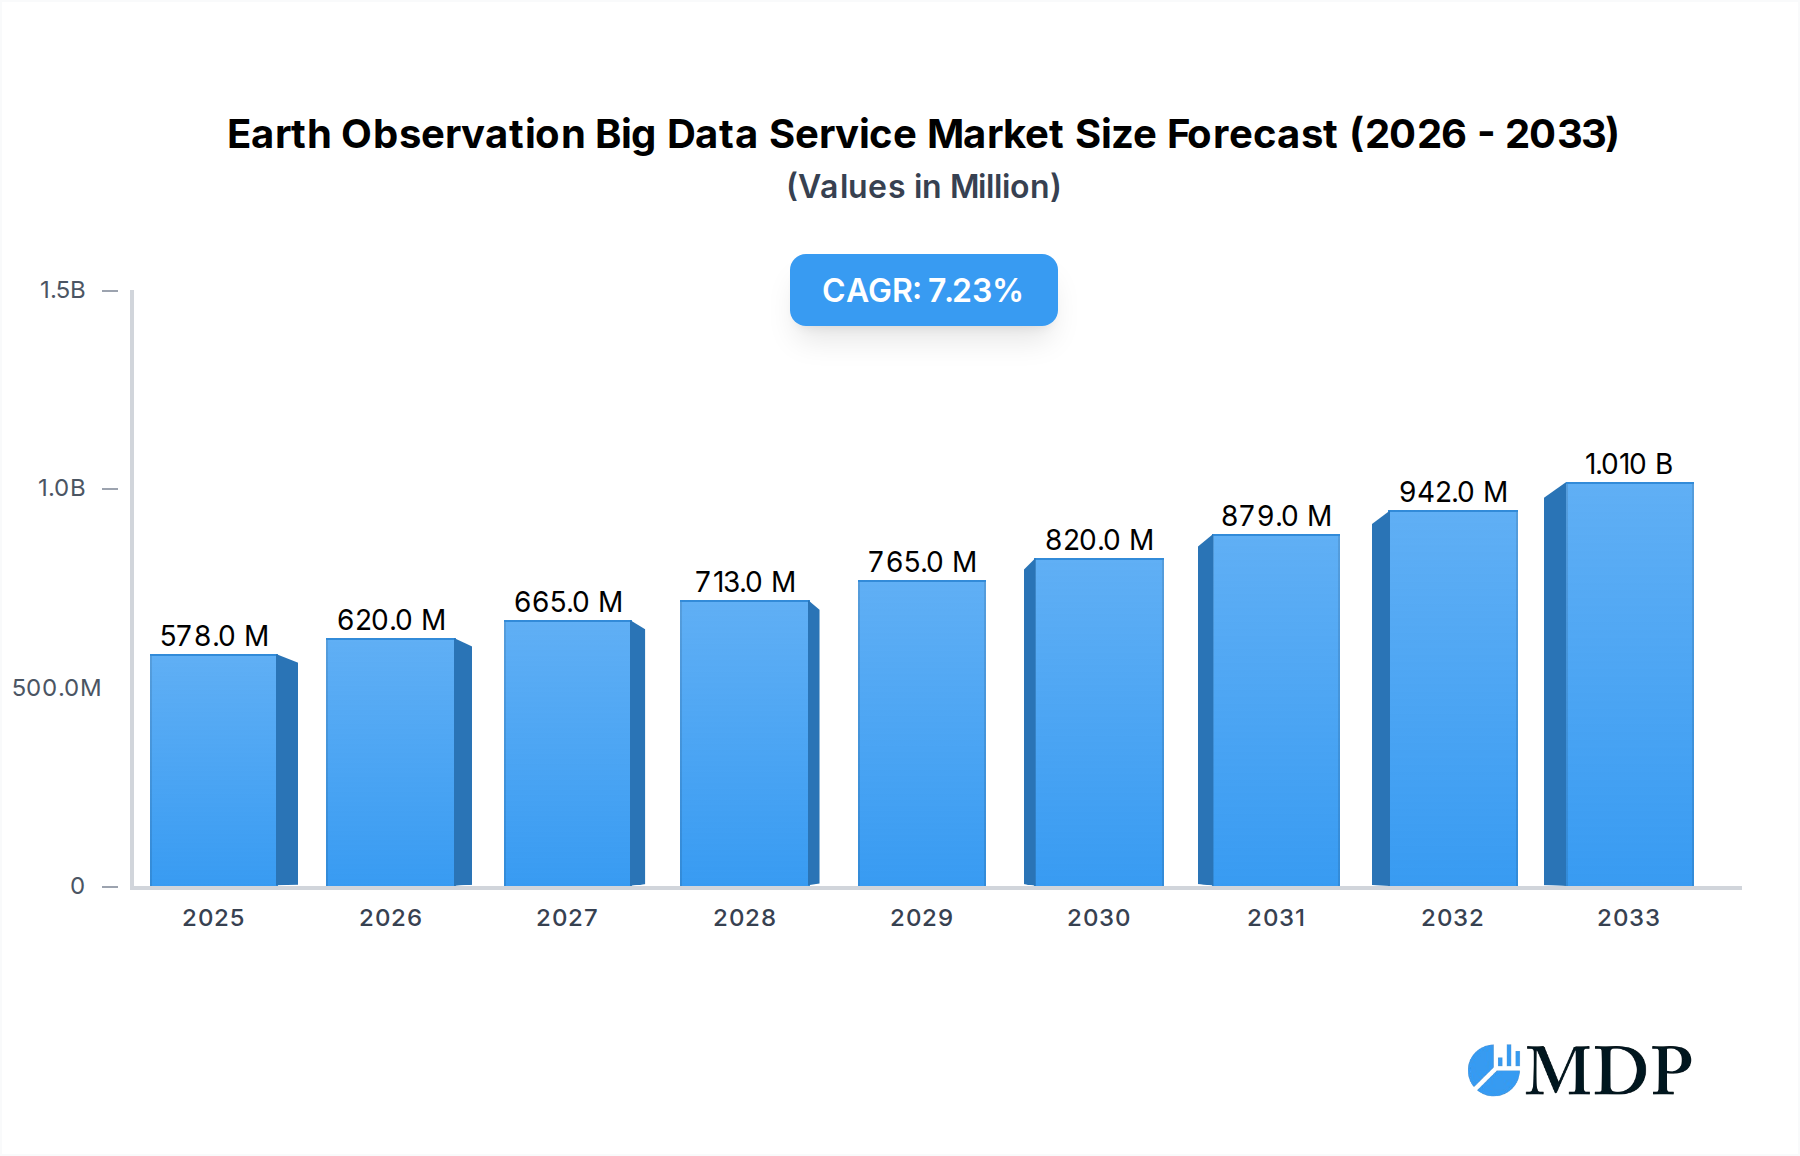
The global Earth Observation Big Data Service market is projected to experience robust expansion, reaching an estimated $578 million by 2025. This growth is fueled by an anticipated Compound Annual Growth Rate (CAGR) of 7.3% during the forecast period of 2025-2033. Key drivers for this surge include the increasing demand for actionable insights from satellite imagery and aerial data across diverse sectors. Environmental protection initiatives, such as climate change monitoring, disaster management, and resource assessment, are increasingly relying on earth observation data. Similarly, land planning and urban development projects leverage this technology for better infrastructure management and spatial analysis. The agricultural sector is benefiting significantly through precision farming, crop health monitoring, and yield prediction, further augmenting market growth. The advent of advanced analytics, AI, and machine learning applied to vast datasets from satellites and drones is unlocking new possibilities and driving innovation within the market.

Earth Observation Big Data Service Market Size (In Million)
The market segmentation reveals a dynamic landscape, with Infrastructure-as-a-Service (IaaS), Platform-as-a-Service (PaaS), and Software-as-a-Service (SaaS) models offering varied levels of accessibility and functionality to end-users. These service models are crucial in enabling diverse applications, from large-scale governmental projects in environmental protection to specialized agricultural finance services. Emerging trends point towards the integration of real-time data processing and the development of user-friendly platforms that democratize access to earth observation insights. However, challenges such as high data acquisition costs, the need for specialized analytical skills, and data privacy concerns could potentially restrain the market's full potential. Leading companies are actively investing in R&D and strategic partnerships to overcome these hurdles and capture market share across key regions like North America, Europe, and Asia Pacific.
Earth Observation Big Data Service Company Market Share
Unleash the Power of Space: Earth Observation Big Data Service Market Report 2025-2033
This comprehensive report, "Earth Observation Big Data Service Market Dynamics & Concentration," offers an in-depth analysis of the rapidly evolving Earth Observation (EO) Big Data service landscape. Spanning the historical period of 2019-2024 and projecting growth through 2033, this study is an indispensable resource for industry stakeholders seeking to navigate the complexities of this high-growth sector. We provide actionable insights into market concentration, innovation drivers, regulatory frameworks, and the competitive strategies of key players like GAF, EuroSense, Planet Labs, Descartes Labs, Premise, Slingshot Aerospace, Azavea Inc, Orbital Insight, and Ecometrica. With a base year of 2025, our analysis meticulously details market share across critical applications such as Environmental Protection, Land Planning, and Agricultural Finance, and across service models including IaaS, PaaS, and SaaS. Understand the pivotal role of M&A activities, with an estimated XX million in deal value, and gain a competitive edge in a market projected to witness substantial expansion.
Earth Observation Big Data Service Market Dynamics & Concentration
The Earth Observation Big Data Service market is characterized by a dynamic interplay of innovation, regulation, and evolving end-user demands. Market concentration is moderate, with several key players like Planet Labs and Descartes Labs holding significant shares, alongside a growing number of specialized providers. Innovation is a primary driver, fueled by advancements in satellite technology, AI-powered analytics, and cloud computing, enabling the processing of petabytes of geospatial data. Regulatory frameworks, though sometimes complex, are increasingly supportive of data sharing and application development, particularly in areas like climate change monitoring and disaster response. Product substitutes, such as on-the-ground data collection methods, are gradually being outpaced by the scalability and comprehensive coverage offered by EO Big Data. End-user trends reveal a strong demand for actionable insights in Environmental Protection, Land Planning, and Agricultural Finance, driving the adoption of IaaS, PaaS, and SaaS models. Mergers and Acquisitions (M&A) are a significant feature, with an estimated XX million in deal volume observed over the historical period, reflecting the consolidation and strategic expansion within the industry.
- Market Share Analysis: Key players dominate specific segments, with Planet Labs leading in satellite imagery acquisition and Descartes Labs in advanced analytics.
- Innovation Drivers: AI/ML for data processing, cloud-native platforms, and miniaturized satellite constellations.
- Regulatory Frameworks: Focus on data accessibility, privacy, and standardization across regions.
- Product Substitutes: Traditional surveying, manual data collection, and limited ground sensors.
- End-User Trends: Increasing reliance on EO data for risk assessment, resource management, and sustainability initiatives.
- M&A Activities: Strategic acquisitions aimed at expanding data portfolios, enhancing analytical capabilities, and securing market access.
Earth Observation Big Data Service Industry Trends & Analysis
The Earth Observation Big Data Service industry is poised for explosive growth, projected to achieve a Compound Annual Growth Rate (CAGR) of XX% from 2025 to 2033. This expansion is intrinsically linked to the increasing global need for comprehensive, real-time data to address critical challenges in environmental monitoring, urban planning, agriculture, and defense. Technological disruptions are at the forefront, with the proliferation of small satellites (smallsats) and constellations dramatically increasing data acquisition capacity and temporal resolution. This surge in data volume necessitates sophisticated big data analytics platforms, driving the demand for advanced AI and machine learning algorithms capable of extracting meaningful insights from vast, complex datasets. Consumer preferences are shifting towards end-to-end solutions, where raw imagery is transformed into actionable intelligence, fostering the growth of Platform-as-a-Service (PaaS) and Software-as-a-Service (SaaS) models. Infrastructure-as-a-Service (IaaS) remains crucial for handling the immense storage and processing requirements. Market penetration is deepening across various sectors, with governments and private enterprises alike recognizing the strategic value of EO data for informed decision-making. The competitive landscape is intensifying, marked by strategic partnerships between data providers, analytics firms, and end-users to co-develop innovative applications. For instance, the integration of climate data with agricultural yield predictions is revolutionizing crop insurance and food security planning. Similarly, detailed land-use mapping powered by EO Big Data is becoming indispensable for sustainable urban development and the management of natural resources. The increasing affordability of satellite data, coupled with the development of user-friendly analytical tools, is democratizing access to this powerful technology, further accelerating market adoption and driving significant economic opportunities globally.
Leading Markets & Segments in Earth Observation Big Data Service
The Earth Observation Big Data Service market exhibits strong regional dominance and segment penetration, driven by distinct economic, environmental, and regulatory factors. North America and Europe currently lead in market adoption, primarily due to substantial government investments in space programs, robust research and development infrastructure, and a mature private sector actively leveraging EO data.
Dominant Applications:
- Environmental Protection: This segment is experiencing unparalleled growth, fueled by global initiatives to combat climate change, monitor deforestation, track water resources, and manage natural disasters. Economic policies focused on sustainability and stringent environmental regulations are key drivers. The availability of high-resolution, frequent satellite imagery enables precise tracking of pollution levels, biodiversity loss, and the impact of extreme weather events, creating a significant demand for both IaaS for data storage and SaaS for specialized environmental analytics.
- Land Planning: Urbanization and infrastructure development worldwide necessitate accurate and up-to-date land-use mapping. EO Big Data provides critical information for zoning, real estate development, and monitoring urban sprawl. Government initiatives promoting smart cities and sustainable land management are pivotal. The ability to monitor changes in land cover and identify development patterns with high precision makes this a continuously expanding market.
- Agricultural Finance: The agricultural sector is increasingly reliant on EO data for precision farming, crop yield prediction, and risk assessment for financial institutions. Improving food security and optimizing agricultural resource management are paramount. This segment benefits from advancements in multispectral and hyperspectral imagery, enabling detailed analysis of crop health, soil moisture, and potential yield, thus mitigating financial risks for lenders and insurers.
Dominant Service Types:
- SaaS, Software-as-a-Service: This model is witnessing the most rapid growth, offering readily accessible, specialized applications for end-users without the need for extensive in-house IT infrastructure. Providers are developing tailored solutions for specific industries, such as crop analytics platforms for agriculture or environmental monitoring dashboards for government agencies.
- PaaS, Platform-as-a-Service: PaaS offerings provide a robust environment for developers and data scientists to build custom EO applications. This is crucial for fostering innovation and enabling more complex data integrations, such as combining EO data with IoT sensor data or socio-economic statistics.
- IaaS, Infrastructure-as-a-Service: While fundamental, IaaS is also evolving to meet the demands of big data processing. Cloud providers are offering specialized computing and storage solutions optimized for geospatial data, supporting the massive data volumes generated by EO missions.
The interconnectedness of these segments, for instance, using land planning data to inform environmental protection strategies or agricultural finance to promote sustainable land use, further solidifies the comprehensive value proposition of Earth Observation Big Data Services.
Earth Observation Big Data Service Product Developments
Product developments in the Earth Observation Big Data Service market are characterized by a relentless pursuit of higher resolution, increased revisit rates, and more sophisticated analytical capabilities. Innovations include the deployment of AI-powered algorithms for automated feature extraction, change detection, and predictive modeling, significantly reducing human interpretation time. Companies are developing integrated platforms that fuse satellite imagery with other data sources like aerial photography, drone data, and IoT sensor outputs, offering unparalleled contextual understanding. Competitive advantages are being forged through the development of specialized analytical tools for niche applications in environmental monitoring, urban resilience, and precision agriculture, alongside enhanced data processing speeds and cost-effectiveness.
Key Drivers of Earth Observation Big Data Service Growth
The growth of the Earth Observation Big Data Service market is propelled by a confluence of powerful drivers. Technological advancements, particularly in satellite technology (e.g., miniaturization, AI integration), are increasing data acquisition capabilities. Economic imperatives, such as the need for efficient resource management, climate change mitigation, and agricultural optimization, are creating substantial demand. Regulatory drivers, including government mandates for environmental monitoring and disaster preparedness, are also playing a crucial role. The increasing affordability of satellite data and cloud computing further democratizes access, making these services viable for a wider range of industries and organizations, from large enterprises to smaller research institutions.
Challenges in the Earth Observation Big Data Service Market
Despite its immense potential, the Earth Observation Big Data Service market faces several significant challenges. Data processing and storage costs remain a barrier for some organizations, particularly smaller entities, despite advancements in cloud technology. The integration of diverse datasets from various sources can be complex, requiring specialized expertise and standardization efforts. Furthermore, the evolving nature of regulatory frameworks across different regions can create compliance hurdles. Intense competition can lead to price pressures, impacting profitability for some providers. The need for skilled personnel proficient in geospatial data analysis, AI, and machine learning also presents a talent acquisition challenge, potentially limiting the pace of innovation and adoption.
Emerging Opportunities in Earth Observation Big Data Service
Emerging opportunities in the Earth Observation Big Data Service market are abundant and are being catalyzed by technological breakthroughs and strategic market expansion. The growing demand for climate intelligence and ESG (Environmental, Social, and Governance) reporting presents a significant avenue for growth, with companies leveraging EO data to monitor carbon emissions, deforestation, and sustainable resource utilization. The expansion of commercial space activities, including the development of private constellations, is further enhancing data availability and diversity. Strategic partnerships between data providers, AI developers, and end-users are fostering the creation of novel, integrated solutions for complex global challenges. Furthermore, the increasing adoption of EO data in developing nations for agricultural development, disaster management, and infrastructure planning offers substantial untapped market potential.
Leading Players in the Earth Observation Big Data Service Sector
- GAF
- EuroSense
- Planet Labs
- Descartes Labs
- Premise
- Slingshot Aerospace
- Azavea Inc
- Orbital Insight
- Ecometrica
Key Milestones in Earth Observation Big Data Service Industry
- 2019: Increased deployment of small satellite constellations by private companies, enhancing revisit rates.
- 2020: Significant advancements in AI and machine learning algorithms for automated geospatial data analysis.
- 2021: Growing demand for EO data in climate change monitoring and ESG reporting.
- 2022: Major cloud providers enhance their geospatial data processing capabilities.
- 2023: Increased M&A activity as companies seek to consolidate market share and expand service offerings.
- 2024: Focus on developing integrated platforms that fuse satellite data with other data sources.
Strategic Outlook for Earth Observation Big Data Service Market
The strategic outlook for the Earth Observation Big Data Service market is exceptionally positive, driven by increasing global recognition of its indispensable role in addressing critical environmental, economic, and social challenges. Growth accelerators include the continuous miniaturization and cost reduction of satellite technology, coupled with rapid advancements in AI and machine learning for more sophisticated data interpretation. Strategic opportunities lie in developing specialized SaaS solutions tailored for emerging markets and specific industry needs, such as sustainable agriculture and urban resilience planning. Partnerships and collaborations will be key to creating comprehensive, end-to-end solutions that integrate diverse data streams and deliver actionable intelligence. The market is set to witness sustained expansion as more organizations realize the transformative power of Earth Observation Big Data for informed decision-making and sustainable development.
Earth Observation Big Data Service Segmentation
-
1. Application
- 1.1. Environmental Protection
- 1.2. Land Planning
- 1.3. Agricultural Finance
-
2. Types
- 2.1. IaaS, Infrastructure-as-a-Service
- 2.2. PaaS, Platform-as-a-Service
- 2.3. SaaS, Software-as-a-Service
Earth Observation Big Data Service Segmentation By Geography
-
1. North America
- 1.1. United States
- 1.2. Canada
- 1.3. Mexico
-
2. South America
- 2.1. Brazil
- 2.2. Argentina
- 2.3. Rest of South America
-
3. Europe
- 3.1. United Kingdom
- 3.2. Germany
- 3.3. France
- 3.4. Italy
- 3.5. Spain
- 3.6. Russia
- 3.7. Benelux
- 3.8. Nordics
- 3.9. Rest of Europe
-
4. Middle East & Africa
- 4.1. Turkey
- 4.2. Israel
- 4.3. GCC
- 4.4. North Africa
- 4.5. South Africa
- 4.6. Rest of Middle East & Africa
-
5. Asia Pacific
- 5.1. China
- 5.2. India
- 5.3. Japan
- 5.4. South Korea
- 5.5. ASEAN
- 5.6. Oceania
- 5.7. Rest of Asia Pacific
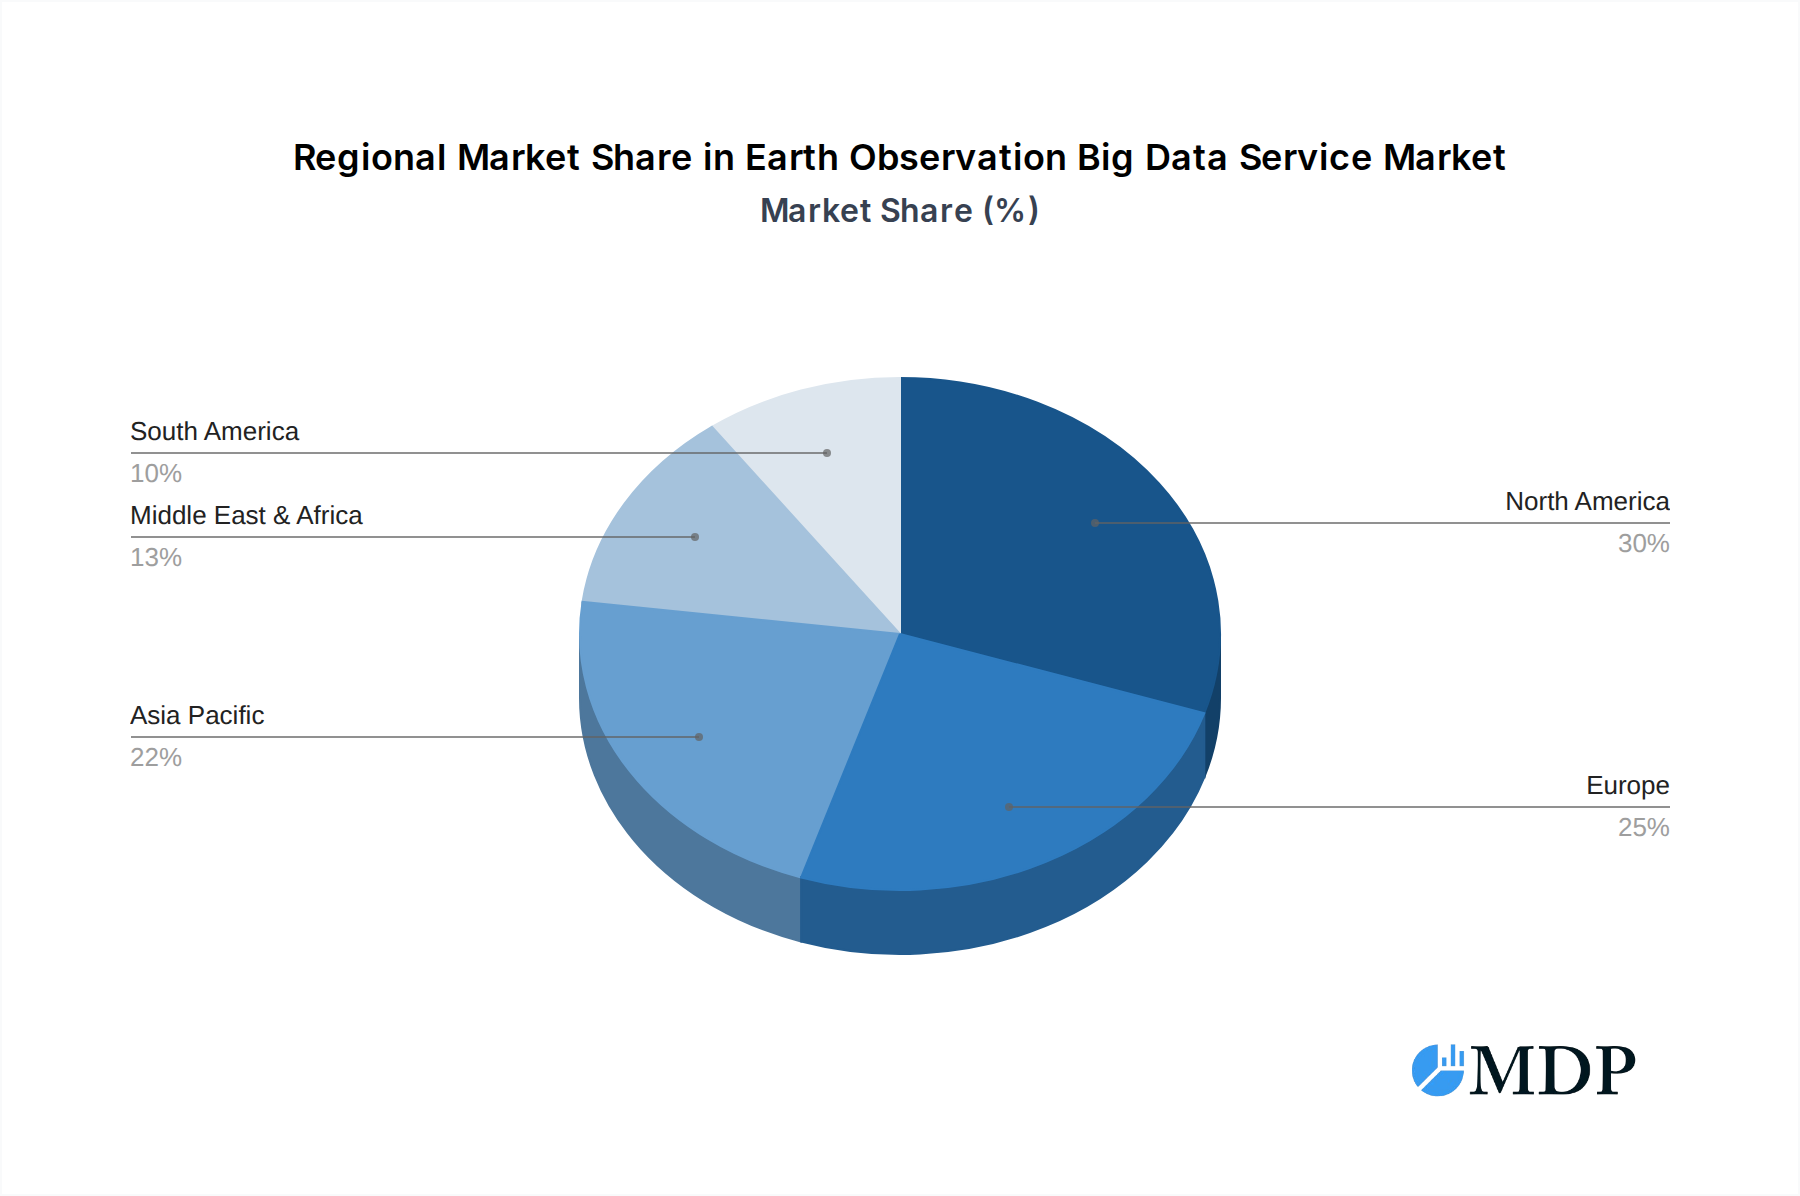
Earth Observation Big Data Service Regional Market Share
Geographic Coverage of Earth Observation Big Data Service
Earth Observation Big Data Service REPORT HIGHLIGHTS
| Aspects | Details |
|---|---|
| Study Period | 2020-2034 |
| Base Year | 2025 |
| Estimated Year | 2026 |
| Forecast Period | 2026-2034 |
| Historical Period | 2020-2025 |
| Growth Rate | CAGR of 7.3% from 2020-2034 |
| Segmentation |
|
Table of Contents
- 1. Introduction
- 1.1. Research Scope
- 1.2. Market Segmentation
- 1.3. Research Methodology
- 1.4. Definitions and Assumptions
- 2. Executive Summary
- 2.1. Introduction
- 3. Market Dynamics
- 3.1. Introduction
- 3.2. Market Drivers
- 3.3. Market Restrains
- 3.4. Market Trends
- 4. Market Factor Analysis
- 4.1. Porters Five Forces
- 4.2. Supply/Value Chain
- 4.3. PESTEL analysis
- 4.4. Market Entropy
- 4.5. Patent/Trademark Analysis
- 5. Global Earth Observation Big Data Service Analysis, Insights and Forecast, 2020-2032
- 5.1. Market Analysis, Insights and Forecast - by Application
- 5.1.1. Environmental Protection
- 5.1.2. Land Planning
- 5.1.3. Agricultural Finance
- 5.2. Market Analysis, Insights and Forecast - by Types
- 5.2.1. IaaS, Infrastructure-as-a-Service
- 5.2.2. PaaS, Platform-as-a-Service
- 5.2.3. SaaS, Software-as-a-Service
- 5.3. Market Analysis, Insights and Forecast - by Region
- 5.3.1. North America
- 5.3.2. South America
- 5.3.3. Europe
- 5.3.4. Middle East & Africa
- 5.3.5. Asia Pacific
- 5.1. Market Analysis, Insights and Forecast - by Application
- 6. North America Earth Observation Big Data Service Analysis, Insights and Forecast, 2020-2032
- 6.1. Market Analysis, Insights and Forecast - by Application
- 6.1.1. Environmental Protection
- 6.1.2. Land Planning
- 6.1.3. Agricultural Finance
- 6.2. Market Analysis, Insights and Forecast - by Types
- 6.2.1. IaaS, Infrastructure-as-a-Service
- 6.2.2. PaaS, Platform-as-a-Service
- 6.2.3. SaaS, Software-as-a-Service
- 6.1. Market Analysis, Insights and Forecast - by Application
- 7. South America Earth Observation Big Data Service Analysis, Insights and Forecast, 2020-2032
- 7.1. Market Analysis, Insights and Forecast - by Application
- 7.1.1. Environmental Protection
- 7.1.2. Land Planning
- 7.1.3. Agricultural Finance
- 7.2. Market Analysis, Insights and Forecast - by Types
- 7.2.1. IaaS, Infrastructure-as-a-Service
- 7.2.2. PaaS, Platform-as-a-Service
- 7.2.3. SaaS, Software-as-a-Service
- 7.1. Market Analysis, Insights and Forecast - by Application
- 8. Europe Earth Observation Big Data Service Analysis, Insights and Forecast, 2020-2032
- 8.1. Market Analysis, Insights and Forecast - by Application
- 8.1.1. Environmental Protection
- 8.1.2. Land Planning
- 8.1.3. Agricultural Finance
- 8.2. Market Analysis, Insights and Forecast - by Types
- 8.2.1. IaaS, Infrastructure-as-a-Service
- 8.2.2. PaaS, Platform-as-a-Service
- 8.2.3. SaaS, Software-as-a-Service
- 8.1. Market Analysis, Insights and Forecast - by Application
- 9. Middle East & Africa Earth Observation Big Data Service Analysis, Insights and Forecast, 2020-2032
- 9.1. Market Analysis, Insights and Forecast - by Application
- 9.1.1. Environmental Protection
- 9.1.2. Land Planning
- 9.1.3. Agricultural Finance
- 9.2. Market Analysis, Insights and Forecast - by Types
- 9.2.1. IaaS, Infrastructure-as-a-Service
- 9.2.2. PaaS, Platform-as-a-Service
- 9.2.3. SaaS, Software-as-a-Service
- 9.1. Market Analysis, Insights and Forecast - by Application
- 10. Asia Pacific Earth Observation Big Data Service Analysis, Insights and Forecast, 2020-2032
- 10.1. Market Analysis, Insights and Forecast - by Application
- 10.1.1. Environmental Protection
- 10.1.2. Land Planning
- 10.1.3. Agricultural Finance
- 10.2. Market Analysis, Insights and Forecast - by Types
- 10.2.1. IaaS, Infrastructure-as-a-Service
- 10.2.2. PaaS, Platform-as-a-Service
- 10.2.3. SaaS, Software-as-a-Service
- 10.1. Market Analysis, Insights and Forecast - by Application
- 11. Competitive Analysis
- 11.1. Global Market Share Analysis 2025
- 11.2. Company Profiles
- 11.2.1 GAF
- 11.2.1.1. Overview
- 11.2.1.2. Products
- 11.2.1.3. SWOT Analysis
- 11.2.1.4. Recent Developments
- 11.2.1.5. Financials (Based on Availability)
- 11.2.2 Eurosense
- 11.2.2.1. Overview
- 11.2.2.2. Products
- 11.2.2.3. SWOT Analysis
- 11.2.2.4. Recent Developments
- 11.2.2.5. Financials (Based on Availability)
- 11.2.3 Planet Labs
- 11.2.3.1. Overview
- 11.2.3.2. Products
- 11.2.3.3. SWOT Analysis
- 11.2.3.4. Recent Developments
- 11.2.3.5. Financials (Based on Availability)
- 11.2.4 Descartes Labs
- 11.2.4.1. Overview
- 11.2.4.2. Products
- 11.2.4.3. SWOT Analysis
- 11.2.4.4. Recent Developments
- 11.2.4.5. Financials (Based on Availability)
- 11.2.5 Premise
- 11.2.5.1. Overview
- 11.2.5.2. Products
- 11.2.5.3. SWOT Analysis
- 11.2.5.4. Recent Developments
- 11.2.5.5. Financials (Based on Availability)
- 11.2.6 Slingshot Aerospace
- 11.2.6.1. Overview
- 11.2.6.2. Products
- 11.2.6.3. SWOT Analysis
- 11.2.6.4. Recent Developments
- 11.2.6.5. Financials (Based on Availability)
- 11.2.7 Azavea Inc
- 11.2.7.1. Overview
- 11.2.7.2. Products
- 11.2.7.3. SWOT Analysis
- 11.2.7.4. Recent Developments
- 11.2.7.5. Financials (Based on Availability)
- 11.2.8 Orbital Insight
- 11.2.8.1. Overview
- 11.2.8.2. Products
- 11.2.8.3. SWOT Analysis
- 11.2.8.4. Recent Developments
- 11.2.8.5. Financials (Based on Availability)
- 11.2.9 Ecometrica
- 11.2.9.1. Overview
- 11.2.9.2. Products
- 11.2.9.3. SWOT Analysis
- 11.2.9.4. Recent Developments
- 11.2.9.5. Financials (Based on Availability)
- 11.2.1 GAF
List of Figures
- Figure 1: Global Earth Observation Big Data Service Revenue Breakdown (million, %) by Region 2025 & 2033
- Figure 2: North America Earth Observation Big Data Service Revenue (million), by Application 2025 & 2033
- Figure 3: North America Earth Observation Big Data Service Revenue Share (%), by Application 2025 & 2033
- Figure 4: North America Earth Observation Big Data Service Revenue (million), by Types 2025 & 2033
- Figure 5: North America Earth Observation Big Data Service Revenue Share (%), by Types 2025 & 2033
- Figure 6: North America Earth Observation Big Data Service Revenue (million), by Country 2025 & 2033
- Figure 7: North America Earth Observation Big Data Service Revenue Share (%), by Country 2025 & 2033
- Figure 8: South America Earth Observation Big Data Service Revenue (million), by Application 2025 & 2033
- Figure 9: South America Earth Observation Big Data Service Revenue Share (%), by Application 2025 & 2033
- Figure 10: South America Earth Observation Big Data Service Revenue (million), by Types 2025 & 2033
- Figure 11: South America Earth Observation Big Data Service Revenue Share (%), by Types 2025 & 2033
- Figure 12: South America Earth Observation Big Data Service Revenue (million), by Country 2025 & 2033
- Figure 13: South America Earth Observation Big Data Service Revenue Share (%), by Country 2025 & 2033
- Figure 14: Europe Earth Observation Big Data Service Revenue (million), by Application 2025 & 2033
- Figure 15: Europe Earth Observation Big Data Service Revenue Share (%), by Application 2025 & 2033
- Figure 16: Europe Earth Observation Big Data Service Revenue (million), by Types 2025 & 2033
- Figure 17: Europe Earth Observation Big Data Service Revenue Share (%), by Types 2025 & 2033
- Figure 18: Europe Earth Observation Big Data Service Revenue (million), by Country 2025 & 2033
- Figure 19: Europe Earth Observation Big Data Service Revenue Share (%), by Country 2025 & 2033
- Figure 20: Middle East & Africa Earth Observation Big Data Service Revenue (million), by Application 2025 & 2033
- Figure 21: Middle East & Africa Earth Observation Big Data Service Revenue Share (%), by Application 2025 & 2033
- Figure 22: Middle East & Africa Earth Observation Big Data Service Revenue (million), by Types 2025 & 2033
- Figure 23: Middle East & Africa Earth Observation Big Data Service Revenue Share (%), by Types 2025 & 2033
- Figure 24: Middle East & Africa Earth Observation Big Data Service Revenue (million), by Country 2025 & 2033
- Figure 25: Middle East & Africa Earth Observation Big Data Service Revenue Share (%), by Country 2025 & 2033
- Figure 26: Asia Pacific Earth Observation Big Data Service Revenue (million), by Application 2025 & 2033
- Figure 27: Asia Pacific Earth Observation Big Data Service Revenue Share (%), by Application 2025 & 2033
- Figure 28: Asia Pacific Earth Observation Big Data Service Revenue (million), by Types 2025 & 2033
- Figure 29: Asia Pacific Earth Observation Big Data Service Revenue Share (%), by Types 2025 & 2033
- Figure 30: Asia Pacific Earth Observation Big Data Service Revenue (million), by Country 2025 & 2033
- Figure 31: Asia Pacific Earth Observation Big Data Service Revenue Share (%), by Country 2025 & 2033
List of Tables
- Table 1: Global Earth Observation Big Data Service Revenue million Forecast, by Application 2020 & 2033
- Table 2: Global Earth Observation Big Data Service Revenue million Forecast, by Types 2020 & 2033
- Table 3: Global Earth Observation Big Data Service Revenue million Forecast, by Region 2020 & 2033
- Table 4: Global Earth Observation Big Data Service Revenue million Forecast, by Application 2020 & 2033
- Table 5: Global Earth Observation Big Data Service Revenue million Forecast, by Types 2020 & 2033
- Table 6: Global Earth Observation Big Data Service Revenue million Forecast, by Country 2020 & 2033
- Table 7: United States Earth Observation Big Data Service Revenue (million) Forecast, by Application 2020 & 2033
- Table 8: Canada Earth Observation Big Data Service Revenue (million) Forecast, by Application 2020 & 2033
- Table 9: Mexico Earth Observation Big Data Service Revenue (million) Forecast, by Application 2020 & 2033
- Table 10: Global Earth Observation Big Data Service Revenue million Forecast, by Application 2020 & 2033
- Table 11: Global Earth Observation Big Data Service Revenue million Forecast, by Types 2020 & 2033
- Table 12: Global Earth Observation Big Data Service Revenue million Forecast, by Country 2020 & 2033
- Table 13: Brazil Earth Observation Big Data Service Revenue (million) Forecast, by Application 2020 & 2033
- Table 14: Argentina Earth Observation Big Data Service Revenue (million) Forecast, by Application 2020 & 2033
- Table 15: Rest of South America Earth Observation Big Data Service Revenue (million) Forecast, by Application 2020 & 2033
- Table 16: Global Earth Observation Big Data Service Revenue million Forecast, by Application 2020 & 2033
- Table 17: Global Earth Observation Big Data Service Revenue million Forecast, by Types 2020 & 2033
- Table 18: Global Earth Observation Big Data Service Revenue million Forecast, by Country 2020 & 2033
- Table 19: United Kingdom Earth Observation Big Data Service Revenue (million) Forecast, by Application 2020 & 2033
- Table 20: Germany Earth Observation Big Data Service Revenue (million) Forecast, by Application 2020 & 2033
- Table 21: France Earth Observation Big Data Service Revenue (million) Forecast, by Application 2020 & 2033
- Table 22: Italy Earth Observation Big Data Service Revenue (million) Forecast, by Application 2020 & 2033
- Table 23: Spain Earth Observation Big Data Service Revenue (million) Forecast, by Application 2020 & 2033
- Table 24: Russia Earth Observation Big Data Service Revenue (million) Forecast, by Application 2020 & 2033
- Table 25: Benelux Earth Observation Big Data Service Revenue (million) Forecast, by Application 2020 & 2033
- Table 26: Nordics Earth Observation Big Data Service Revenue (million) Forecast, by Application 2020 & 2033
- Table 27: Rest of Europe Earth Observation Big Data Service Revenue (million) Forecast, by Application 2020 & 2033
- Table 28: Global Earth Observation Big Data Service Revenue million Forecast, by Application 2020 & 2033
- Table 29: Global Earth Observation Big Data Service Revenue million Forecast, by Types 2020 & 2033
- Table 30: Global Earth Observation Big Data Service Revenue million Forecast, by Country 2020 & 2033
- Table 31: Turkey Earth Observation Big Data Service Revenue (million) Forecast, by Application 2020 & 2033
- Table 32: Israel Earth Observation Big Data Service Revenue (million) Forecast, by Application 2020 & 2033
- Table 33: GCC Earth Observation Big Data Service Revenue (million) Forecast, by Application 2020 & 2033
- Table 34: North Africa Earth Observation Big Data Service Revenue (million) Forecast, by Application 2020 & 2033
- Table 35: South Africa Earth Observation Big Data Service Revenue (million) Forecast, by Application 2020 & 2033
- Table 36: Rest of Middle East & Africa Earth Observation Big Data Service Revenue (million) Forecast, by Application 2020 & 2033
- Table 37: Global Earth Observation Big Data Service Revenue million Forecast, by Application 2020 & 2033
- Table 38: Global Earth Observation Big Data Service Revenue million Forecast, by Types 2020 & 2033
- Table 39: Global Earth Observation Big Data Service Revenue million Forecast, by Country 2020 & 2033
- Table 40: China Earth Observation Big Data Service Revenue (million) Forecast, by Application 2020 & 2033
- Table 41: India Earth Observation Big Data Service Revenue (million) Forecast, by Application 2020 & 2033
- Table 42: Japan Earth Observation Big Data Service Revenue (million) Forecast, by Application 2020 & 2033
- Table 43: South Korea Earth Observation Big Data Service Revenue (million) Forecast, by Application 2020 & 2033
- Table 44: ASEAN Earth Observation Big Data Service Revenue (million) Forecast, by Application 2020 & 2033
- Table 45: Oceania Earth Observation Big Data Service Revenue (million) Forecast, by Application 2020 & 2033
- Table 46: Rest of Asia Pacific Earth Observation Big Data Service Revenue (million) Forecast, by Application 2020 & 2033
Frequently Asked Questions
1. What is the projected Compound Annual Growth Rate (CAGR) of the Earth Observation Big Data Service?
The projected CAGR is approximately 7.3%.
2. Which companies are prominent players in the Earth Observation Big Data Service?
Key companies in the market include GAF, Eurosense, Planet Labs, Descartes Labs, Premise, Slingshot Aerospace, Azavea Inc, Orbital Insight, Ecometrica.
3. What are the main segments of the Earth Observation Big Data Service?
The market segments include Application, Types.
4. Can you provide details about the market size?
The market size is estimated to be USD 578 million as of 2022.
5. What are some drivers contributing to market growth?
N/A
6. What are the notable trends driving market growth?
N/A
7. Are there any restraints impacting market growth?
N/A
8. Can you provide examples of recent developments in the market?
N/A
9. What pricing options are available for accessing the report?
Pricing options include single-user, multi-user, and enterprise licenses priced at USD 4900.00, USD 7350.00, and USD 9800.00 respectively.
10. Is the market size provided in terms of value or volume?
The market size is provided in terms of value, measured in million.
11. Are there any specific market keywords associated with the report?
Yes, the market keyword associated with the report is "Earth Observation Big Data Service," which aids in identifying and referencing the specific market segment covered.
12. How do I determine which pricing option suits my needs best?
The pricing options vary based on user requirements and access needs. Individual users may opt for single-user licenses, while businesses requiring broader access may choose multi-user or enterprise licenses for cost-effective access to the report.
13. Are there any additional resources or data provided in the Earth Observation Big Data Service report?
While the report offers comprehensive insights, it's advisable to review the specific contents or supplementary materials provided to ascertain if additional resources or data are available.
14. How can I stay updated on further developments or reports in the Earth Observation Big Data Service?
To stay informed about further developments, trends, and reports in the Earth Observation Big Data Service, consider subscribing to industry newsletters, following relevant companies and organizations, or regularly checking reputable industry news sources and publications.
Methodology
Step 1 - Identification of Relevant Samples Size from Population Database


Step 2 - Approaches for Defining Global Market Size (Value, Volume* & Price*)

Note*: In applicable scenarios
Step 3 - Data Sources
Primary Research
- Web Analytics
- Survey Reports
- Research Institute
- Latest Research Reports
- Opinion Leaders
Secondary Research
- Annual Reports
- White Paper
- Latest Press Release
- Industry Association
- Paid Database
- Investor Presentations

Step 4 - Data Triangulation
Involves using different sources of information in order to increase the validity of a study
These sources are likely to be stakeholders in a program - participants, other researchers, program staff, other community members, and so on.
Then we put all data in single framework & apply various statistical tools to find out the dynamic on the market.
During the analysis stage, feedback from the stakeholder groups would be compared to determine areas of agreement as well as areas of divergence