

Key Insights
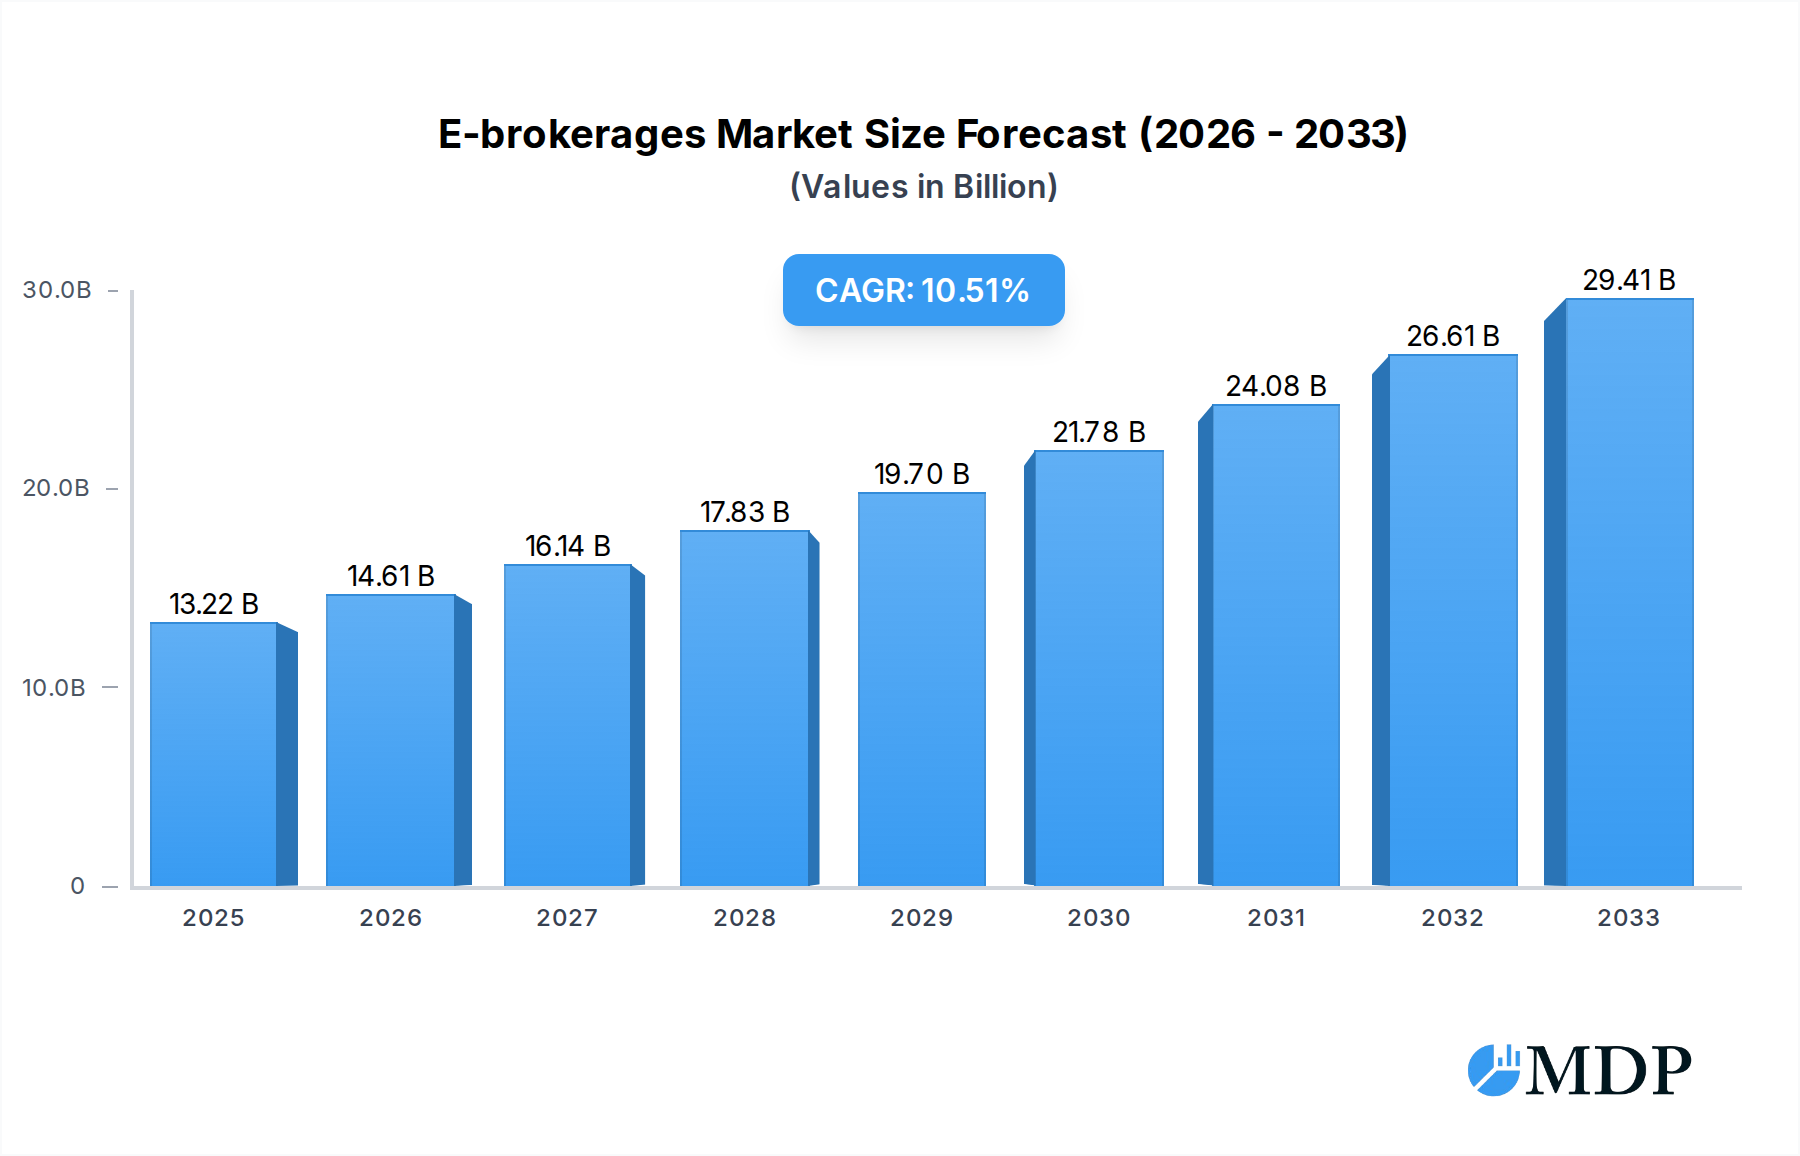
The global E-brokerage market is poised for substantial growth, projected to reach an estimated $13.22 billion in 2025. This impressive expansion is driven by a robust compound annual growth rate (CAGR) of 10.5% throughout the forecast period (2025-2033). This upward trajectory is fueled by several key factors, including the increasing adoption of digital platforms for financial trading, a growing young and tech-savvy population entering the investment landscape, and the continuous innovation in trading technologies that offer enhanced user experiences and accessibility. The surge in retail investing, amplified by the ease of access provided by online brokerage platforms, is a significant catalyst. Furthermore, the growing demand for diverse investment options, encompassing stocks and forex, along with the emergence of specialized platforms catering to specific trading needs, are contributing to this market's dynamism. The convenience, lower transaction costs, and broader market access offered by e-brokerages are making them the preferred choice for both novice and experienced investors.

E-brokerages Market Size (In Billion)
The e-brokerage landscape is characterized by a bifurcated market structure, with full-time brokers dominating the market due to their comprehensive service offerings, including research, advisory, and a wider array of financial instruments. However, discount brokers are rapidly gaining traction by offering cost-effective trading solutions, attracting a segment of the market focused on fee minimization. Geographically, North America, particularly the United States, is a leading market, driven by its mature financial infrastructure and high investor participation. Asia Pacific, fueled by the rapid economic growth of countries like China and India, alongside a burgeoning middle class with increasing disposable income, presents a significant opportunity for market expansion. Emerging trends like the integration of artificial intelligence for personalized trading advice, the rise of social trading platforms, and the increasing focus on mobile trading applications are further shaping the competitive environment and driving innovation within the e-brokerage sector. While the market is robust, potential restraints might include evolving regulatory landscapes and cybersecurity concerns, which will require strategic navigation by market players.
E-brokerages Company Market Share
E-brokerages Market: Comprehensive Analysis & Strategic Outlook (2019-2033)
This in-depth report offers an exhaustive analysis of the global e-brokerages market, exploring its dynamic evolution, key trends, and future trajectory. Covering the period from 2019 to 2033, with a base and estimated year of 2025, this study provides invaluable insights for industry stakeholders, investors, and financial professionals seeking to understand and capitalize on the burgeoning online trading landscape. We delve into market concentration, technological innovations, regulatory shifts, and consumer preferences, offering actionable intelligence on market drivers, challenges, and emerging opportunities. The report examines leading e-brokerages such as Interactive Brokers, Charles Schwab, Fidelity Investments, TD Ameritrade, E-Trade, TastyWorks, Etoro, X-Trade Brokers, IC Markets, Eoption, and First Prudential Markets across segments like Stock, Forex, and Other applications, and types including Full Time Brokers and Discount Brokers.
E-brokerages Market Dynamics & Concentration
The e-brokerages market exhibits a dynamic landscape characterized by evolving concentration levels driven by technological advancements and increasing regulatory scrutiny. Innovation is a constant, with companies continually investing in platform enhancements, mobile trading capabilities, and AI-driven tools to attract and retain clients. Regulatory frameworks worldwide are adapting to the digital shift, influencing compliance requirements and market access. Product substitutes, such as direct investment platforms and robo-advisors, present ongoing competition, forcing e-brokerages to differentiate through service and features. End-user trends reveal a growing demand for user-friendly interfaces, fractional shares, and commission-free trading, particularly among younger demographics. Mergers and acquisitions (M&A) play a crucial role in shaping market concentration, with significant consolidation observed as larger players acquire smaller, innovative firms. The historical M&A deal count has been approximately 350, indicating robust activity. Market share distribution is dynamic, with leading firms like Charles Schwab holding an estimated 15% of the market share, followed closely by Fidelity Investments at 12% and Interactive Brokers at 10%, reflecting intense competition for dominance.
E-brokerages Industry Trends & Analysis
The e-brokerages industry is poised for substantial growth, driven by a confluence of factors including increasing financial literacy, widespread internet penetration, and the democratization of investment opportunities. The compound annual growth rate (CAGR) is projected to be around 12%, indicating a robust expansion trajectory for the forecast period of 2025–2033. Technological disruptions are at the forefront, with advancements in artificial intelligence, blockchain technology, and cloud computing transforming trading platforms, enhancing algorithmic trading capabilities, and offering personalized investment advice. Consumer preferences are rapidly shifting towards intuitive, mobile-first trading experiences, with a strong emphasis on commission-free trading, fractional shares, and access to a diverse range of asset classes, including stocks, ETFs, options, forex, and cryptocurrencies. The competitive dynamics are intensifying, with both established financial institutions and nimble fintech startups vying for market share. Market penetration, currently standing at an estimated 60% in developed economies, is expected to rise significantly as emerging markets adopt digital financial solutions. The increasing ease of access and reduced barriers to entry have empowered retail investors, leading to a surge in trading volumes. Furthermore, the ongoing evolution of payment gateways and secure transaction processing is fostering greater trust and adoption of online trading platforms. The integration of social trading features and educational resources is also proving instrumental in engaging new investors and fostering long-term loyalty.
Leading Markets & Segments in E-brokerages
The North American region consistently emerges as the dominant market for e-brokerages, largely propelled by the economic policies and robust financial infrastructure of the United States and Canada. Within this region, the Stock application segment commands the largest market share, driven by the sheer volume of publicly traded companies and a deeply ingrained culture of equity investing. The Discount Brokers type further solidifies this dominance, as a significant portion of retail investors gravitates towards platforms offering low-cost or commission-free trading, making investing more accessible.
- Key Drivers of Dominance (North America - Stock Application - Discount Brokers):
- Economic Policies: Favorable regulatory environments and supportive economic policies in the US and Canada have fostered a dynamic and accessible stock market.
- Investor Demographics: A large, tech-savvy population with increasing disposable income and a growing interest in wealth accumulation through stock investments.
- Technological Infrastructure: Advanced internet connectivity and mobile penetration enable seamless access to trading platforms.
- Availability of Diverse Products: A wide array of publicly traded stocks, ETFs, and other equity-related instruments cater to varied investment strategies.
- Competitive Landscape: Intense competition among discount brokers has driven down costs and improved user experience, making stock trading highly attractive.
The Forex segment, while significant, demonstrates a more global distribution, with strong presence in Europe and Asia. The Other applications, encompassing cryptocurrencies and other alternative investments, are experiencing rapid growth and are characterized by higher volatility and a younger, more speculative investor base. Full-time brokers, while still holding a substantial market share due to their comprehensive service offerings, face increasing competition from specialized discount brokers that cater to specific investment needs and preferences, particularly in the stock and forex markets. The ongoing trend towards self-directed investing continues to fuel the growth of discount brokerage platforms across all application segments.
E-brokerages Product Developments
Product innovations in the e-brokerages sector are primarily focused on enhancing user experience and expanding investment capabilities. Key developments include sophisticated mobile trading applications offering real-time market data, advanced charting tools, and seamless order execution. The integration of AI-powered robo-advisory services provides personalized investment recommendations and automated portfolio management. Furthermore, the introduction of fractional share trading has democratized access to high-priced stocks, attracting a wider range of investors. Competitive advantages are being forged through unique offerings such as social trading features, educational resources, and seamless integration with banking and payment services, fostering a holistic financial management ecosystem for users.
Key Drivers of E-brokerages Growth
The e-brokerages market is propelled by several potent growth drivers. Technological advancements, including the proliferation of smartphones and high-speed internet, have made online trading more accessible and convenient than ever before. Increasing financial literacy and a growing desire for wealth creation among retail investors, especially younger generations, are fueling demand for investment platforms. Favorable regulatory environments in many regions, which promote transparency and competition, further encourage market expansion. The continuous innovation in trading platforms, offering user-friendly interfaces and a wider range of tradable assets, also acts as a significant catalyst. The global shift towards digital financial services, accelerated by recent economic events, has firmly established e-brokerages as a mainstream investment channel.
Challenges in the E-brokerages Market
Despite robust growth, the e-brokerages market faces several challenges. Heightened regulatory scrutiny, particularly concerning investor protection and market manipulation, can lead to compliance costs and operational complexities. Intense competition from both established financial institutions and emerging fintech startups drives down profit margins and necessitates continuous investment in platform development and marketing. Cybersecurity threats and data breaches pose a significant risk, potentially eroding investor trust and leading to substantial financial and reputational damage. Furthermore, market volatility and economic downturns can lead to decreased trading volumes and investor confidence, impacting revenue streams. The global supply chain issues, while less direct, can indirectly affect the availability of specialized hardware or software crucial for platform operations.
Emerging Opportunities in E-brokerages
Emerging opportunities in the e-brokerages market lie in several key areas. The growing adoption of cryptocurrencies and decentralized finance (DeFi) presents a significant avenue for expansion, with e-brokerages able to integrate crypto trading and related services. Strategic partnerships with fintech companies and established financial institutions can unlock new customer segments and enhance service offerings. Market expansion into underserved emerging economies, where digital adoption is rapidly increasing, offers substantial growth potential. The development of more sophisticated AI-driven personalized investment tools and educational platforms can attract and retain a wider range of investors. Furthermore, leveraging blockchain technology for enhanced security, transparency, and efficient settlement processes can create a competitive edge.
Leading Players in the E-brokerages Sector
- Interactive Brokers
- Charles Schwab
- Fidelity Investments
- TD Ameritrade
- E-Trade
- TastyWorks
- Etoro
- X-Trade Brokers
- IC Markets
- Eoption
- First Prudential Markets
Key Milestones in E-brokerages Industry
- 2019: Introduction of commission-free trading by major players like Robinhood, significantly disrupting the industry and forcing others to follow suit.
- 2020: Surge in retail trading activity driven by market volatility and increased stay-at-home orders, leading to record account openings.
- 2021: Growing popularity of fractional share trading, enabling investors to buy portions of high-priced stocks.
- 2022: Increased focus on mobile trading platforms and user experience enhancements, with significant app updates and new feature rollouts.
- 2023: Regulatory discussions and implementations regarding payment for order flow (PFOF) and market structure.
- 2024: Expansion of cryptocurrency offerings and exploration of Web3 technologies by several leading e-brokerages.
Strategic Outlook for E-brokerages Market
The strategic outlook for the e-brokerages market is overwhelmingly positive, driven by continuous technological innovation and evolving investor behaviors. Key growth accelerators include the further integration of AI for personalized investment advice and risk management, the expansion into alternative asset classes beyond traditional stocks and forex, and the deepening engagement with retail investors through educational content and community features. Strategic partnerships and potential M&A activities will continue to shape the competitive landscape, leading to further consolidation and specialization. Companies that can effectively navigate regulatory complexities while prioritizing user experience, security, and innovative product development are best positioned for sustained success in this dynamic and expanding market.
E-brokerages Segmentation
-
1. Application
- 1.1. Stock
- 1.2. Forex
- 1.3. Other
-
2. Types
- 2.1. Full Time Brokers
- 2.2. Discount Brokers
E-brokerages Segmentation By Geography
-
1. North America
- 1.1. United States
- 1.2. Canada
- 1.3. Mexico
-
2. South America
- 2.1. Brazil
- 2.2. Argentina
- 2.3. Rest of South America
-
3. Europe
- 3.1. United Kingdom
- 3.2. Germany
- 3.3. France
- 3.4. Italy
- 3.5. Spain
- 3.6. Russia
- 3.7. Benelux
- 3.8. Nordics
- 3.9. Rest of Europe
-
4. Middle East & Africa
- 4.1. Turkey
- 4.2. Israel
- 4.3. GCC
- 4.4. North Africa
- 4.5. South Africa
- 4.6. Rest of Middle East & Africa
-
5. Asia Pacific
- 5.1. China
- 5.2. India
- 5.3. Japan
- 5.4. South Korea
- 5.5. ASEAN
- 5.6. Oceania
- 5.7. Rest of Asia Pacific
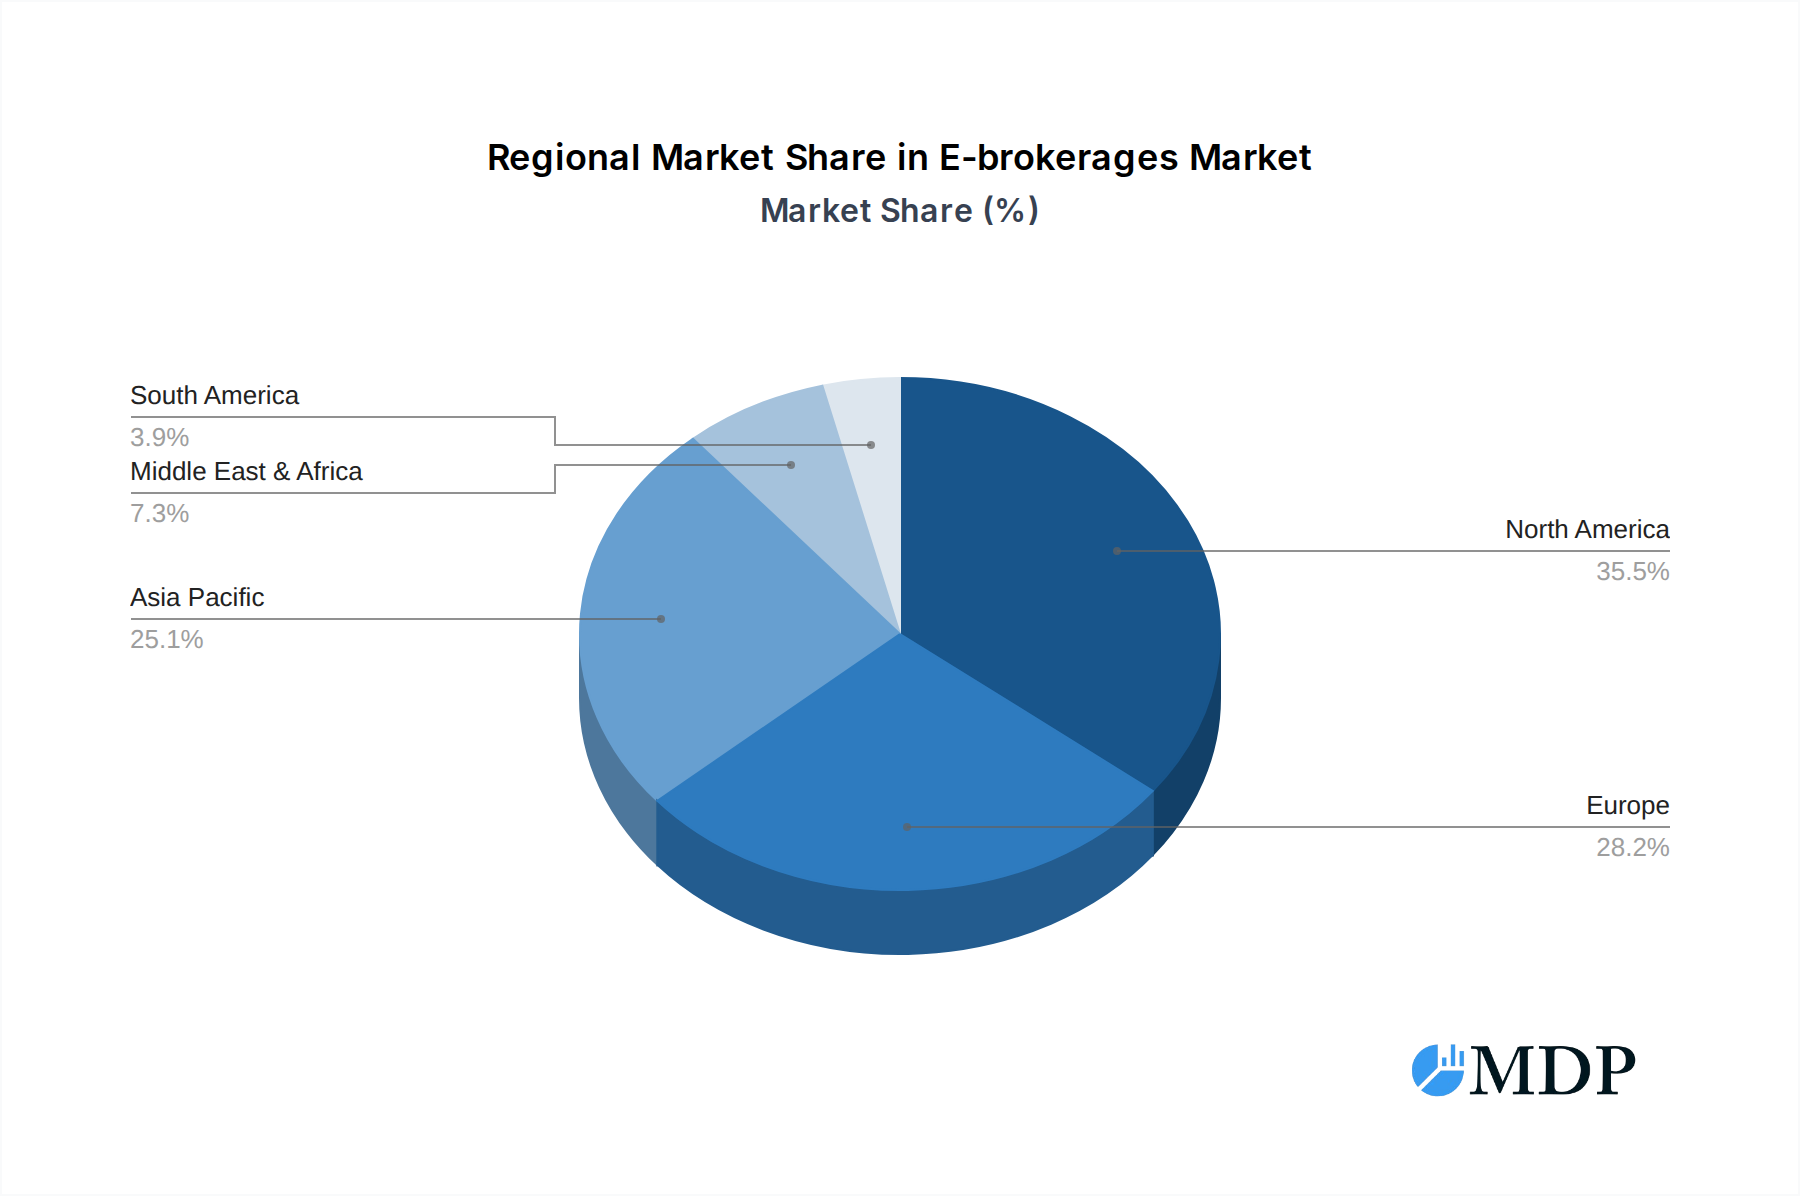
E-brokerages Regional Market Share
Geographic Coverage of E-brokerages
E-brokerages REPORT HIGHLIGHTS
| Aspects | Details |
|---|---|
| Study Period | 2020-2034 |
| Base Year | 2025 |
| Estimated Year | 2026 |
| Forecast Period | 2026-2034 |
| Historical Period | 2020-2025 |
| Growth Rate | CAGR of 10.5% from 2020-2034 |
| Segmentation |
|
Table of Contents
- 1. Introduction
- 1.1. Research Scope
- 1.2. Market Segmentation
- 1.3. Research Methodology
- 1.4. Definitions and Assumptions
- 2. Executive Summary
- 2.1. Introduction
- 3. Market Dynamics
- 3.1. Introduction
- 3.2. Market Drivers
- 3.3. Market Restrains
- 3.4. Market Trends
- 4. Market Factor Analysis
- 4.1. Porters Five Forces
- 4.2. Supply/Value Chain
- 4.3. PESTEL analysis
- 4.4. Market Entropy
- 4.5. Patent/Trademark Analysis
- 5. Global E-brokerages Analysis, Insights and Forecast, 2020-2032
- 5.1. Market Analysis, Insights and Forecast - by Application
- 5.1.1. Stock
- 5.1.2. Forex
- 5.1.3. Other
- 5.2. Market Analysis, Insights and Forecast - by Types
- 5.2.1. Full Time Brokers
- 5.2.2. Discount Brokers
- 5.3. Market Analysis, Insights and Forecast - by Region
- 5.3.1. North America
- 5.3.2. South America
- 5.3.3. Europe
- 5.3.4. Middle East & Africa
- 5.3.5. Asia Pacific
- 5.1. Market Analysis, Insights and Forecast - by Application
- 6. North America E-brokerages Analysis, Insights and Forecast, 2020-2032
- 6.1. Market Analysis, Insights and Forecast - by Application
- 6.1.1. Stock
- 6.1.2. Forex
- 6.1.3. Other
- 6.2. Market Analysis, Insights and Forecast - by Types
- 6.2.1. Full Time Brokers
- 6.2.2. Discount Brokers
- 6.1. Market Analysis, Insights and Forecast - by Application
- 7. South America E-brokerages Analysis, Insights and Forecast, 2020-2032
- 7.1. Market Analysis, Insights and Forecast - by Application
- 7.1.1. Stock
- 7.1.2. Forex
- 7.1.3. Other
- 7.2. Market Analysis, Insights and Forecast - by Types
- 7.2.1. Full Time Brokers
- 7.2.2. Discount Brokers
- 7.1. Market Analysis, Insights and Forecast - by Application
- 8. Europe E-brokerages Analysis, Insights and Forecast, 2020-2032
- 8.1. Market Analysis, Insights and Forecast - by Application
- 8.1.1. Stock
- 8.1.2. Forex
- 8.1.3. Other
- 8.2. Market Analysis, Insights and Forecast - by Types
- 8.2.1. Full Time Brokers
- 8.2.2. Discount Brokers
- 8.1. Market Analysis, Insights and Forecast - by Application
- 9. Middle East & Africa E-brokerages Analysis, Insights and Forecast, 2020-2032
- 9.1. Market Analysis, Insights and Forecast - by Application
- 9.1.1. Stock
- 9.1.2. Forex
- 9.1.3. Other
- 9.2. Market Analysis, Insights and Forecast - by Types
- 9.2.1. Full Time Brokers
- 9.2.2. Discount Brokers
- 9.1. Market Analysis, Insights and Forecast - by Application
- 10. Asia Pacific E-brokerages Analysis, Insights and Forecast, 2020-2032
- 10.1. Market Analysis, Insights and Forecast - by Application
- 10.1.1. Stock
- 10.1.2. Forex
- 10.1.3. Other
- 10.2. Market Analysis, Insights and Forecast - by Types
- 10.2.1. Full Time Brokers
- 10.2.2. Discount Brokers
- 10.1. Market Analysis, Insights and Forecast - by Application
- 11. Competitive Analysis
- 11.1. Global Market Share Analysis 2025
- 11.2. Company Profiles
- 11.2.1 Interactive Brokers
- 11.2.1.1. Overview
- 11.2.1.2. Products
- 11.2.1.3. SWOT Analysis
- 11.2.1.4. Recent Developments
- 11.2.1.5. Financials (Based on Availability)
- 11.2.2 Charles Schwab
- 11.2.2.1. Overview
- 11.2.2.2. Products
- 11.2.2.3. SWOT Analysis
- 11.2.2.4. Recent Developments
- 11.2.2.5. Financials (Based on Availability)
- 11.2.3 Fidelity Investments
- 11.2.3.1. Overview
- 11.2.3.2. Products
- 11.2.3.3. SWOT Analysis
- 11.2.3.4. Recent Developments
- 11.2.3.5. Financials (Based on Availability)
- 11.2.4 TD Ameritrade
- 11.2.4.1. Overview
- 11.2.4.2. Products
- 11.2.4.3. SWOT Analysis
- 11.2.4.4. Recent Developments
- 11.2.4.5. Financials (Based on Availability)
- 11.2.5 E-Trade
- 11.2.5.1. Overview
- 11.2.5.2. Products
- 11.2.5.3. SWOT Analysis
- 11.2.5.4. Recent Developments
- 11.2.5.5. Financials (Based on Availability)
- 11.2.6 TastyWorks
- 11.2.6.1. Overview
- 11.2.6.2. Products
- 11.2.6.3. SWOT Analysis
- 11.2.6.4. Recent Developments
- 11.2.6.5. Financials (Based on Availability)
- 11.2.7 Etoro
- 11.2.7.1. Overview
- 11.2.7.2. Products
- 11.2.7.3. SWOT Analysis
- 11.2.7.4. Recent Developments
- 11.2.7.5. Financials (Based on Availability)
- 11.2.8 X-Trade Brokers
- 11.2.8.1. Overview
- 11.2.8.2. Products
- 11.2.8.3. SWOT Analysis
- 11.2.8.4. Recent Developments
- 11.2.8.5. Financials (Based on Availability)
- 11.2.9 IC Markets
- 11.2.9.1. Overview
- 11.2.9.2. Products
- 11.2.9.3. SWOT Analysis
- 11.2.9.4. Recent Developments
- 11.2.9.5. Financials (Based on Availability)
- 11.2.10 Eoption
- 11.2.10.1. Overview
- 11.2.10.2. Products
- 11.2.10.3. SWOT Analysis
- 11.2.10.4. Recent Developments
- 11.2.10.5. Financials (Based on Availability)
- 11.2.11 First Prudential Markets
- 11.2.11.1. Overview
- 11.2.11.2. Products
- 11.2.11.3. SWOT Analysis
- 11.2.11.4. Recent Developments
- 11.2.11.5. Financials (Based on Availability)
- 11.2.1 Interactive Brokers
List of Figures
- Figure 1: Global E-brokerages Revenue Breakdown (undefined, %) by Region 2025 & 2033
- Figure 2: North America E-brokerages Revenue (undefined), by Application 2025 & 2033
- Figure 3: North America E-brokerages Revenue Share (%), by Application 2025 & 2033
- Figure 4: North America E-brokerages Revenue (undefined), by Types 2025 & 2033
- Figure 5: North America E-brokerages Revenue Share (%), by Types 2025 & 2033
- Figure 6: North America E-brokerages Revenue (undefined), by Country 2025 & 2033
- Figure 7: North America E-brokerages Revenue Share (%), by Country 2025 & 2033
- Figure 8: South America E-brokerages Revenue (undefined), by Application 2025 & 2033
- Figure 9: South America E-brokerages Revenue Share (%), by Application 2025 & 2033
- Figure 10: South America E-brokerages Revenue (undefined), by Types 2025 & 2033
- Figure 11: South America E-brokerages Revenue Share (%), by Types 2025 & 2033
- Figure 12: South America E-brokerages Revenue (undefined), by Country 2025 & 2033
- Figure 13: South America E-brokerages Revenue Share (%), by Country 2025 & 2033
- Figure 14: Europe E-brokerages Revenue (undefined), by Application 2025 & 2033
- Figure 15: Europe E-brokerages Revenue Share (%), by Application 2025 & 2033
- Figure 16: Europe E-brokerages Revenue (undefined), by Types 2025 & 2033
- Figure 17: Europe E-brokerages Revenue Share (%), by Types 2025 & 2033
- Figure 18: Europe E-brokerages Revenue (undefined), by Country 2025 & 2033
- Figure 19: Europe E-brokerages Revenue Share (%), by Country 2025 & 2033
- Figure 20: Middle East & Africa E-brokerages Revenue (undefined), by Application 2025 & 2033
- Figure 21: Middle East & Africa E-brokerages Revenue Share (%), by Application 2025 & 2033
- Figure 22: Middle East & Africa E-brokerages Revenue (undefined), by Types 2025 & 2033
- Figure 23: Middle East & Africa E-brokerages Revenue Share (%), by Types 2025 & 2033
- Figure 24: Middle East & Africa E-brokerages Revenue (undefined), by Country 2025 & 2033
- Figure 25: Middle East & Africa E-brokerages Revenue Share (%), by Country 2025 & 2033
- Figure 26: Asia Pacific E-brokerages Revenue (undefined), by Application 2025 & 2033
- Figure 27: Asia Pacific E-brokerages Revenue Share (%), by Application 2025 & 2033
- Figure 28: Asia Pacific E-brokerages Revenue (undefined), by Types 2025 & 2033
- Figure 29: Asia Pacific E-brokerages Revenue Share (%), by Types 2025 & 2033
- Figure 30: Asia Pacific E-brokerages Revenue (undefined), by Country 2025 & 2033
- Figure 31: Asia Pacific E-brokerages Revenue Share (%), by Country 2025 & 2033
List of Tables
- Table 1: Global E-brokerages Revenue undefined Forecast, by Application 2020 & 2033
- Table 2: Global E-brokerages Revenue undefined Forecast, by Types 2020 & 2033
- Table 3: Global E-brokerages Revenue undefined Forecast, by Region 2020 & 2033
- Table 4: Global E-brokerages Revenue undefined Forecast, by Application 2020 & 2033
- Table 5: Global E-brokerages Revenue undefined Forecast, by Types 2020 & 2033
- Table 6: Global E-brokerages Revenue undefined Forecast, by Country 2020 & 2033
- Table 7: United States E-brokerages Revenue (undefined) Forecast, by Application 2020 & 2033
- Table 8: Canada E-brokerages Revenue (undefined) Forecast, by Application 2020 & 2033
- Table 9: Mexico E-brokerages Revenue (undefined) Forecast, by Application 2020 & 2033
- Table 10: Global E-brokerages Revenue undefined Forecast, by Application 2020 & 2033
- Table 11: Global E-brokerages Revenue undefined Forecast, by Types 2020 & 2033
- Table 12: Global E-brokerages Revenue undefined Forecast, by Country 2020 & 2033
- Table 13: Brazil E-brokerages Revenue (undefined) Forecast, by Application 2020 & 2033
- Table 14: Argentina E-brokerages Revenue (undefined) Forecast, by Application 2020 & 2033
- Table 15: Rest of South America E-brokerages Revenue (undefined) Forecast, by Application 2020 & 2033
- Table 16: Global E-brokerages Revenue undefined Forecast, by Application 2020 & 2033
- Table 17: Global E-brokerages Revenue undefined Forecast, by Types 2020 & 2033
- Table 18: Global E-brokerages Revenue undefined Forecast, by Country 2020 & 2033
- Table 19: United Kingdom E-brokerages Revenue (undefined) Forecast, by Application 2020 & 2033
- Table 20: Germany E-brokerages Revenue (undefined) Forecast, by Application 2020 & 2033
- Table 21: France E-brokerages Revenue (undefined) Forecast, by Application 2020 & 2033
- Table 22: Italy E-brokerages Revenue (undefined) Forecast, by Application 2020 & 2033
- Table 23: Spain E-brokerages Revenue (undefined) Forecast, by Application 2020 & 2033
- Table 24: Russia E-brokerages Revenue (undefined) Forecast, by Application 2020 & 2033
- Table 25: Benelux E-brokerages Revenue (undefined) Forecast, by Application 2020 & 2033
- Table 26: Nordics E-brokerages Revenue (undefined) Forecast, by Application 2020 & 2033
- Table 27: Rest of Europe E-brokerages Revenue (undefined) Forecast, by Application 2020 & 2033
- Table 28: Global E-brokerages Revenue undefined Forecast, by Application 2020 & 2033
- Table 29: Global E-brokerages Revenue undefined Forecast, by Types 2020 & 2033
- Table 30: Global E-brokerages Revenue undefined Forecast, by Country 2020 & 2033
- Table 31: Turkey E-brokerages Revenue (undefined) Forecast, by Application 2020 & 2033
- Table 32: Israel E-brokerages Revenue (undefined) Forecast, by Application 2020 & 2033
- Table 33: GCC E-brokerages Revenue (undefined) Forecast, by Application 2020 & 2033
- Table 34: North Africa E-brokerages Revenue (undefined) Forecast, by Application 2020 & 2033
- Table 35: South Africa E-brokerages Revenue (undefined) Forecast, by Application 2020 & 2033
- Table 36: Rest of Middle East & Africa E-brokerages Revenue (undefined) Forecast, by Application 2020 & 2033
- Table 37: Global E-brokerages Revenue undefined Forecast, by Application 2020 & 2033
- Table 38: Global E-brokerages Revenue undefined Forecast, by Types 2020 & 2033
- Table 39: Global E-brokerages Revenue undefined Forecast, by Country 2020 & 2033
- Table 40: China E-brokerages Revenue (undefined) Forecast, by Application 2020 & 2033
- Table 41: India E-brokerages Revenue (undefined) Forecast, by Application 2020 & 2033
- Table 42: Japan E-brokerages Revenue (undefined) Forecast, by Application 2020 & 2033
- Table 43: South Korea E-brokerages Revenue (undefined) Forecast, by Application 2020 & 2033
- Table 44: ASEAN E-brokerages Revenue (undefined) Forecast, by Application 2020 & 2033
- Table 45: Oceania E-brokerages Revenue (undefined) Forecast, by Application 2020 & 2033
- Table 46: Rest of Asia Pacific E-brokerages Revenue (undefined) Forecast, by Application 2020 & 2033
Frequently Asked Questions
1. What is the projected Compound Annual Growth Rate (CAGR) of the E-brokerages?
The projected CAGR is approximately 10.5%.
2. Which companies are prominent players in the E-brokerages?
Key companies in the market include Interactive Brokers, Charles Schwab, Fidelity Investments, TD Ameritrade, E-Trade, TastyWorks, Etoro, X-Trade Brokers, IC Markets, Eoption, First Prudential Markets.
3. What are the main segments of the E-brokerages?
The market segments include Application, Types.
4. Can you provide details about the market size?
The market size is estimated to be USD XXX N/A as of 2022.
5. What are some drivers contributing to market growth?
N/A
6. What are the notable trends driving market growth?
N/A
7. Are there any restraints impacting market growth?
N/A
8. Can you provide examples of recent developments in the market?
N/A
9. What pricing options are available for accessing the report?
Pricing options include single-user, multi-user, and enterprise licenses priced at USD 2900.00, USD 4350.00, and USD 5800.00 respectively.
10. Is the market size provided in terms of value or volume?
The market size is provided in terms of value, measured in N/A.
11. Are there any specific market keywords associated with the report?
Yes, the market keyword associated with the report is "E-brokerages," which aids in identifying and referencing the specific market segment covered.
12. How do I determine which pricing option suits my needs best?
The pricing options vary based on user requirements and access needs. Individual users may opt for single-user licenses, while businesses requiring broader access may choose multi-user or enterprise licenses for cost-effective access to the report.
13. Are there any additional resources or data provided in the E-brokerages report?
While the report offers comprehensive insights, it's advisable to review the specific contents or supplementary materials provided to ascertain if additional resources or data are available.
14. How can I stay updated on further developments or reports in the E-brokerages?
To stay informed about further developments, trends, and reports in the E-brokerages, consider subscribing to industry newsletters, following relevant companies and organizations, or regularly checking reputable industry news sources and publications.
Methodology
Step 1 - Identification of Relevant Samples Size from Population Database


Step 2 - Approaches for Defining Global Market Size (Value, Volume* & Price*)

Note*: In applicable scenarios
Step 3 - Data Sources
Primary Research
- Web Analytics
- Survey Reports
- Research Institute
- Latest Research Reports
- Opinion Leaders
Secondary Research
- Annual Reports
- White Paper
- Latest Press Release
- Industry Association
- Paid Database
- Investor Presentations

Step 4 - Data Triangulation
Involves using different sources of information in order to increase the validity of a study
These sources are likely to be stakeholders in a program - participants, other researchers, program staff, other community members, and so on.
Then we put all data in single framework & apply various statistical tools to find out the dynamic on the market.
During the analysis stage, feedback from the stakeholder groups would be compared to determine areas of agreement as well as areas of divergence