

Key Insights
The dynamic digital signage software market is experiencing robust growth, driven by the increasing adoption of digital signage solutions across diverse sectors. The market's expansion is fueled by several key factors. Businesses are increasingly recognizing the power of dynamic content to enhance customer engagement, improve brand visibility, and streamline internal communications. The shift towards cloud-based solutions offers scalability, cost-effectiveness, and remote management capabilities, further accelerating market adoption. Moreover, advancements in display technologies, such as high-resolution screens and interactive displays, are enhancing the user experience and expanding the applications of dynamic digital signage. The integration of sophisticated analytics tools allows businesses to track performance metrics and optimize their campaigns, providing valuable insights into customer behavior and preferences. While the on-premises segment still holds a significant market share, the cloud-based segment is witnessing rapid growth due to its inherent flexibility and accessibility. Key players in this market are continuously innovating to provide advanced features such as content management systems, scheduling tools, and integration with other business systems, driving the overall market evolution. The geographically diverse market sees significant contributions from North America and Europe, reflecting the advanced technological infrastructure and high adoption rates in these regions. However, the Asia-Pacific region is emerging as a high-growth market, driven by increasing urbanization, economic development, and rising consumer spending.
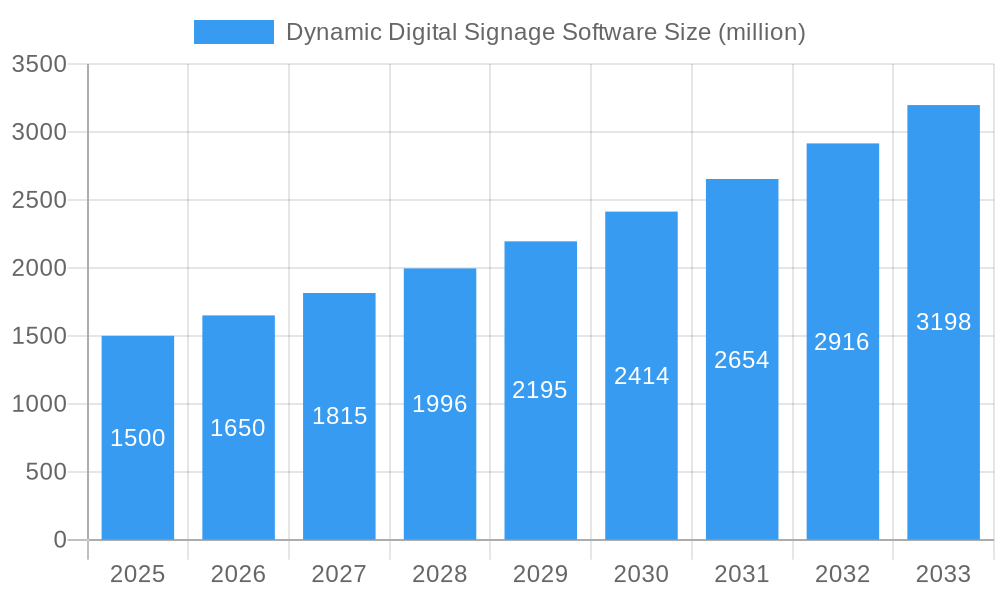
Dynamic Digital Signage Software Market Size (In Billion)
The competitive landscape is characterized by a blend of established players and emerging startups. Established companies, such as Panasonic and Samsung, leverage their brand recognition and existing distribution networks to maintain market dominance. Meanwhile, agile technology companies like Rise Vision and Signagelive are disrupting the market with innovative solutions and flexible pricing models. The increasing demand for personalized and targeted advertising is driving the adoption of dynamic content delivery platforms that enable granular control over message dissemination. Future market growth will likely be influenced by factors such as the increasing adoption of artificial intelligence (AI) and machine learning (ML) technologies to optimize content delivery and enhance user engagement, and the integration of Internet of Things (IoT) devices to create immersive and interactive signage experiences. Competition is expected to intensify, with companies focusing on developing innovative features, expanding their product portfolios, and forging strategic partnerships to gain a competitive edge. The market is anticipated to continue its upward trajectory, driven by sustained technological advancements and growing demand across diverse industry verticals.
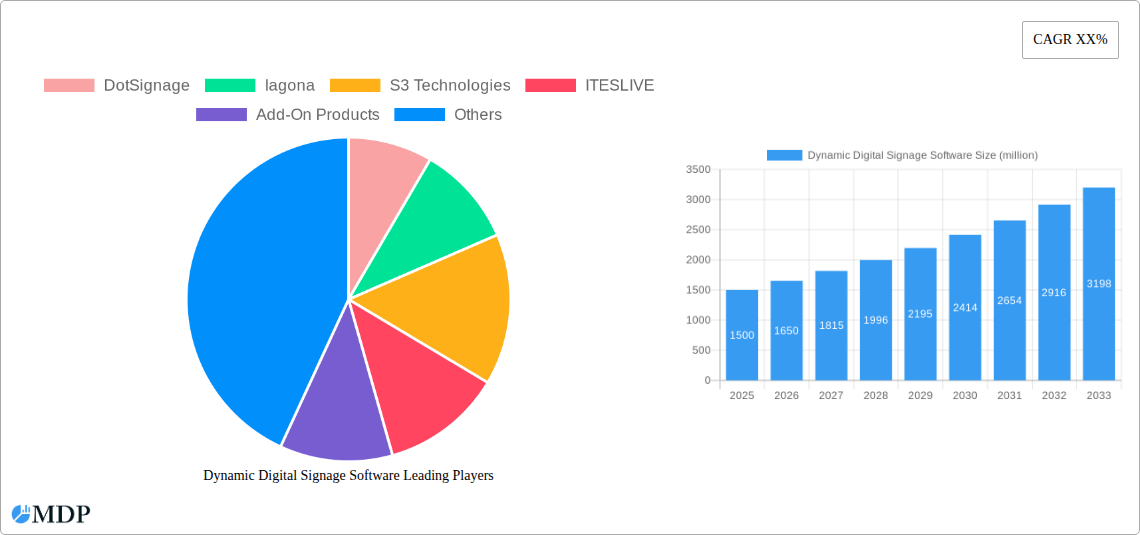
Dynamic Digital Signage Software Company Market Share
Dynamic Digital Signage Software Market Report: A Comprehensive Analysis (2019-2033)
This comprehensive report provides a detailed analysis of the dynamic digital signage software market, projecting a market value exceeding $XX million by 2033. The report covers the period from 2019 to 2033, with 2025 serving as both the base and estimated year. It offers invaluable insights for industry stakeholders, investors, and businesses seeking to navigate this rapidly evolving landscape. This in-depth analysis includes market sizing, segmentation, competitive landscape, and future projections, delivering actionable intelligence to drive strategic decision-making.
Dynamic Digital Signage Software Market Dynamics & Concentration
The global dynamic digital signage software market is experiencing significant growth, driven by increasing demand across diverse sectors. Market concentration is moderately high, with several key players dominating the landscape, although numerous smaller players also contribute. In 2025, the top five players are estimated to hold a combined market share of approximately 40%, indicating a competitive but not overly concentrated market. Innovation is a key driver, with companies continuously developing new features and functionalities to enhance user experience and cater to evolving customer needs. Regulatory frameworks vary across regions, impacting market dynamics, particularly regarding data privacy and security. The market also faces competitive pressure from alternative communication methods, but the convenience and visual appeal of digital signage continue to fuel growth. Mergers and acquisitions (M&A) activity has been moderate, with approximately xx M&A deals recorded between 2019 and 2024.
Dynamic Digital Signage Software Industry Trends & Analysis
The dynamic digital signage software market exhibits a robust CAGR of xx% during the forecast period (2025-2033), driven by several key factors. The increasing adoption of cloud-based solutions offers scalability, cost-effectiveness, and accessibility, fueling market growth. Technological advancements, such as AI-powered content management and interactive displays, are enhancing user engagement and expanding application possibilities. Consumer preferences are shifting towards personalized and interactive experiences, creating demand for advanced digital signage solutions. Competitive dynamics remain intense, with companies investing heavily in R&D to differentiate their offerings and expand their market share. Market penetration is steadily increasing, particularly in sectors like retail, hospitality, and corporate environments.
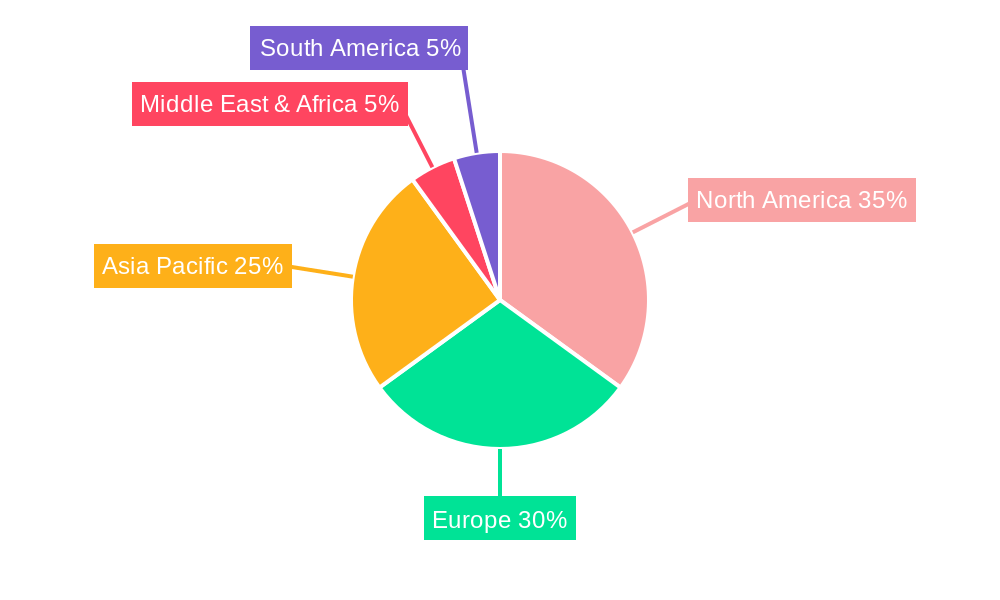
Leading Markets & Segments in Dynamic Digital Signage Software
The North American region dominates the dynamic digital signage software market, accounting for approximately xx% of the global market share in 2025. This dominance is attributable to several factors:
- Robust economic conditions: Strong economic growth fuels investment in digital signage technologies.
- Advanced infrastructure: Well-developed infrastructure supports seamless deployment and integration of digital signage solutions.
- High adoption rates: Businesses across various sectors readily adopt new technologies, driving market demand.
In terms of application, the meeting room segment holds the largest market share, followed by training sessions and seminars. This is largely due to the effectiveness of digital signage in enhancing communication and collaboration in these settings. The cloud-based segment significantly outperforms on-premises solutions, reflecting the growing preference for flexible, scalable, and cost-effective cloud deployment models.
Dynamic Digital Signage Software Product Developments
Recent product innovations focus on enhancing content management capabilities, improving interactivity, and integrating advanced analytics. Companies are developing AI-powered features for automated content scheduling and personalized messaging. The integration of IoT devices and seamless connectivity with other enterprise systems are key features driving market acceptance. This evolution caters to the growing demand for sophisticated and user-friendly solutions that deliver measurable ROI.
Key Drivers of Dynamic Digital Signage Software Growth
The market's growth is propelled by several key factors:
- Technological advancements: The development of AI-powered features, interactive displays, and improved content management systems significantly enhance user experience.
- Economic factors: Increased investment in digital transformation initiatives across various industries fuels demand.
- Regulatory support: Government initiatives promoting digitalization and smart cities create favorable market conditions.
Challenges in the Dynamic Digital Signage Software Market
Several factors hinder market growth:
- High initial investment costs: The initial investment required for deploying digital signage solutions can be substantial, especially for smaller businesses.
- Complexity of integration: Integrating digital signage systems with existing infrastructure can be complex and time-consuming.
- Cybersecurity concerns: Data security and privacy are crucial concerns, and breaches can negatively impact adoption. This is estimated to impact growth by approximately xx% by 2033.
Emerging Opportunities in Dynamic Digital Signage Software
The market presents several exciting opportunities:
- Expansion into emerging markets: Developing economies offer significant untapped potential for growth, especially in the retail and hospitality sectors.
- Strategic partnerships: Collaborations between software providers and hardware manufacturers can drive innovation and accelerate market penetration.
- Integration with other technologies: The integration of AR/VR and other emerging technologies will significantly enhance the capabilities and attractiveness of digital signage solutions.
Leading Players in the Dynamic Digital Signage Software Sector
- DotSignage
- Iagona
- S3 Technologies
- ITESLIVE
- Add-On Products
- STRATACACHE
- Leyard
- Mvix
- FWi
- Rise Vision
- Broadsign
- Omnivex
- Signagelive
- Navori Labs
- Intuiface
- NoviSign Digital Signage
- Daktronics
- Panasonic
- Foxconn
- Samsung
Key Milestones in Dynamic Digital Signage Software Industry
- 2020: Increased adoption of cloud-based solutions due to the pandemic.
- 2021: Launch of several AI-powered digital signage platforms.
- 2022: Significant mergers and acquisitions within the industry.
- 2023: Growing focus on interactive and personalized digital signage experiences.
Strategic Outlook for Dynamic Digital Signage Software Market
The dynamic digital signage software market is poised for sustained growth, driven by continuous technological innovation, increasing demand across various sectors, and strategic partnerships. The market is expected to witness significant expansion into emerging markets and integration with other technologies, such as IoT and AI. Focusing on providing personalized, interactive, and data-driven solutions will be critical for success in this competitive landscape. Companies that can effectively leverage these opportunities will be well-positioned for substantial growth in the coming years.
Dynamic Digital Signage Software Segmentation
-
1. Application
- 1.1. Meeting Room
- 1.2. Seminar
- 1.3. Training Session
- 1.4. Others
-
2. Types
- 2.1. Cloud-based
- 2.2. On Premises
Dynamic Digital Signage Software Segmentation By Geography
-
1. North America
- 1.1. United States
- 1.2. Canada
- 1.3. Mexico
-
2. South America
- 2.1. Brazil
- 2.2. Argentina
- 2.3. Rest of South America
-
3. Europe
- 3.1. United Kingdom
- 3.2. Germany
- 3.3. France
- 3.4. Italy
- 3.5. Spain
- 3.6. Russia
- 3.7. Benelux
- 3.8. Nordics
- 3.9. Rest of Europe
-
4. Middle East & Africa
- 4.1. Turkey
- 4.2. Israel
- 4.3. GCC
- 4.4. North Africa
- 4.5. South Africa
- 4.6. Rest of Middle East & Africa
-
5. Asia Pacific
- 5.1. China
- 5.2. India
- 5.3. Japan
- 5.4. South Korea
- 5.5. ASEAN
- 5.6. Oceania
- 5.7. Rest of Asia Pacific
Dynamic Digital Signage Software Regional Market Share
Geographic Coverage of Dynamic Digital Signage Software
Dynamic Digital Signage Software REPORT HIGHLIGHTS
| Aspects | Details |
|---|---|
| Study Period | 2020-2034 |
| Base Year | 2025 |
| Estimated Year | 2026 |
| Forecast Period | 2026-2034 |
| Historical Period | 2020-2025 |
| Growth Rate | CAGR of 8.2% from 2020-2034 |
| Segmentation |
|
Table of Contents
- 1. Introduction
- 1.1. Research Scope
- 1.2. Market Segmentation
- 1.3. Research Methodology
- 1.4. Definitions and Assumptions
- 2. Executive Summary
- 2.1. Introduction
- 3. Market Dynamics
- 3.1. Introduction
- 3.2. Market Drivers
- 3.3. Market Restrains
- 3.4. Market Trends
- 4. Market Factor Analysis
- 4.1. Porters Five Forces
- 4.2. Supply/Value Chain
- 4.3. PESTEL analysis
- 4.4. Market Entropy
- 4.5. Patent/Trademark Analysis
- 5. Global Dynamic Digital Signage Software Analysis, Insights and Forecast, 2020-2032
- 5.1. Market Analysis, Insights and Forecast - by Application
- 5.1.1. Meeting Room
- 5.1.2. Seminar
- 5.1.3. Training Session
- 5.1.4. Others
- 5.2. Market Analysis, Insights and Forecast - by Types
- 5.2.1. Cloud-based
- 5.2.2. On Premises
- 5.3. Market Analysis, Insights and Forecast - by Region
- 5.3.1. North America
- 5.3.2. South America
- 5.3.3. Europe
- 5.3.4. Middle East & Africa
- 5.3.5. Asia Pacific
- 5.1. Market Analysis, Insights and Forecast - by Application
- 6. North America Dynamic Digital Signage Software Analysis, Insights and Forecast, 2020-2032
- 6.1. Market Analysis, Insights and Forecast - by Application
- 6.1.1. Meeting Room
- 6.1.2. Seminar
- 6.1.3. Training Session
- 6.1.4. Others
- 6.2. Market Analysis, Insights and Forecast - by Types
- 6.2.1. Cloud-based
- 6.2.2. On Premises
- 6.1. Market Analysis, Insights and Forecast - by Application
- 7. South America Dynamic Digital Signage Software Analysis, Insights and Forecast, 2020-2032
- 7.1. Market Analysis, Insights and Forecast - by Application
- 7.1.1. Meeting Room
- 7.1.2. Seminar
- 7.1.3. Training Session
- 7.1.4. Others
- 7.2. Market Analysis, Insights and Forecast - by Types
- 7.2.1. Cloud-based
- 7.2.2. On Premises
- 7.1. Market Analysis, Insights and Forecast - by Application
- 8. Europe Dynamic Digital Signage Software Analysis, Insights and Forecast, 2020-2032
- 8.1. Market Analysis, Insights and Forecast - by Application
- 8.1.1. Meeting Room
- 8.1.2. Seminar
- 8.1.3. Training Session
- 8.1.4. Others
- 8.2. Market Analysis, Insights and Forecast - by Types
- 8.2.1. Cloud-based
- 8.2.2. On Premises
- 8.1. Market Analysis, Insights and Forecast - by Application
- 9. Middle East & Africa Dynamic Digital Signage Software Analysis, Insights and Forecast, 2020-2032
- 9.1. Market Analysis, Insights and Forecast - by Application
- 9.1.1. Meeting Room
- 9.1.2. Seminar
- 9.1.3. Training Session
- 9.1.4. Others
- 9.2. Market Analysis, Insights and Forecast - by Types
- 9.2.1. Cloud-based
- 9.2.2. On Premises
- 9.1. Market Analysis, Insights and Forecast - by Application
- 10. Asia Pacific Dynamic Digital Signage Software Analysis, Insights and Forecast, 2020-2032
- 10.1. Market Analysis, Insights and Forecast - by Application
- 10.1.1. Meeting Room
- 10.1.2. Seminar
- 10.1.3. Training Session
- 10.1.4. Others
- 10.2. Market Analysis, Insights and Forecast - by Types
- 10.2.1. Cloud-based
- 10.2.2. On Premises
- 10.1. Market Analysis, Insights and Forecast - by Application
- 11. Competitive Analysis
- 11.1. Global Market Share Analysis 2025
- 11.2. Company Profiles
- 11.2.1 DotSignage
- 11.2.1.1. Overview
- 11.2.1.2. Products
- 11.2.1.3. SWOT Analysis
- 11.2.1.4. Recent Developments
- 11.2.1.5. Financials (Based on Availability)
- 11.2.2 Iagona
- 11.2.2.1. Overview
- 11.2.2.2. Products
- 11.2.2.3. SWOT Analysis
- 11.2.2.4. Recent Developments
- 11.2.2.5. Financials (Based on Availability)
- 11.2.3 S3 Technologies
- 11.2.3.1. Overview
- 11.2.3.2. Products
- 11.2.3.3. SWOT Analysis
- 11.2.3.4. Recent Developments
- 11.2.3.5. Financials (Based on Availability)
- 11.2.4 ITESLIVE
- 11.2.4.1. Overview
- 11.2.4.2. Products
- 11.2.4.3. SWOT Analysis
- 11.2.4.4. Recent Developments
- 11.2.4.5. Financials (Based on Availability)
- 11.2.5 Add-On Products
- 11.2.5.1. Overview
- 11.2.5.2. Products
- 11.2.5.3. SWOT Analysis
- 11.2.5.4. Recent Developments
- 11.2.5.5. Financials (Based on Availability)
- 11.2.6 STRATACACHE
- 11.2.6.1. Overview
- 11.2.6.2. Products
- 11.2.6.3. SWOT Analysis
- 11.2.6.4. Recent Developments
- 11.2.6.5. Financials (Based on Availability)
- 11.2.7 Leyard
- 11.2.7.1. Overview
- 11.2.7.2. Products
- 11.2.7.3. SWOT Analysis
- 11.2.7.4. Recent Developments
- 11.2.7.5. Financials (Based on Availability)
- 11.2.8 Mvix
- 11.2.8.1. Overview
- 11.2.8.2. Products
- 11.2.8.3. SWOT Analysis
- 11.2.8.4. Recent Developments
- 11.2.8.5. Financials (Based on Availability)
- 11.2.9 FWi
- 11.2.9.1. Overview
- 11.2.9.2. Products
- 11.2.9.3. SWOT Analysis
- 11.2.9.4. Recent Developments
- 11.2.9.5. Financials (Based on Availability)
- 11.2.10 Rise Vision
- 11.2.10.1. Overview
- 11.2.10.2. Products
- 11.2.10.3. SWOT Analysis
- 11.2.10.4. Recent Developments
- 11.2.10.5. Financials (Based on Availability)
- 11.2.11 Broadsign
- 11.2.11.1. Overview
- 11.2.11.2. Products
- 11.2.11.3. SWOT Analysis
- 11.2.11.4. Recent Developments
- 11.2.11.5. Financials (Based on Availability)
- 11.2.12 Omnivex
- 11.2.12.1. Overview
- 11.2.12.2. Products
- 11.2.12.3. SWOT Analysis
- 11.2.12.4. Recent Developments
- 11.2.12.5. Financials (Based on Availability)
- 11.2.13 Signagelive
- 11.2.13.1. Overview
- 11.2.13.2. Products
- 11.2.13.3. SWOT Analysis
- 11.2.13.4. Recent Developments
- 11.2.13.5. Financials (Based on Availability)
- 11.2.14 Navori Labs
- 11.2.14.1. Overview
- 11.2.14.2. Products
- 11.2.14.3. SWOT Analysis
- 11.2.14.4. Recent Developments
- 11.2.14.5. Financials (Based on Availability)
- 11.2.15 Intuiface
- 11.2.15.1. Overview
- 11.2.15.2. Products
- 11.2.15.3. SWOT Analysis
- 11.2.15.4. Recent Developments
- 11.2.15.5. Financials (Based on Availability)
- 11.2.16 NoviSign Digital Signage
- 11.2.16.1. Overview
- 11.2.16.2. Products
- 11.2.16.3. SWOT Analysis
- 11.2.16.4. Recent Developments
- 11.2.16.5. Financials (Based on Availability)
- 11.2.17 Daktronics
- 11.2.17.1. Overview
- 11.2.17.2. Products
- 11.2.17.3. SWOT Analysis
- 11.2.17.4. Recent Developments
- 11.2.17.5. Financials (Based on Availability)
- 11.2.18 Panasonic
- 11.2.18.1. Overview
- 11.2.18.2. Products
- 11.2.18.3. SWOT Analysis
- 11.2.18.4. Recent Developments
- 11.2.18.5. Financials (Based on Availability)
- 11.2.19 Foxconn
- 11.2.19.1. Overview
- 11.2.19.2. Products
- 11.2.19.3. SWOT Analysis
- 11.2.19.4. Recent Developments
- 11.2.19.5. Financials (Based on Availability)
- 11.2.20 Samsung
- 11.2.20.1. Overview
- 11.2.20.2. Products
- 11.2.20.3. SWOT Analysis
- 11.2.20.4. Recent Developments
- 11.2.20.5. Financials (Based on Availability)
- 11.2.1 DotSignage
List of Figures
- Figure 1: Global Dynamic Digital Signage Software Revenue Breakdown (undefined, %) by Region 2025 & 2033
- Figure 2: North America Dynamic Digital Signage Software Revenue (undefined), by Application 2025 & 2033
- Figure 3: North America Dynamic Digital Signage Software Revenue Share (%), by Application 2025 & 2033
- Figure 4: North America Dynamic Digital Signage Software Revenue (undefined), by Types 2025 & 2033
- Figure 5: North America Dynamic Digital Signage Software Revenue Share (%), by Types 2025 & 2033
- Figure 6: North America Dynamic Digital Signage Software Revenue (undefined), by Country 2025 & 2033
- Figure 7: North America Dynamic Digital Signage Software Revenue Share (%), by Country 2025 & 2033
- Figure 8: South America Dynamic Digital Signage Software Revenue (undefined), by Application 2025 & 2033
- Figure 9: South America Dynamic Digital Signage Software Revenue Share (%), by Application 2025 & 2033
- Figure 10: South America Dynamic Digital Signage Software Revenue (undefined), by Types 2025 & 2033
- Figure 11: South America Dynamic Digital Signage Software Revenue Share (%), by Types 2025 & 2033
- Figure 12: South America Dynamic Digital Signage Software Revenue (undefined), by Country 2025 & 2033
- Figure 13: South America Dynamic Digital Signage Software Revenue Share (%), by Country 2025 & 2033
- Figure 14: Europe Dynamic Digital Signage Software Revenue (undefined), by Application 2025 & 2033
- Figure 15: Europe Dynamic Digital Signage Software Revenue Share (%), by Application 2025 & 2033
- Figure 16: Europe Dynamic Digital Signage Software Revenue (undefined), by Types 2025 & 2033
- Figure 17: Europe Dynamic Digital Signage Software Revenue Share (%), by Types 2025 & 2033
- Figure 18: Europe Dynamic Digital Signage Software Revenue (undefined), by Country 2025 & 2033
- Figure 19: Europe Dynamic Digital Signage Software Revenue Share (%), by Country 2025 & 2033
- Figure 20: Middle East & Africa Dynamic Digital Signage Software Revenue (undefined), by Application 2025 & 2033
- Figure 21: Middle East & Africa Dynamic Digital Signage Software Revenue Share (%), by Application 2025 & 2033
- Figure 22: Middle East & Africa Dynamic Digital Signage Software Revenue (undefined), by Types 2025 & 2033
- Figure 23: Middle East & Africa Dynamic Digital Signage Software Revenue Share (%), by Types 2025 & 2033
- Figure 24: Middle East & Africa Dynamic Digital Signage Software Revenue (undefined), by Country 2025 & 2033
- Figure 25: Middle East & Africa Dynamic Digital Signage Software Revenue Share (%), by Country 2025 & 2033
- Figure 26: Asia Pacific Dynamic Digital Signage Software Revenue (undefined), by Application 2025 & 2033
- Figure 27: Asia Pacific Dynamic Digital Signage Software Revenue Share (%), by Application 2025 & 2033
- Figure 28: Asia Pacific Dynamic Digital Signage Software Revenue (undefined), by Types 2025 & 2033
- Figure 29: Asia Pacific Dynamic Digital Signage Software Revenue Share (%), by Types 2025 & 2033
- Figure 30: Asia Pacific Dynamic Digital Signage Software Revenue (undefined), by Country 2025 & 2033
- Figure 31: Asia Pacific Dynamic Digital Signage Software Revenue Share (%), by Country 2025 & 2033
List of Tables
- Table 1: Global Dynamic Digital Signage Software Revenue undefined Forecast, by Application 2020 & 2033
- Table 2: Global Dynamic Digital Signage Software Revenue undefined Forecast, by Types 2020 & 2033
- Table 3: Global Dynamic Digital Signage Software Revenue undefined Forecast, by Region 2020 & 2033
- Table 4: Global Dynamic Digital Signage Software Revenue undefined Forecast, by Application 2020 & 2033
- Table 5: Global Dynamic Digital Signage Software Revenue undefined Forecast, by Types 2020 & 2033
- Table 6: Global Dynamic Digital Signage Software Revenue undefined Forecast, by Country 2020 & 2033
- Table 7: United States Dynamic Digital Signage Software Revenue (undefined) Forecast, by Application 2020 & 2033
- Table 8: Canada Dynamic Digital Signage Software Revenue (undefined) Forecast, by Application 2020 & 2033
- Table 9: Mexico Dynamic Digital Signage Software Revenue (undefined) Forecast, by Application 2020 & 2033
- Table 10: Global Dynamic Digital Signage Software Revenue undefined Forecast, by Application 2020 & 2033
- Table 11: Global Dynamic Digital Signage Software Revenue undefined Forecast, by Types 2020 & 2033
- Table 12: Global Dynamic Digital Signage Software Revenue undefined Forecast, by Country 2020 & 2033
- Table 13: Brazil Dynamic Digital Signage Software Revenue (undefined) Forecast, by Application 2020 & 2033
- Table 14: Argentina Dynamic Digital Signage Software Revenue (undefined) Forecast, by Application 2020 & 2033
- Table 15: Rest of South America Dynamic Digital Signage Software Revenue (undefined) Forecast, by Application 2020 & 2033
- Table 16: Global Dynamic Digital Signage Software Revenue undefined Forecast, by Application 2020 & 2033
- Table 17: Global Dynamic Digital Signage Software Revenue undefined Forecast, by Types 2020 & 2033
- Table 18: Global Dynamic Digital Signage Software Revenue undefined Forecast, by Country 2020 & 2033
- Table 19: United Kingdom Dynamic Digital Signage Software Revenue (undefined) Forecast, by Application 2020 & 2033
- Table 20: Germany Dynamic Digital Signage Software Revenue (undefined) Forecast, by Application 2020 & 2033
- Table 21: France Dynamic Digital Signage Software Revenue (undefined) Forecast, by Application 2020 & 2033
- Table 22: Italy Dynamic Digital Signage Software Revenue (undefined) Forecast, by Application 2020 & 2033
- Table 23: Spain Dynamic Digital Signage Software Revenue (undefined) Forecast, by Application 2020 & 2033
- Table 24: Russia Dynamic Digital Signage Software Revenue (undefined) Forecast, by Application 2020 & 2033
- Table 25: Benelux Dynamic Digital Signage Software Revenue (undefined) Forecast, by Application 2020 & 2033
- Table 26: Nordics Dynamic Digital Signage Software Revenue (undefined) Forecast, by Application 2020 & 2033
- Table 27: Rest of Europe Dynamic Digital Signage Software Revenue (undefined) Forecast, by Application 2020 & 2033
- Table 28: Global Dynamic Digital Signage Software Revenue undefined Forecast, by Application 2020 & 2033
- Table 29: Global Dynamic Digital Signage Software Revenue undefined Forecast, by Types 2020 & 2033
- Table 30: Global Dynamic Digital Signage Software Revenue undefined Forecast, by Country 2020 & 2033
- Table 31: Turkey Dynamic Digital Signage Software Revenue (undefined) Forecast, by Application 2020 & 2033
- Table 32: Israel Dynamic Digital Signage Software Revenue (undefined) Forecast, by Application 2020 & 2033
- Table 33: GCC Dynamic Digital Signage Software Revenue (undefined) Forecast, by Application 2020 & 2033
- Table 34: North Africa Dynamic Digital Signage Software Revenue (undefined) Forecast, by Application 2020 & 2033
- Table 35: South Africa Dynamic Digital Signage Software Revenue (undefined) Forecast, by Application 2020 & 2033
- Table 36: Rest of Middle East & Africa Dynamic Digital Signage Software Revenue (undefined) Forecast, by Application 2020 & 2033
- Table 37: Global Dynamic Digital Signage Software Revenue undefined Forecast, by Application 2020 & 2033
- Table 38: Global Dynamic Digital Signage Software Revenue undefined Forecast, by Types 2020 & 2033
- Table 39: Global Dynamic Digital Signage Software Revenue undefined Forecast, by Country 2020 & 2033
- Table 40: China Dynamic Digital Signage Software Revenue (undefined) Forecast, by Application 2020 & 2033
- Table 41: India Dynamic Digital Signage Software Revenue (undefined) Forecast, by Application 2020 & 2033
- Table 42: Japan Dynamic Digital Signage Software Revenue (undefined) Forecast, by Application 2020 & 2033
- Table 43: South Korea Dynamic Digital Signage Software Revenue (undefined) Forecast, by Application 2020 & 2033
- Table 44: ASEAN Dynamic Digital Signage Software Revenue (undefined) Forecast, by Application 2020 & 2033
- Table 45: Oceania Dynamic Digital Signage Software Revenue (undefined) Forecast, by Application 2020 & 2033
- Table 46: Rest of Asia Pacific Dynamic Digital Signage Software Revenue (undefined) Forecast, by Application 2020 & 2033
Frequently Asked Questions
1. What is the projected Compound Annual Growth Rate (CAGR) of the Dynamic Digital Signage Software?
The projected CAGR is approximately 8.2%.
2. Which companies are prominent players in the Dynamic Digital Signage Software?
Key companies in the market include DotSignage, Iagona, S3 Technologies, ITESLIVE, Add-On Products, STRATACACHE, Leyard, Mvix, FWi, Rise Vision, Broadsign, Omnivex, Signagelive, Navori Labs, Intuiface, NoviSign Digital Signage, Daktronics, Panasonic, Foxconn, Samsung.
3. What are the main segments of the Dynamic Digital Signage Software?
The market segments include Application, Types.
4. Can you provide details about the market size?
The market size is estimated to be USD XXX N/A as of 2022.
5. What are some drivers contributing to market growth?
N/A
6. What are the notable trends driving market growth?
N/A
7. Are there any restraints impacting market growth?
N/A
8. Can you provide examples of recent developments in the market?
N/A
9. What pricing options are available for accessing the report?
Pricing options include single-user, multi-user, and enterprise licenses priced at USD 4350.00, USD 6525.00, and USD 8700.00 respectively.
10. Is the market size provided in terms of value or volume?
The market size is provided in terms of value, measured in N/A.
11. Are there any specific market keywords associated with the report?
Yes, the market keyword associated with the report is "Dynamic Digital Signage Software," which aids in identifying and referencing the specific market segment covered.
12. How do I determine which pricing option suits my needs best?
The pricing options vary based on user requirements and access needs. Individual users may opt for single-user licenses, while businesses requiring broader access may choose multi-user or enterprise licenses for cost-effective access to the report.
13. Are there any additional resources or data provided in the Dynamic Digital Signage Software report?
While the report offers comprehensive insights, it's advisable to review the specific contents or supplementary materials provided to ascertain if additional resources or data are available.
14. How can I stay updated on further developments or reports in the Dynamic Digital Signage Software?
To stay informed about further developments, trends, and reports in the Dynamic Digital Signage Software, consider subscribing to industry newsletters, following relevant companies and organizations, or regularly checking reputable industry news sources and publications.
Methodology
Step 1 - Identification of Relevant Samples Size from Population Database


Step 2 - Approaches for Defining Global Market Size (Value, Volume* & Price*)

Note*: In applicable scenarios
Step 3 - Data Sources
Primary Research
- Web Analytics
- Survey Reports
- Research Institute
- Latest Research Reports
- Opinion Leaders
Secondary Research
- Annual Reports
- White Paper
- Latest Press Release
- Industry Association
- Paid Database
- Investor Presentations

Step 4 - Data Triangulation
Involves using different sources of information in order to increase the validity of a study
These sources are likely to be stakeholders in a program - participants, other researchers, program staff, other community members, and so on.
Then we put all data in single framework & apply various statistical tools to find out the dynamic on the market.
During the analysis stage, feedback from the stakeholder groups would be compared to determine areas of agreement as well as areas of divergence