

Key Insights
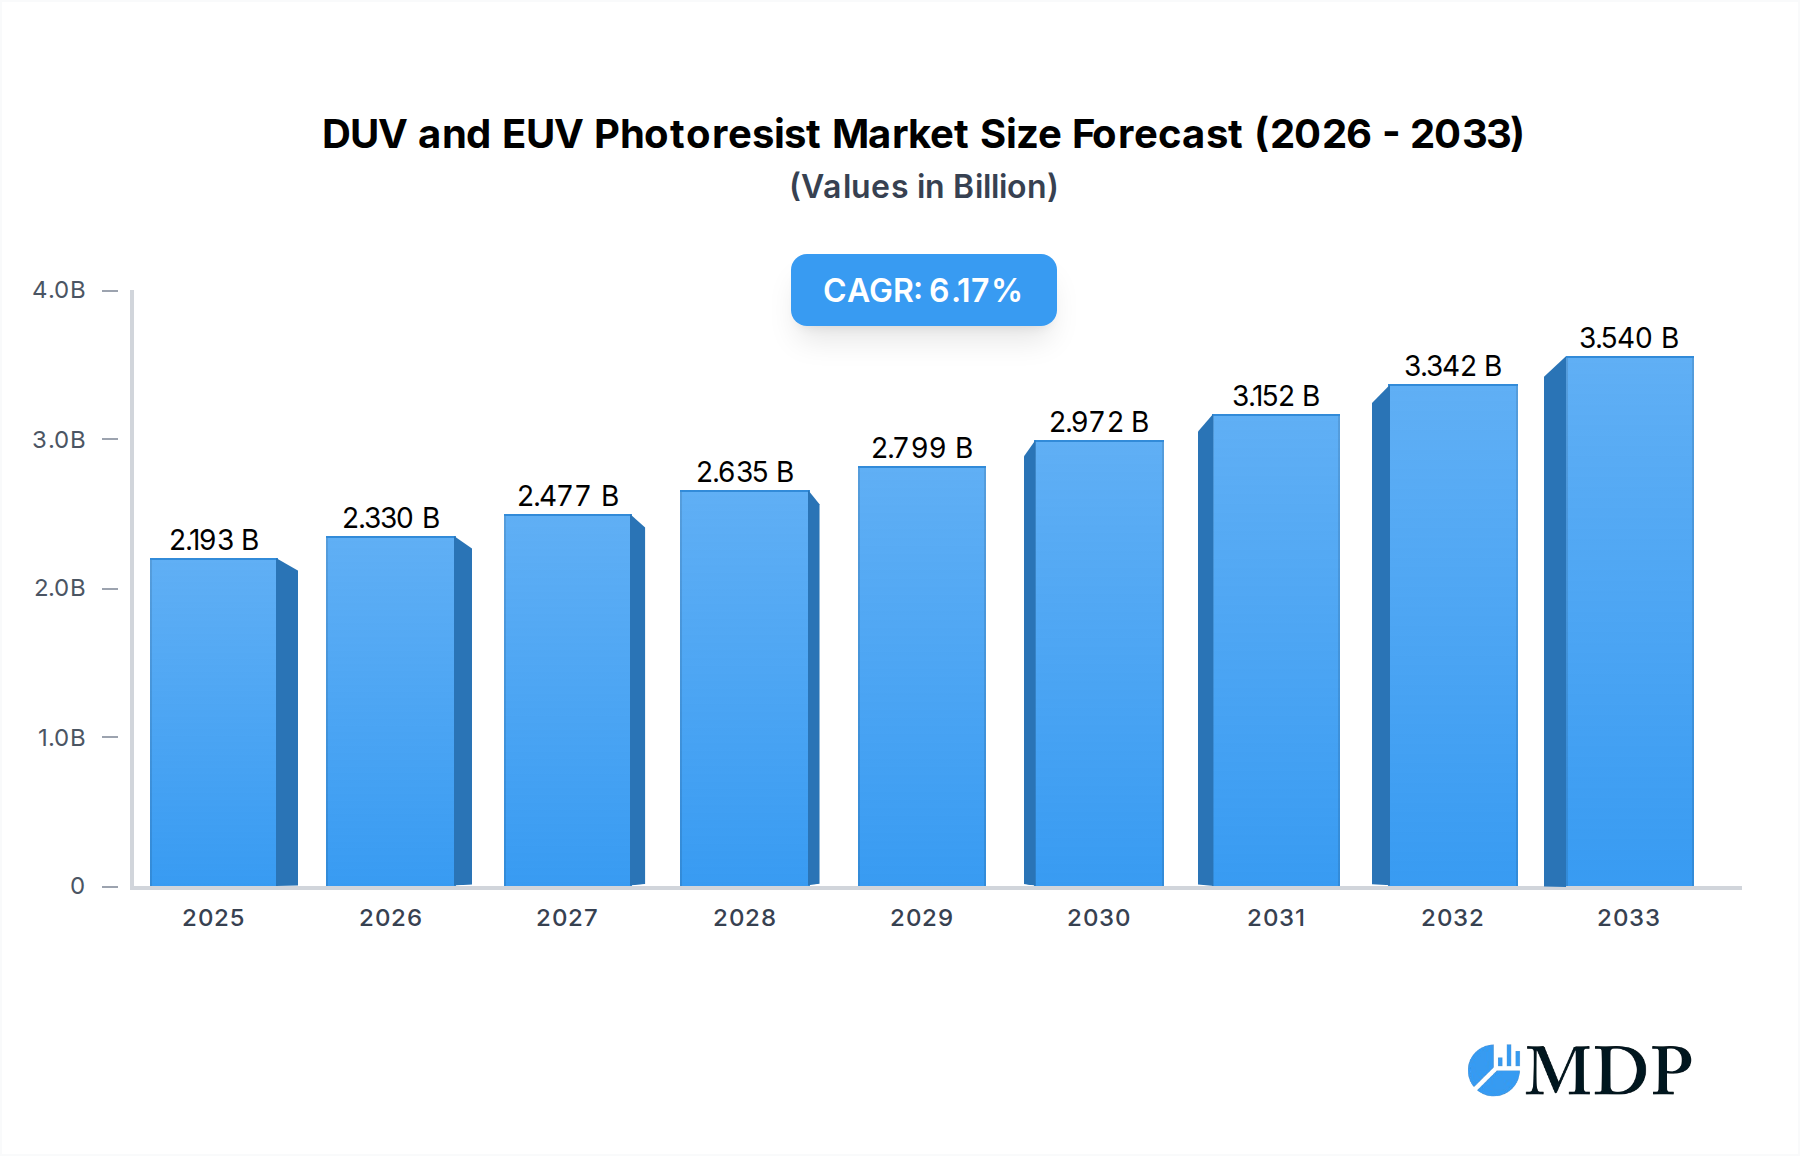
The global DUV and EUV photoresist market is poised for robust expansion, with an estimated market size of $2193 million in 2025. Driven by the relentless demand for advanced semiconductor manufacturing and the increasing complexity of integrated circuits, the market is projected to grow at a Compound Annual Growth Rate (CAGR) of 6.3% through 2033. Key growth drivers include the miniaturization of electronic components, the burgeoning demand for high-performance computing, and the widespread adoption of 5G technology, all of which necessitate the use of sophisticated photoresist materials. The transition towards smaller feature sizes in semiconductor fabrication, particularly with the advent of EUV lithography, is a significant catalyst. This advanced lithography technique allows for the creation of more intricate and powerful chips, thereby fueling the demand for specialized EUV photoresists. Furthermore, the ongoing investments in semiconductor R&D and manufacturing infrastructure across the globe are creating a fertile ground for market growth.

DUV and EUV Photoresist Market Size (In Billion)
The market segments for DUV and EUV photoresists are diverse, catering to various applications and types of photoresists. In terms of applications, Logic ICs and Memory ICs represent the dominant segments, reflecting their critical role in modern electronics. Other applications also contribute to market diversity. On the type front, EUV Photoresists are expected to witness significant growth due to their indispensable role in cutting-edge semiconductor manufacturing. ArFi Photoresists and ArF Dry Photoresists also hold substantial market share, serving established and emerging lithography processes. The market is characterized by a consolidated landscape with major players like TOKYO OHKA KOGYO CO.,LTD. (TOK), JSR, Shin-Etsu Chemical, DuPont, and Fujifilm investing heavily in innovation and capacity expansion. Emerging players, especially in the Asia Pacific region, are also gaining traction, contributing to a dynamic and competitive market environment. Restraints such as the high cost of EUV lithography equipment and stringent regulatory requirements for chemical usage are present but are increasingly being offset by technological advancements and industry collaboration.
DUV and EUV Photoresist Company Market Share
Global DUV and EUV Photoresist Market Report: Navigating the Frontiers of Semiconductor Lithography (2019–2033)
Unlock critical insights into the rapidly evolving DUV (Deep Ultraviolet) and EUV (Extreme Ultraviolet) photoresist market. This comprehensive report analyzes the technological advancements, market dynamics, and strategic landscapes shaping the future of semiconductor manufacturing. With a forecast period extending to 2033 and a deep dive into historical data from 2019–2024, this study provides unparalleled market intelligence for industry stakeholders, including Logic IC, Memory IC, and Other applications, and EUV Photoresists, ArFi Photoresists, ArF Dry Photoresists, KrF Photoresists.
DUV and EUV Photoresist Market Dynamics & Concentration
The global DUV and EUV photoresist market exhibits a moderate to high concentration, with leading players holding significant market share. Innovation remains the primary driver, fueled by the relentless demand for smaller, more powerful semiconductor devices. Regulatory frameworks, particularly concerning environmental impact and safety standards, are increasingly influential in shaping product development and market entry. Product substitutes, though limited in the high-end EUV segment, exist within the DUV spectrum. End-user trends are dominated by the insatiable appetite for advanced Logic ICs and high-capacity Memory ICs, pushing the boundaries of lithographic resolution. Merger and acquisition (M&A) activities, while not overtly frequent in the past, are anticipated to increase as companies seek to consolidate expertise, secure supply chains, and gain a competitive edge. Over the historical period, we've observed approximately 5 M&A deals valued at over $50 million each.
DUV and EUV Photoresist Industry Trends & Analysis
The DUV and EUV photoresist industry is experiencing robust growth, driven by a CAGR of approximately 12% over the forecast period. Technological disruptions are at the forefront, with the transition from DUV to EUV lithography for advanced node manufacturing being a paramount trend. This shift necessitates the development of highly sensitive and high-resolution EUV photoresists, a complex and capital-intensive endeavor. Consumer preferences for more powerful and energy-efficient electronic devices directly translate into a demand for smaller and more complex integrated circuits, thereby boosting the need for advanced photoresists. Competitive dynamics are intense, characterized by significant R&D investments, patent wars, and strategic partnerships. Market penetration for EUV photoresists, while currently lower than DUV, is projected to accelerate rapidly as more fabs adopt EUV technology, reaching an estimated 45% market penetration by 2033. The estimated market size in 2025 is projected to be $7,500 million.
Leading Markets & Segments in DUV and EUV Photoresist
The Asia-Pacific region, particularly South Korea, Taiwan, and China, represents the dominant market for DUV and EUV photoresists, largely due to the concentration of leading semiconductor manufacturing facilities. Within applications, Memory ICs are currently the largest segment, driven by the demand for advanced DRAM and NAND flash technologies. However, Logic ICs are poised for significant growth as AI, high-performance computing, and 5G technologies proliferate.
Dominant Region: Asia-Pacific
- Key Drivers: Proximity to major semiconductor foundries, government incentives for domestic semiconductor manufacturing, a vast ecosystem of chip designers and manufacturers.
- Economic Policies: Significant investments in R&D and fab expansion by countries like South Korea and Taiwan.
- Infrastructure: Availability of advanced manufacturing infrastructure and skilled workforce.
Leading Application Segment: Memory ICs
- Detailed Dominance Analysis: The insatiable demand for data storage and processing in consumer electronics, data centers, and mobile devices fuels the continuous need for advanced memory solutions. This necessitates smaller lithographic feature sizes, pushing the envelope for both DUV and EUV photoresist performance in DRAM and NAND production. The market size for Memory IC photoresists is estimated to be $3,200 million in 2025.
Emerging Application Segment: Logic ICs
- Detailed Dominance Analysis: The increasing complexity of processors for AI, autonomous driving, and high-performance computing requires cutting-edge lithography. EUV photoresists are becoming indispensable for critical layers in advanced Logic IC manufacturing, driving significant market growth and innovation in this segment. The market size for Logic IC photoresists is estimated to be $2,800 million in 2025.
Dominant Type: ArFi Photoresists
- Detailed Dominance Analysis: ArFi (Argon Fluoride Immersion) photoresists remain a cornerstone for critical layers in advanced DUV lithography, offering a balance of resolution and cost-effectiveness. They are widely adopted for leading-edge Logic and Memory IC production before full EUV migration. The market size for ArFi photoresists is estimated to be $4,000 million in 2025.
Fastest Growing Type: EUV Photoresists
- Detailed Dominance Analysis: EUV photoresists are the key enablers of sub-10nm semiconductor manufacturing. Their adoption is rapidly increasing as leading foundries invest heavily in EUV lithography tools. This segment is projected to witness the highest growth rate over the forecast period, driven by technological advancements and expanding applications in advanced Logic and Memory ICs. The market size for EUV photoresists is estimated to be $1,000 million in 2025 and projected to reach $5,500 million by 2033.
DUV and EUV Photoresist Product Developments
Recent product developments in DUV and EUV photoresists focus on enhancing sensitivity, resolution, and etch resistance for advanced lithography nodes. Innovations include novel polymer chemistries, advanced resist formulations for reduced line-edge roughness (LER) and critical dimension (CD) variation, and improved outgassing characteristics for EUV applications. These advancements are crucial for enabling the production of smaller, faster, and more power-efficient semiconductor devices, providing a distinct competitive advantage for material suppliers who can deliver consistent, high-performance solutions that meet the stringent demands of leading-edge foundries.
Key Drivers of DUV and EUV Photoresist Growth
The growth of the DUV and EUV photoresist market is primarily driven by the escalating demand for advanced semiconductors in smartphones, AI, data centers, and IoT devices. Technological advancements in lithography, particularly the continued adoption of EUV technology, are crucial. Economic factors, including global economic growth and increased semiconductor investments by major economies, also play a significant role. Regulatory support for technological innovation and the pursuit of miniaturization in electronics further propel market expansion.
Challenges in the DUV and EUV Photoresist Market
The DUV and EUV photoresist market faces several challenges, including the high cost of EUV lithography and material development, stringent purity requirements, and the complex supply chain for specialized chemicals. Regulatory hurdles related to chemical safety and environmental impact can also pose obstacles. Furthermore, the intense competitive landscape and the need for continuous innovation to keep pace with semiconductor technology roadmaps present ongoing challenges for market players. Supply chain disruptions, as seen in recent years, can also impact production and availability, with an estimated 15% potential impact on delivery timelines during peak shortages.
Emerging Opportunities in DUV and EUV Photoresist
Emerging opportunities lie in the development of next-generation EUV photoresists with higher sensitivity and resolution to enable sub-2nm nodes. The growing demand for advanced packaging solutions and specialized applications beyond Logic and Memory ICs, such as for advanced displays and sensors, presents new avenues for growth. Strategic partnerships between material suppliers and semiconductor manufacturers are crucial for co-developing customized photoresist solutions tailored to specific process technologies. Market expansion into new geographic regions with growing semiconductor manufacturing capabilities also offers significant potential.
Leading Players in the DUV and EUV Photoresist Sector
- TOKYO OHKA KOGYO CO.,LTD. (TOK)
- JSR
- Shin-Etsu Chemical
- DuPont
- Fujifilm
- Sumitomo Chemical
- Dongjin Semichem
- YCCHEM Co.,Ltd
- Xuzhou B & C Chemical
- Red Avenue
- Crystal Clear Electronic Material
- SK Materials Performance (SKMP)
- Xiamen Hengkun New Material Technology
- Zhuhai Cornerstone Technologies
- SINEVA
- Guoke Tianji
- Jiangsu Nata Opto-electronic Material
- Shanghai Sinyang Semiconductor Materials
- Merck KGaA (AZ)
Key Milestones in DUV and EUV Photoresist Industry
- 2019: Widespread commercialization of ArFi immersion lithography for advanced DUV nodes.
- 2020: Initial pilot production runs utilizing EUV lithography for select critical layers in Logic ICs.
- 2021: Significant advancements in EUV photoresist sensitivity and throughput reported by key players.
- 2022: Increased investment in R&D for next-generation EUV photoresists with higher resolution.
- 2023: Expansion of EUV adoption to more advanced Memory IC manufacturing processes.
- 2024: Emergence of new photoresist formulations for improved pattern fidelity and defect reduction.
Strategic Outlook for DUV and EUV Photoresist Market
The strategic outlook for the DUV and EUV photoresist market is exceptionally positive, driven by the sustained demand for semiconductors and the relentless pace of technological innovation. Growth accelerators include the widespread adoption of EUV lithography, advancements in materials science, and the expansion of semiconductor manufacturing capabilities globally. Strategic opportunities lie in fostering closer collaborations between material suppliers and semiconductor manufacturers, investing in R&D for next-generation lithography challenges, and exploring new application areas for advanced photoresists, ensuring continued market leadership and profitability.
DUV and EUV Photoresist Segmentation
-
1. Application
- 1.1. Logic IC
- 1.2. Memory IC
- 1.3. Others
-
2. Types
- 2.1. EUV Photoresists
- 2.2. ArFi Photoresists
- 2.3. ArF Dry Photoresists
- 2.4. KrF Photoresists
DUV and EUV Photoresist Segmentation By Geography
-
1. North America
- 1.1. United States
- 1.2. Canada
- 1.3. Mexico
-
2. South America
- 2.1. Brazil
- 2.2. Argentina
- 2.3. Rest of South America
-
3. Europe
- 3.1. United Kingdom
- 3.2. Germany
- 3.3. France
- 3.4. Italy
- 3.5. Spain
- 3.6. Russia
- 3.7. Benelux
- 3.8. Nordics
- 3.9. Rest of Europe
-
4. Middle East & Africa
- 4.1. Turkey
- 4.2. Israel
- 4.3. GCC
- 4.4. North Africa
- 4.5. South Africa
- 4.6. Rest of Middle East & Africa
-
5. Asia Pacific
- 5.1. China
- 5.2. India
- 5.3. Japan
- 5.4. South Korea
- 5.5. ASEAN
- 5.6. Oceania
- 5.7. Rest of Asia Pacific
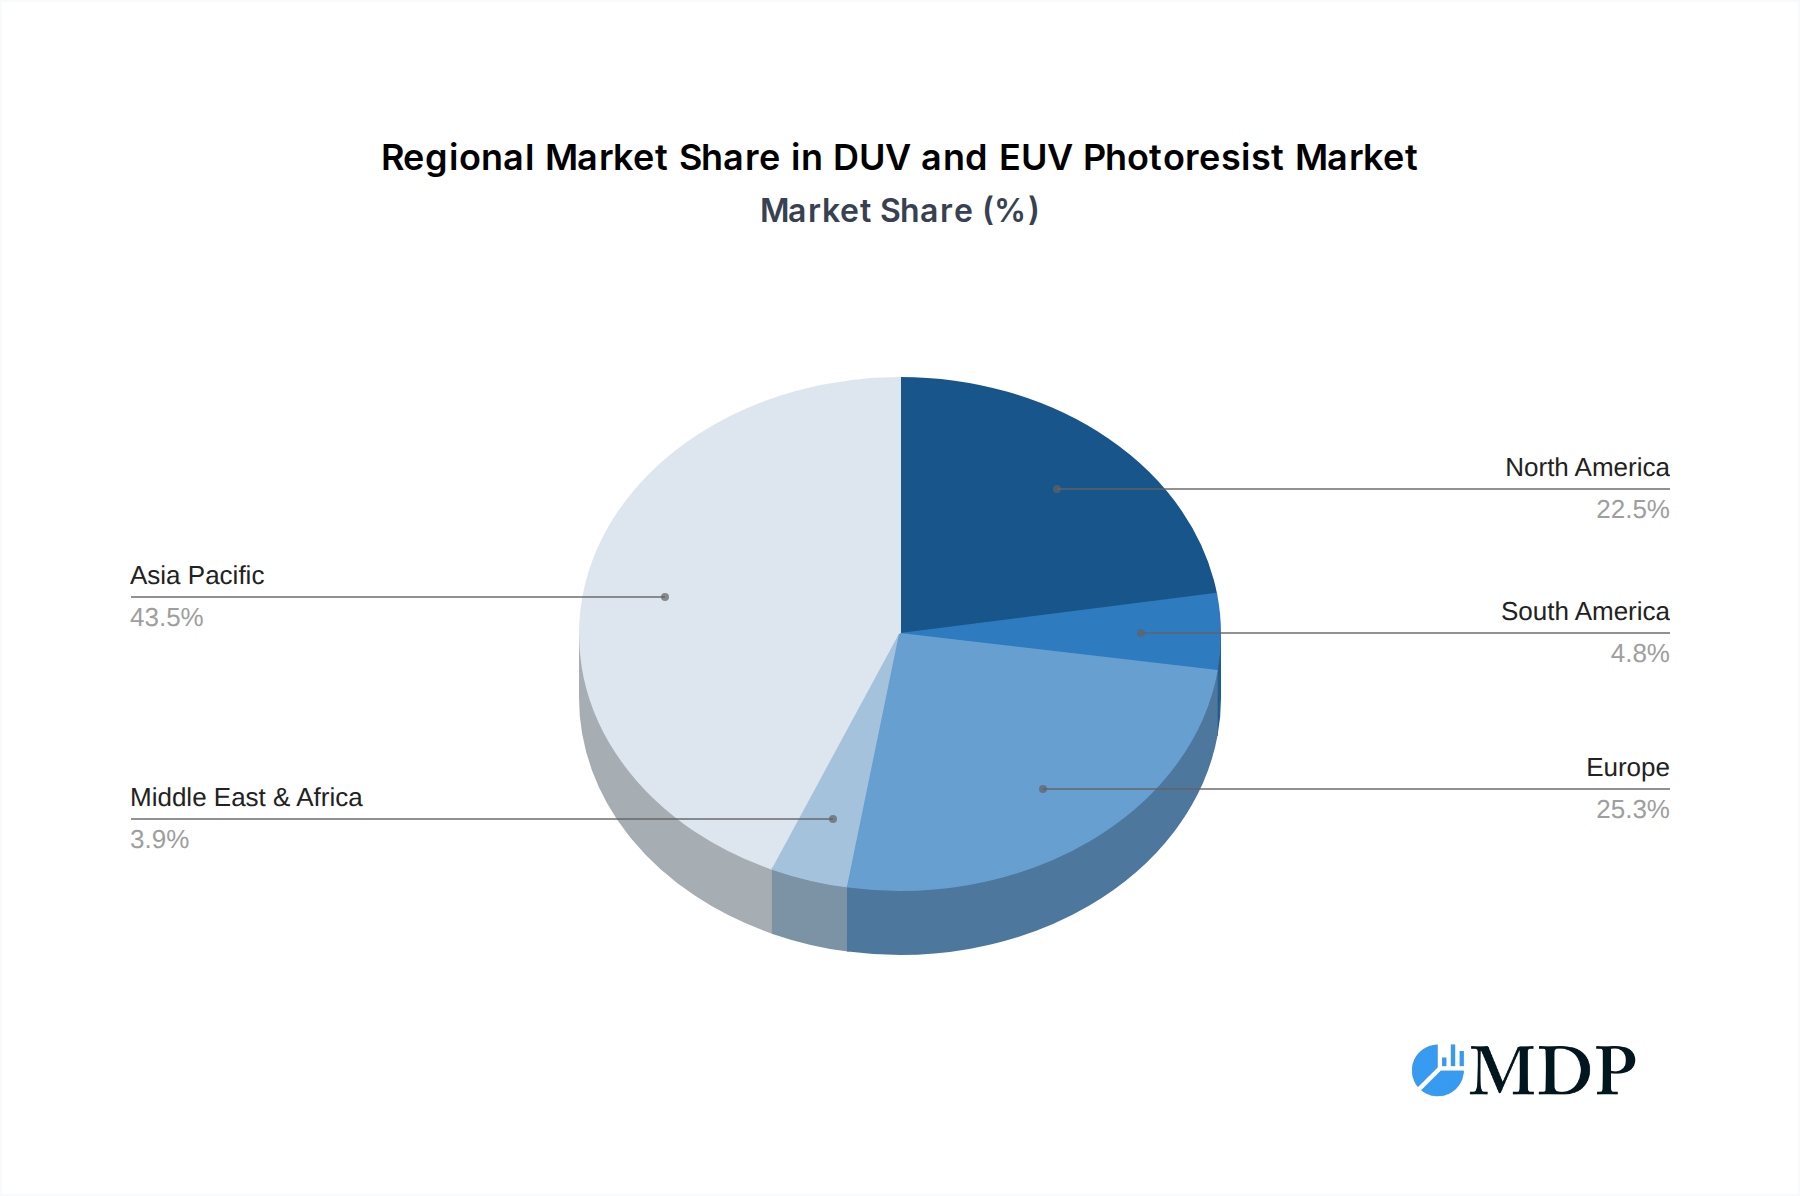
DUV and EUV Photoresist Regional Market Share
Geographic Coverage of DUV and EUV Photoresist
DUV and EUV Photoresist REPORT HIGHLIGHTS
| Aspects | Details |
|---|---|
| Study Period | 2020-2034 |
| Base Year | 2025 |
| Estimated Year | 2026 |
| Forecast Period | 2026-2034 |
| Historical Period | 2020-2025 |
| Growth Rate | CAGR of 6.3% from 2020-2034 |
| Segmentation |
|
Table of Contents
- 1. Introduction
- 1.1. Research Scope
- 1.2. Market Segmentation
- 1.3. Research Methodology
- 1.4. Definitions and Assumptions
- 2. Executive Summary
- 2.1. Introduction
- 3. Market Dynamics
- 3.1. Introduction
- 3.2. Market Drivers
- 3.3. Market Restrains
- 3.4. Market Trends
- 4. Market Factor Analysis
- 4.1. Porters Five Forces
- 4.2. Supply/Value Chain
- 4.3. PESTEL analysis
- 4.4. Market Entropy
- 4.5. Patent/Trademark Analysis
- 5. Global DUV and EUV Photoresist Analysis, Insights and Forecast, 2020-2032
- 5.1. Market Analysis, Insights and Forecast - by Application
- 5.1.1. Logic IC
- 5.1.2. Memory IC
- 5.1.3. Others
- 5.2. Market Analysis, Insights and Forecast - by Types
- 5.2.1. EUV Photoresists
- 5.2.2. ArFi Photoresists
- 5.2.3. ArF Dry Photoresists
- 5.2.4. KrF Photoresists
- 5.3. Market Analysis, Insights and Forecast - by Region
- 5.3.1. North America
- 5.3.2. South America
- 5.3.3. Europe
- 5.3.4. Middle East & Africa
- 5.3.5. Asia Pacific
- 5.1. Market Analysis, Insights and Forecast - by Application
- 6. North America DUV and EUV Photoresist Analysis, Insights and Forecast, 2020-2032
- 6.1. Market Analysis, Insights and Forecast - by Application
- 6.1.1. Logic IC
- 6.1.2. Memory IC
- 6.1.3. Others
- 6.2. Market Analysis, Insights and Forecast - by Types
- 6.2.1. EUV Photoresists
- 6.2.2. ArFi Photoresists
- 6.2.3. ArF Dry Photoresists
- 6.2.4. KrF Photoresists
- 6.1. Market Analysis, Insights and Forecast - by Application
- 7. South America DUV and EUV Photoresist Analysis, Insights and Forecast, 2020-2032
- 7.1. Market Analysis, Insights and Forecast - by Application
- 7.1.1. Logic IC
- 7.1.2. Memory IC
- 7.1.3. Others
- 7.2. Market Analysis, Insights and Forecast - by Types
- 7.2.1. EUV Photoresists
- 7.2.2. ArFi Photoresists
- 7.2.3. ArF Dry Photoresists
- 7.2.4. KrF Photoresists
- 7.1. Market Analysis, Insights and Forecast - by Application
- 8. Europe DUV and EUV Photoresist Analysis, Insights and Forecast, 2020-2032
- 8.1. Market Analysis, Insights and Forecast - by Application
- 8.1.1. Logic IC
- 8.1.2. Memory IC
- 8.1.3. Others
- 8.2. Market Analysis, Insights and Forecast - by Types
- 8.2.1. EUV Photoresists
- 8.2.2. ArFi Photoresists
- 8.2.3. ArF Dry Photoresists
- 8.2.4. KrF Photoresists
- 8.1. Market Analysis, Insights and Forecast - by Application
- 9. Middle East & Africa DUV and EUV Photoresist Analysis, Insights and Forecast, 2020-2032
- 9.1. Market Analysis, Insights and Forecast - by Application
- 9.1.1. Logic IC
- 9.1.2. Memory IC
- 9.1.3. Others
- 9.2. Market Analysis, Insights and Forecast - by Types
- 9.2.1. EUV Photoresists
- 9.2.2. ArFi Photoresists
- 9.2.3. ArF Dry Photoresists
- 9.2.4. KrF Photoresists
- 9.1. Market Analysis, Insights and Forecast - by Application
- 10. Asia Pacific DUV and EUV Photoresist Analysis, Insights and Forecast, 2020-2032
- 10.1. Market Analysis, Insights and Forecast - by Application
- 10.1.1. Logic IC
- 10.1.2. Memory IC
- 10.1.3. Others
- 10.2. Market Analysis, Insights and Forecast - by Types
- 10.2.1. EUV Photoresists
- 10.2.2. ArFi Photoresists
- 10.2.3. ArF Dry Photoresists
- 10.2.4. KrF Photoresists
- 10.1. Market Analysis, Insights and Forecast - by Application
- 11. Competitive Analysis
- 11.1. Global Market Share Analysis 2025
- 11.2. Company Profiles
- 11.2.1 TOKYO OHKA KOGYO CO.
- 11.2.1.1. Overview
- 11.2.1.2. Products
- 11.2.1.3. SWOT Analysis
- 11.2.1.4. Recent Developments
- 11.2.1.5. Financials (Based on Availability)
- 11.2.2 LTD. (TOK)
- 11.2.2.1. Overview
- 11.2.2.2. Products
- 11.2.2.3. SWOT Analysis
- 11.2.2.4. Recent Developments
- 11.2.2.5. Financials (Based on Availability)
- 11.2.3 JSR
- 11.2.3.1. Overview
- 11.2.3.2. Products
- 11.2.3.3. SWOT Analysis
- 11.2.3.4. Recent Developments
- 11.2.3.5. Financials (Based on Availability)
- 11.2.4 Shin-Etsu Chemical
- 11.2.4.1. Overview
- 11.2.4.2. Products
- 11.2.4.3. SWOT Analysis
- 11.2.4.4. Recent Developments
- 11.2.4.5. Financials (Based on Availability)
- 11.2.5 DuPont
- 11.2.5.1. Overview
- 11.2.5.2. Products
- 11.2.5.3. SWOT Analysis
- 11.2.5.4. Recent Developments
- 11.2.5.5. Financials (Based on Availability)
- 11.2.6 Fujifilm
- 11.2.6.1. Overview
- 11.2.6.2. Products
- 11.2.6.3. SWOT Analysis
- 11.2.6.4. Recent Developments
- 11.2.6.5. Financials (Based on Availability)
- 11.2.7 Sumitomo Chemical
- 11.2.7.1. Overview
- 11.2.7.2. Products
- 11.2.7.3. SWOT Analysis
- 11.2.7.4. Recent Developments
- 11.2.7.5. Financials (Based on Availability)
- 11.2.8 Dongjin Semichem
- 11.2.8.1. Overview
- 11.2.8.2. Products
- 11.2.8.3. SWOT Analysis
- 11.2.8.4. Recent Developments
- 11.2.8.5. Financials (Based on Availability)
- 11.2.9 YCCHEM Co.
- 11.2.9.1. Overview
- 11.2.9.2. Products
- 11.2.9.3. SWOT Analysis
- 11.2.9.4. Recent Developments
- 11.2.9.5. Financials (Based on Availability)
- 11.2.10 Ltd
- 11.2.10.1. Overview
- 11.2.10.2. Products
- 11.2.10.3. SWOT Analysis
- 11.2.10.4. Recent Developments
- 11.2.10.5. Financials (Based on Availability)
- 11.2.11 Xuzhou B & C Chemical
- 11.2.11.1. Overview
- 11.2.11.2. Products
- 11.2.11.3. SWOT Analysis
- 11.2.11.4. Recent Developments
- 11.2.11.5. Financials (Based on Availability)
- 11.2.12 Red Avenue
- 11.2.12.1. Overview
- 11.2.12.2. Products
- 11.2.12.3. SWOT Analysis
- 11.2.12.4. Recent Developments
- 11.2.12.5. Financials (Based on Availability)
- 11.2.13 Crystal Clear Electronic Material
- 11.2.13.1. Overview
- 11.2.13.2. Products
- 11.2.13.3. SWOT Analysis
- 11.2.13.4. Recent Developments
- 11.2.13.5. Financials (Based on Availability)
- 11.2.14 SK Materials Performance (SKMP)
- 11.2.14.1. Overview
- 11.2.14.2. Products
- 11.2.14.3. SWOT Analysis
- 11.2.14.4. Recent Developments
- 11.2.14.5. Financials (Based on Availability)
- 11.2.15 Xiamen Hengkun New Material Technology
- 11.2.15.1. Overview
- 11.2.15.2. Products
- 11.2.15.3. SWOT Analysis
- 11.2.15.4. Recent Developments
- 11.2.15.5. Financials (Based on Availability)
- 11.2.16 Zhuhai Cornerstone Technologies
- 11.2.16.1. Overview
- 11.2.16.2. Products
- 11.2.16.3. SWOT Analysis
- 11.2.16.4. Recent Developments
- 11.2.16.5. Financials (Based on Availability)
- 11.2.17 SINEVA
- 11.2.17.1. Overview
- 11.2.17.2. Products
- 11.2.17.3. SWOT Analysis
- 11.2.17.4. Recent Developments
- 11.2.17.5. Financials (Based on Availability)
- 11.2.18 Guoke Tianji
- 11.2.18.1. Overview
- 11.2.18.2. Products
- 11.2.18.3. SWOT Analysis
- 11.2.18.4. Recent Developments
- 11.2.18.5. Financials (Based on Availability)
- 11.2.19 Jiangsu Nata Opto-electronic Material
- 11.2.19.1. Overview
- 11.2.19.2. Products
- 11.2.19.3. SWOT Analysis
- 11.2.19.4. Recent Developments
- 11.2.19.5. Financials (Based on Availability)
- 11.2.20 Shanghai Sinyang Semiconductor Materials
- 11.2.20.1. Overview
- 11.2.20.2. Products
- 11.2.20.3. SWOT Analysis
- 11.2.20.4. Recent Developments
- 11.2.20.5. Financials (Based on Availability)
- 11.2.21 Merck KGaA (AZ)
- 11.2.21.1. Overview
- 11.2.21.2. Products
- 11.2.21.3. SWOT Analysis
- 11.2.21.4. Recent Developments
- 11.2.21.5. Financials (Based on Availability)
- 11.2.1 TOKYO OHKA KOGYO CO.
List of Figures
- Figure 1: Global DUV and EUV Photoresist Revenue Breakdown (million, %) by Region 2025 & 2033
- Figure 2: Global DUV and EUV Photoresist Volume Breakdown (K, %) by Region 2025 & 2033
- Figure 3: North America DUV and EUV Photoresist Revenue (million), by Application 2025 & 2033
- Figure 4: North America DUV and EUV Photoresist Volume (K), by Application 2025 & 2033
- Figure 5: North America DUV and EUV Photoresist Revenue Share (%), by Application 2025 & 2033
- Figure 6: North America DUV and EUV Photoresist Volume Share (%), by Application 2025 & 2033
- Figure 7: North America DUV and EUV Photoresist Revenue (million), by Types 2025 & 2033
- Figure 8: North America DUV and EUV Photoresist Volume (K), by Types 2025 & 2033
- Figure 9: North America DUV and EUV Photoresist Revenue Share (%), by Types 2025 & 2033
- Figure 10: North America DUV and EUV Photoresist Volume Share (%), by Types 2025 & 2033
- Figure 11: North America DUV and EUV Photoresist Revenue (million), by Country 2025 & 2033
- Figure 12: North America DUV and EUV Photoresist Volume (K), by Country 2025 & 2033
- Figure 13: North America DUV and EUV Photoresist Revenue Share (%), by Country 2025 & 2033
- Figure 14: North America DUV and EUV Photoresist Volume Share (%), by Country 2025 & 2033
- Figure 15: South America DUV and EUV Photoresist Revenue (million), by Application 2025 & 2033
- Figure 16: South America DUV and EUV Photoresist Volume (K), by Application 2025 & 2033
- Figure 17: South America DUV and EUV Photoresist Revenue Share (%), by Application 2025 & 2033
- Figure 18: South America DUV and EUV Photoresist Volume Share (%), by Application 2025 & 2033
- Figure 19: South America DUV and EUV Photoresist Revenue (million), by Types 2025 & 2033
- Figure 20: South America DUV and EUV Photoresist Volume (K), by Types 2025 & 2033
- Figure 21: South America DUV and EUV Photoresist Revenue Share (%), by Types 2025 & 2033
- Figure 22: South America DUV and EUV Photoresist Volume Share (%), by Types 2025 & 2033
- Figure 23: South America DUV and EUV Photoresist Revenue (million), by Country 2025 & 2033
- Figure 24: South America DUV and EUV Photoresist Volume (K), by Country 2025 & 2033
- Figure 25: South America DUV and EUV Photoresist Revenue Share (%), by Country 2025 & 2033
- Figure 26: South America DUV and EUV Photoresist Volume Share (%), by Country 2025 & 2033
- Figure 27: Europe DUV and EUV Photoresist Revenue (million), by Application 2025 & 2033
- Figure 28: Europe DUV and EUV Photoresist Volume (K), by Application 2025 & 2033
- Figure 29: Europe DUV and EUV Photoresist Revenue Share (%), by Application 2025 & 2033
- Figure 30: Europe DUV and EUV Photoresist Volume Share (%), by Application 2025 & 2033
- Figure 31: Europe DUV and EUV Photoresist Revenue (million), by Types 2025 & 2033
- Figure 32: Europe DUV and EUV Photoresist Volume (K), by Types 2025 & 2033
- Figure 33: Europe DUV and EUV Photoresist Revenue Share (%), by Types 2025 & 2033
- Figure 34: Europe DUV and EUV Photoresist Volume Share (%), by Types 2025 & 2033
- Figure 35: Europe DUV and EUV Photoresist Revenue (million), by Country 2025 & 2033
- Figure 36: Europe DUV and EUV Photoresist Volume (K), by Country 2025 & 2033
- Figure 37: Europe DUV and EUV Photoresist Revenue Share (%), by Country 2025 & 2033
- Figure 38: Europe DUV and EUV Photoresist Volume Share (%), by Country 2025 & 2033
- Figure 39: Middle East & Africa DUV and EUV Photoresist Revenue (million), by Application 2025 & 2033
- Figure 40: Middle East & Africa DUV and EUV Photoresist Volume (K), by Application 2025 & 2033
- Figure 41: Middle East & Africa DUV and EUV Photoresist Revenue Share (%), by Application 2025 & 2033
- Figure 42: Middle East & Africa DUV and EUV Photoresist Volume Share (%), by Application 2025 & 2033
- Figure 43: Middle East & Africa DUV and EUV Photoresist Revenue (million), by Types 2025 & 2033
- Figure 44: Middle East & Africa DUV and EUV Photoresist Volume (K), by Types 2025 & 2033
- Figure 45: Middle East & Africa DUV and EUV Photoresist Revenue Share (%), by Types 2025 & 2033
- Figure 46: Middle East & Africa DUV and EUV Photoresist Volume Share (%), by Types 2025 & 2033
- Figure 47: Middle East & Africa DUV and EUV Photoresist Revenue (million), by Country 2025 & 2033
- Figure 48: Middle East & Africa DUV and EUV Photoresist Volume (K), by Country 2025 & 2033
- Figure 49: Middle East & Africa DUV and EUV Photoresist Revenue Share (%), by Country 2025 & 2033
- Figure 50: Middle East & Africa DUV and EUV Photoresist Volume Share (%), by Country 2025 & 2033
- Figure 51: Asia Pacific DUV and EUV Photoresist Revenue (million), by Application 2025 & 2033
- Figure 52: Asia Pacific DUV and EUV Photoresist Volume (K), by Application 2025 & 2033
- Figure 53: Asia Pacific DUV and EUV Photoresist Revenue Share (%), by Application 2025 & 2033
- Figure 54: Asia Pacific DUV and EUV Photoresist Volume Share (%), by Application 2025 & 2033
- Figure 55: Asia Pacific DUV and EUV Photoresist Revenue (million), by Types 2025 & 2033
- Figure 56: Asia Pacific DUV and EUV Photoresist Volume (K), by Types 2025 & 2033
- Figure 57: Asia Pacific DUV and EUV Photoresist Revenue Share (%), by Types 2025 & 2033
- Figure 58: Asia Pacific DUV and EUV Photoresist Volume Share (%), by Types 2025 & 2033
- Figure 59: Asia Pacific DUV and EUV Photoresist Revenue (million), by Country 2025 & 2033
- Figure 60: Asia Pacific DUV and EUV Photoresist Volume (K), by Country 2025 & 2033
- Figure 61: Asia Pacific DUV and EUV Photoresist Revenue Share (%), by Country 2025 & 2033
- Figure 62: Asia Pacific DUV and EUV Photoresist Volume Share (%), by Country 2025 & 2033
List of Tables
- Table 1: Global DUV and EUV Photoresist Revenue million Forecast, by Application 2020 & 2033
- Table 2: Global DUV and EUV Photoresist Volume K Forecast, by Application 2020 & 2033
- Table 3: Global DUV and EUV Photoresist Revenue million Forecast, by Types 2020 & 2033
- Table 4: Global DUV and EUV Photoresist Volume K Forecast, by Types 2020 & 2033
- Table 5: Global DUV and EUV Photoresist Revenue million Forecast, by Region 2020 & 2033
- Table 6: Global DUV and EUV Photoresist Volume K Forecast, by Region 2020 & 2033
- Table 7: Global DUV and EUV Photoresist Revenue million Forecast, by Application 2020 & 2033
- Table 8: Global DUV and EUV Photoresist Volume K Forecast, by Application 2020 & 2033
- Table 9: Global DUV and EUV Photoresist Revenue million Forecast, by Types 2020 & 2033
- Table 10: Global DUV and EUV Photoresist Volume K Forecast, by Types 2020 & 2033
- Table 11: Global DUV and EUV Photoresist Revenue million Forecast, by Country 2020 & 2033
- Table 12: Global DUV and EUV Photoresist Volume K Forecast, by Country 2020 & 2033
- Table 13: United States DUV and EUV Photoresist Revenue (million) Forecast, by Application 2020 & 2033
- Table 14: United States DUV and EUV Photoresist Volume (K) Forecast, by Application 2020 & 2033
- Table 15: Canada DUV and EUV Photoresist Revenue (million) Forecast, by Application 2020 & 2033
- Table 16: Canada DUV and EUV Photoresist Volume (K) Forecast, by Application 2020 & 2033
- Table 17: Mexico DUV and EUV Photoresist Revenue (million) Forecast, by Application 2020 & 2033
- Table 18: Mexico DUV and EUV Photoresist Volume (K) Forecast, by Application 2020 & 2033
- Table 19: Global DUV and EUV Photoresist Revenue million Forecast, by Application 2020 & 2033
- Table 20: Global DUV and EUV Photoresist Volume K Forecast, by Application 2020 & 2033
- Table 21: Global DUV and EUV Photoresist Revenue million Forecast, by Types 2020 & 2033
- Table 22: Global DUV and EUV Photoresist Volume K Forecast, by Types 2020 & 2033
- Table 23: Global DUV and EUV Photoresist Revenue million Forecast, by Country 2020 & 2033
- Table 24: Global DUV and EUV Photoresist Volume K Forecast, by Country 2020 & 2033
- Table 25: Brazil DUV and EUV Photoresist Revenue (million) Forecast, by Application 2020 & 2033
- Table 26: Brazil DUV and EUV Photoresist Volume (K) Forecast, by Application 2020 & 2033
- Table 27: Argentina DUV and EUV Photoresist Revenue (million) Forecast, by Application 2020 & 2033
- Table 28: Argentina DUV and EUV Photoresist Volume (K) Forecast, by Application 2020 & 2033
- Table 29: Rest of South America DUV and EUV Photoresist Revenue (million) Forecast, by Application 2020 & 2033
- Table 30: Rest of South America DUV and EUV Photoresist Volume (K) Forecast, by Application 2020 & 2033
- Table 31: Global DUV and EUV Photoresist Revenue million Forecast, by Application 2020 & 2033
- Table 32: Global DUV and EUV Photoresist Volume K Forecast, by Application 2020 & 2033
- Table 33: Global DUV and EUV Photoresist Revenue million Forecast, by Types 2020 & 2033
- Table 34: Global DUV and EUV Photoresist Volume K Forecast, by Types 2020 & 2033
- Table 35: Global DUV and EUV Photoresist Revenue million Forecast, by Country 2020 & 2033
- Table 36: Global DUV and EUV Photoresist Volume K Forecast, by Country 2020 & 2033
- Table 37: United Kingdom DUV and EUV Photoresist Revenue (million) Forecast, by Application 2020 & 2033
- Table 38: United Kingdom DUV and EUV Photoresist Volume (K) Forecast, by Application 2020 & 2033
- Table 39: Germany DUV and EUV Photoresist Revenue (million) Forecast, by Application 2020 & 2033
- Table 40: Germany DUV and EUV Photoresist Volume (K) Forecast, by Application 2020 & 2033
- Table 41: France DUV and EUV Photoresist Revenue (million) Forecast, by Application 2020 & 2033
- Table 42: France DUV and EUV Photoresist Volume (K) Forecast, by Application 2020 & 2033
- Table 43: Italy DUV and EUV Photoresist Revenue (million) Forecast, by Application 2020 & 2033
- Table 44: Italy DUV and EUV Photoresist Volume (K) Forecast, by Application 2020 & 2033
- Table 45: Spain DUV and EUV Photoresist Revenue (million) Forecast, by Application 2020 & 2033
- Table 46: Spain DUV and EUV Photoresist Volume (K) Forecast, by Application 2020 & 2033
- Table 47: Russia DUV and EUV Photoresist Revenue (million) Forecast, by Application 2020 & 2033
- Table 48: Russia DUV and EUV Photoresist Volume (K) Forecast, by Application 2020 & 2033
- Table 49: Benelux DUV and EUV Photoresist Revenue (million) Forecast, by Application 2020 & 2033
- Table 50: Benelux DUV and EUV Photoresist Volume (K) Forecast, by Application 2020 & 2033
- Table 51: Nordics DUV and EUV Photoresist Revenue (million) Forecast, by Application 2020 & 2033
- Table 52: Nordics DUV and EUV Photoresist Volume (K) Forecast, by Application 2020 & 2033
- Table 53: Rest of Europe DUV and EUV Photoresist Revenue (million) Forecast, by Application 2020 & 2033
- Table 54: Rest of Europe DUV and EUV Photoresist Volume (K) Forecast, by Application 2020 & 2033
- Table 55: Global DUV and EUV Photoresist Revenue million Forecast, by Application 2020 & 2033
- Table 56: Global DUV and EUV Photoresist Volume K Forecast, by Application 2020 & 2033
- Table 57: Global DUV and EUV Photoresist Revenue million Forecast, by Types 2020 & 2033
- Table 58: Global DUV and EUV Photoresist Volume K Forecast, by Types 2020 & 2033
- Table 59: Global DUV and EUV Photoresist Revenue million Forecast, by Country 2020 & 2033
- Table 60: Global DUV and EUV Photoresist Volume K Forecast, by Country 2020 & 2033
- Table 61: Turkey DUV and EUV Photoresist Revenue (million) Forecast, by Application 2020 & 2033
- Table 62: Turkey DUV and EUV Photoresist Volume (K) Forecast, by Application 2020 & 2033
- Table 63: Israel DUV and EUV Photoresist Revenue (million) Forecast, by Application 2020 & 2033
- Table 64: Israel DUV and EUV Photoresist Volume (K) Forecast, by Application 2020 & 2033
- Table 65: GCC DUV and EUV Photoresist Revenue (million) Forecast, by Application 2020 & 2033
- Table 66: GCC DUV and EUV Photoresist Volume (K) Forecast, by Application 2020 & 2033
- Table 67: North Africa DUV and EUV Photoresist Revenue (million) Forecast, by Application 2020 & 2033
- Table 68: North Africa DUV and EUV Photoresist Volume (K) Forecast, by Application 2020 & 2033
- Table 69: South Africa DUV and EUV Photoresist Revenue (million) Forecast, by Application 2020 & 2033
- Table 70: South Africa DUV and EUV Photoresist Volume (K) Forecast, by Application 2020 & 2033
- Table 71: Rest of Middle East & Africa DUV and EUV Photoresist Revenue (million) Forecast, by Application 2020 & 2033
- Table 72: Rest of Middle East & Africa DUV and EUV Photoresist Volume (K) Forecast, by Application 2020 & 2033
- Table 73: Global DUV and EUV Photoresist Revenue million Forecast, by Application 2020 & 2033
- Table 74: Global DUV and EUV Photoresist Volume K Forecast, by Application 2020 & 2033
- Table 75: Global DUV and EUV Photoresist Revenue million Forecast, by Types 2020 & 2033
- Table 76: Global DUV and EUV Photoresist Volume K Forecast, by Types 2020 & 2033
- Table 77: Global DUV and EUV Photoresist Revenue million Forecast, by Country 2020 & 2033
- Table 78: Global DUV and EUV Photoresist Volume K Forecast, by Country 2020 & 2033
- Table 79: China DUV and EUV Photoresist Revenue (million) Forecast, by Application 2020 & 2033
- Table 80: China DUV and EUV Photoresist Volume (K) Forecast, by Application 2020 & 2033
- Table 81: India DUV and EUV Photoresist Revenue (million) Forecast, by Application 2020 & 2033
- Table 82: India DUV and EUV Photoresist Volume (K) Forecast, by Application 2020 & 2033
- Table 83: Japan DUV and EUV Photoresist Revenue (million) Forecast, by Application 2020 & 2033
- Table 84: Japan DUV and EUV Photoresist Volume (K) Forecast, by Application 2020 & 2033
- Table 85: South Korea DUV and EUV Photoresist Revenue (million) Forecast, by Application 2020 & 2033
- Table 86: South Korea DUV and EUV Photoresist Volume (K) Forecast, by Application 2020 & 2033
- Table 87: ASEAN DUV and EUV Photoresist Revenue (million) Forecast, by Application 2020 & 2033
- Table 88: ASEAN DUV and EUV Photoresist Volume (K) Forecast, by Application 2020 & 2033
- Table 89: Oceania DUV and EUV Photoresist Revenue (million) Forecast, by Application 2020 & 2033
- Table 90: Oceania DUV and EUV Photoresist Volume (K) Forecast, by Application 2020 & 2033
- Table 91: Rest of Asia Pacific DUV and EUV Photoresist Revenue (million) Forecast, by Application 2020 & 2033
- Table 92: Rest of Asia Pacific DUV and EUV Photoresist Volume (K) Forecast, by Application 2020 & 2033
Frequently Asked Questions
1. What is the projected Compound Annual Growth Rate (CAGR) of the DUV and EUV Photoresist?
The projected CAGR is approximately 6.3%.
2. Which companies are prominent players in the DUV and EUV Photoresist?
Key companies in the market include TOKYO OHKA KOGYO CO., LTD. (TOK), JSR, Shin-Etsu Chemical, DuPont, Fujifilm, Sumitomo Chemical, Dongjin Semichem, YCCHEM Co., Ltd, Xuzhou B & C Chemical, Red Avenue, Crystal Clear Electronic Material, SK Materials Performance (SKMP), Xiamen Hengkun New Material Technology, Zhuhai Cornerstone Technologies, SINEVA, Guoke Tianji, Jiangsu Nata Opto-electronic Material, Shanghai Sinyang Semiconductor Materials, Merck KGaA (AZ).
3. What are the main segments of the DUV and EUV Photoresist?
The market segments include Application, Types.
4. Can you provide details about the market size?
The market size is estimated to be USD 2193 million as of 2022.
5. What are some drivers contributing to market growth?
N/A
6. What are the notable trends driving market growth?
N/A
7. Are there any restraints impacting market growth?
N/A
8. Can you provide examples of recent developments in the market?
N/A
9. What pricing options are available for accessing the report?
Pricing options include single-user, multi-user, and enterprise licenses priced at USD 3950.00, USD 5925.00, and USD 7900.00 respectively.
10. Is the market size provided in terms of value or volume?
The market size is provided in terms of value, measured in million and volume, measured in K.
11. Are there any specific market keywords associated with the report?
Yes, the market keyword associated with the report is "DUV and EUV Photoresist," which aids in identifying and referencing the specific market segment covered.
12. How do I determine which pricing option suits my needs best?
The pricing options vary based on user requirements and access needs. Individual users may opt for single-user licenses, while businesses requiring broader access may choose multi-user or enterprise licenses for cost-effective access to the report.
13. Are there any additional resources or data provided in the DUV and EUV Photoresist report?
While the report offers comprehensive insights, it's advisable to review the specific contents or supplementary materials provided to ascertain if additional resources or data are available.
14. How can I stay updated on further developments or reports in the DUV and EUV Photoresist?
To stay informed about further developments, trends, and reports in the DUV and EUV Photoresist, consider subscribing to industry newsletters, following relevant companies and organizations, or regularly checking reputable industry news sources and publications.
Methodology
Step 1 - Identification of Relevant Samples Size from Population Database


Step 2 - Approaches for Defining Global Market Size (Value, Volume* & Price*)

Note*: In applicable scenarios
Step 3 - Data Sources
Primary Research
- Web Analytics
- Survey Reports
- Research Institute
- Latest Research Reports
- Opinion Leaders
Secondary Research
- Annual Reports
- White Paper
- Latest Press Release
- Industry Association
- Paid Database
- Investor Presentations

Step 4 - Data Triangulation
Involves using different sources of information in order to increase the validity of a study
These sources are likely to be stakeholders in a program - participants, other researchers, program staff, other community members, and so on.
Then we put all data in single framework & apply various statistical tools to find out the dynamic on the market.
During the analysis stage, feedback from the stakeholder groups would be compared to determine areas of agreement as well as areas of divergence