

Key Insights
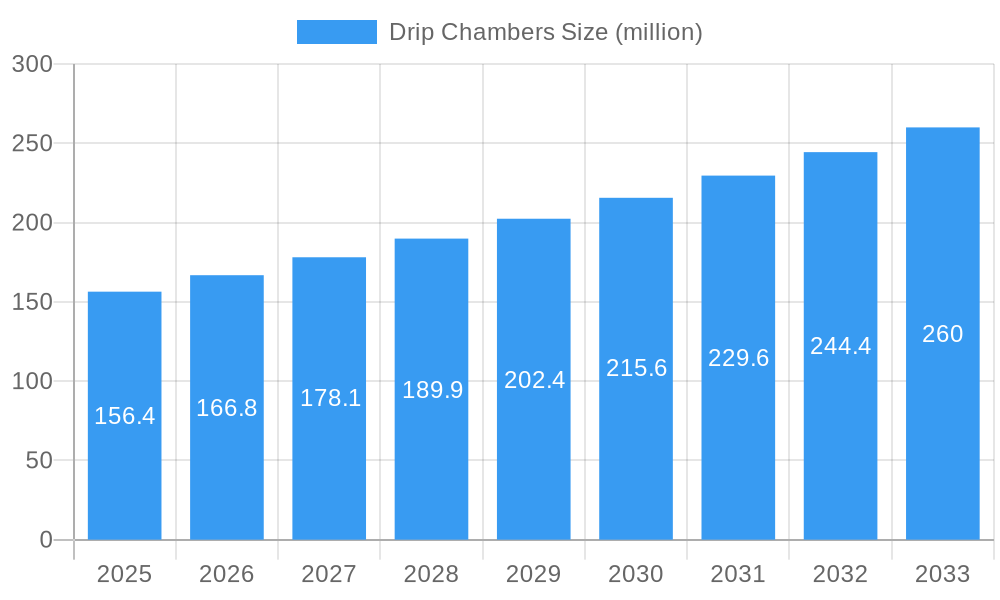
The global drip chambers market, valued at $156.4 million in 2025, is projected to experience robust growth, driven by a Compound Annual Growth Rate (CAGR) of 6.7% from 2025 to 2033. This expansion is fueled by several key factors. The increasing prevalence of chronic diseases requiring intravenous therapy, coupled with technological advancements leading to more efficient and safer drip chambers, are significant contributors. Furthermore, the rising demand for minimally invasive procedures and ambulatory care settings necessitates the use of reliable and portable drip chambers. The market is segmented by material type (e.g., PVC, glass), application (e.g., hospitals, clinics, home healthcare), and region. Major players like B. Braun, Borla, Merit Medical, BQ Plus Medical, Renax Biomedical Technology, Elcam Medical, and Promepla are driving innovation and competition within the market, fostering ongoing improvements in product design and functionality.
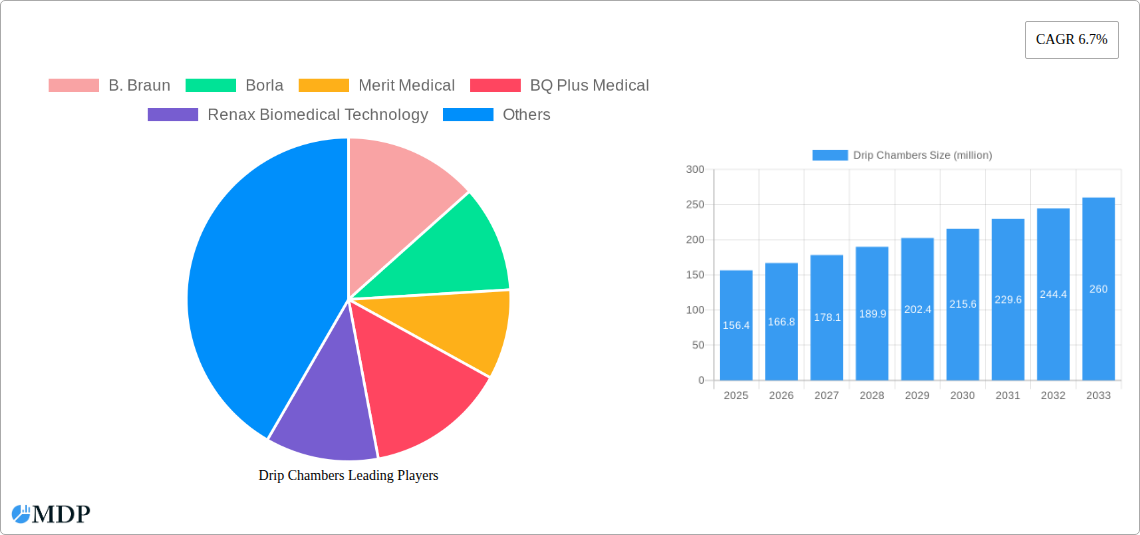
Drip Chambers Market Size (In Million)
Growth within specific regional markets will vary, influenced by factors such as healthcare infrastructure development, regulatory landscapes, and per capita healthcare expenditure. For instance, regions with robust healthcare systems and higher adoption of advanced medical technologies are likely to witness faster growth compared to others. However, challenges such as stringent regulatory approvals and the potential for material-related adverse events could act as restraints. Nevertheless, the overall market outlook remains positive, driven by continuous innovation, the aging global population requiring increased medical intervention, and growing awareness about the benefits of improved intravenous fluid management. The market is poised for significant expansion over the forecast period, presenting lucrative opportunities for existing and new market entrants.
Drip Chambers Company Market Share
Drip Chambers Market Report: A Comprehensive Analysis of a Multi-Million Dollar Industry (2019-2033)
This comprehensive report provides an in-depth analysis of the global Drip Chambers market, projecting a value exceeding $XX million by 2033. It covers the historical period (2019-2024), the base year (2025), and forecasts the market's trajectory until 2033, offering invaluable insights for industry stakeholders, investors, and strategic decision-makers. The report leverages extensive research and data analysis to present a clear picture of market dynamics, trends, and future opportunities.
Drip Chambers Market Dynamics & Concentration
The global drip chambers market, valued at $XX million in 2025, exhibits a moderately concentrated landscape. Key players such as B. Braun, Borla, Merit Medical, BQ Plus Medical, Renax Biomedical Technology, Elcam Medical, and Promepla hold significant market share, though the exact percentages vary by region and product segment. Innovation drives market growth, with ongoing development of improved materials, features (e.g., integrated sensors), and improved manufacturing processes. Stringent regulatory frameworks, particularly concerning biocompatibility and sterility, present both challenges and opportunities for market entrants. The market also sees some degree of substitution with alternative fluid delivery systems, though drip chambers remain prevalent in many applications. End-user trends, such as increasing adoption in home healthcare and ambulatory settings, significantly influence market demand. Finally, M&A activity in the medical device sector, with an estimated XX deals in the last 5 years focused on drip chamber related technologies, further shapes the market's competitive dynamics.
Drip Chambers Industry Trends & Analysis
The drip chambers market is experiencing robust growth, with a projected CAGR of XX% during the forecast period (2025-2033). This growth is fueled by several factors: a rising global geriatric population requiring increased intravenous therapy, expanding healthcare infrastructure in developing economies, technological advancements leading to improved drip chamber designs and functionalities, and increased preference for efficient and reliable fluid management solutions. Market penetration remains relatively high in developed nations but presents significant untapped potential in emerging markets. The competitive landscape is dynamic, with both established players and new entrants vying for market share through product innovation, strategic partnerships, and aggressive marketing strategies. Technological disruptions are mainly focused on integration with smart devices for improved monitoring and data analysis, driving a shift toward sophisticated and connected healthcare solutions.
Leading Markets & Segments in Drip Chambers
The North American region currently dominates the global drip chambers market, driven by factors such as high healthcare expenditure, advanced medical infrastructure, and strong regulatory support. Within North America, the United States holds the largest market share. Key growth drivers in this region include:
- Robust healthcare infrastructure: Extensive network of hospitals and clinics ensures high demand.
- Technological advancements: Early adoption of innovative drip chamber designs and features.
- Favorable reimbursement policies: Government and private insurance coverage fosters market access.
In Europe, strong government regulations and significant investment in healthcare infrastructure contribute to market growth, although at a slightly slower pace than North America. Asia Pacific exhibits the highest growth potential due to a rapidly expanding healthcare sector and rising disposable incomes.
Drip Chambers Product Developments
Recent product innovations include drip chambers incorporating features like improved leak-prevention mechanisms, enhanced visibility scales, and integrated alarms for monitoring fluid levels. These advancements aim to improve accuracy, reduce errors, and enhance patient safety. The focus is on creating products that are user-friendly, cost-effective, and align with evolving clinical needs. Companies are also emphasizing the use of biocompatible materials to minimize the risk of adverse reactions.
Key Drivers of Drip Chambers Growth
Several factors contribute to the growth of the drip chambers market:
- Increasing prevalence of chronic diseases: Leading to a higher demand for intravenous therapies.
- Technological advancements: Improved designs, enhanced features, and integrated monitoring systems.
- Rising healthcare expenditure: Increased investment in healthcare infrastructure and medical devices.
- Stringent regulatory frameworks: Ensuring product safety and quality, attracting investment and consumer confidence.
Challenges in the Drip Chambers Market
The market faces challenges such as:
- Stringent regulatory approvals: Lengthy and complex processes can delay product launches.
- Supply chain disruptions: Global events can impact the availability of raw materials and components.
- Intense competition: Established players and new entrants compete aggressively on price and features.
These factors can lead to variability in the production and supply of drip chambers and influence market prices.
Emerging Opportunities in Drip Chambers
The integration of smart technologies, including sensors and connectivity features, presents significant opportunities. Strategic partnerships between drip chamber manufacturers and healthcare technology companies can unlock new growth avenues. Expansion into emerging markets with untapped potential, combined with a focus on cost-effective solutions, can further drive market expansion.
Leading Players in the Drip Chambers Sector
- B. Braun
- Borla
- Merit Medical
- BQ Plus Medical
- Renax Biomedical Technology
- Elcam Medical
- Promepla
Key Milestones in Drip Chambers Industry
- 2020: Introduction of a new drip chamber design incorporating improved leak-prevention technology by B. Braun.
- 2022: Merit Medical acquired a smaller drip chamber manufacturer, expanding its product portfolio.
- 2023: Several companies launched drip chambers with integrated sensors for remote monitoring capabilities. (Specific company details unavailable)
Strategic Outlook for Drip Chambers Market
The future of the drip chambers market appears promising, with continued growth driven by technological advancements, expanding healthcare infrastructure, and the increasing prevalence of chronic diseases. Companies that prioritize innovation, strategic partnerships, and a focus on emerging markets are poised to capture significant market share in the years to come. The market's growth is expected to be sustained by continuous improvement in product features and functionalities.
Drip Chambers Segmentation
-
1. Application
- 1.1. Hospitals
- 1.2. Clinics
- 1.3. Others
-
2. Types
- 2.1. Non-Vented Drip Chambers
- 2.2. Vented Drip Chambers
Drip Chambers Segmentation By Geography
-
1. North America
- 1.1. United States
- 1.2. Canada
- 1.3. Mexico
-
2. South America
- 2.1. Brazil
- 2.2. Argentina
- 2.3. Rest of South America
-
3. Europe
- 3.1. United Kingdom
- 3.2. Germany
- 3.3. France
- 3.4. Italy
- 3.5. Spain
- 3.6. Russia
- 3.7. Benelux
- 3.8. Nordics
- 3.9. Rest of Europe
-
4. Middle East & Africa
- 4.1. Turkey
- 4.2. Israel
- 4.3. GCC
- 4.4. North Africa
- 4.5. South Africa
- 4.6. Rest of Middle East & Africa
-
5. Asia Pacific
- 5.1. China
- 5.2. India
- 5.3. Japan
- 5.4. South Korea
- 5.5. ASEAN
- 5.6. Oceania
- 5.7. Rest of Asia Pacific
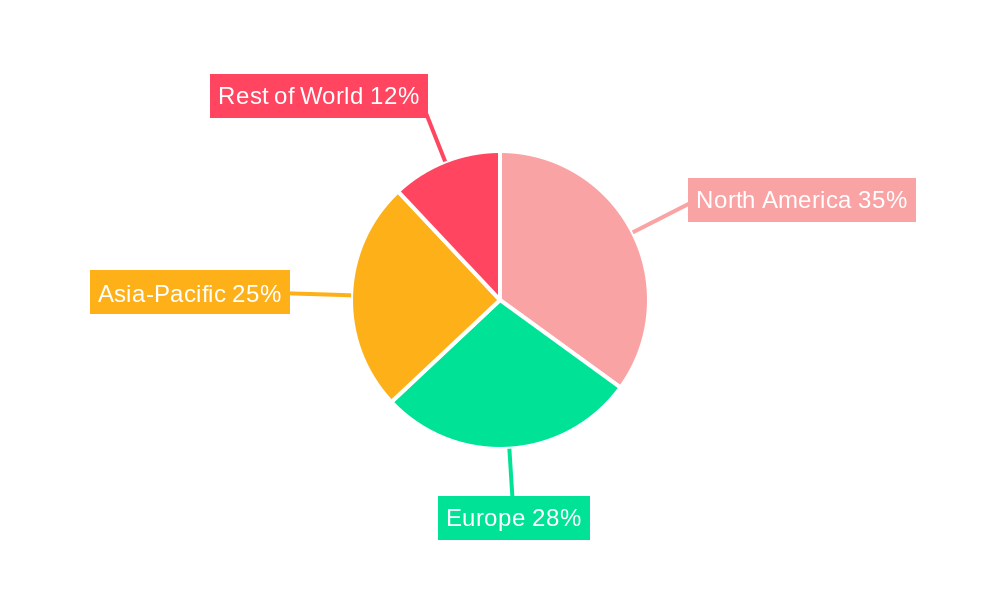
Drip Chambers Regional Market Share
Geographic Coverage of Drip Chambers
Drip Chambers REPORT HIGHLIGHTS
| Aspects | Details |
|---|---|
| Study Period | 2020-2034 |
| Base Year | 2025 |
| Estimated Year | 2026 |
| Forecast Period | 2026-2034 |
| Historical Period | 2020-2025 |
| Growth Rate | CAGR of 6.7% from 2020-2034 |
| Segmentation |
|
Table of Contents
- 1. Introduction
- 1.1. Research Scope
- 1.2. Market Segmentation
- 1.3. Research Objective
- 1.4. Definitions and Assumptions
- 2. Executive Summary
- 2.1. Market Snapshot
- 3. Market Dynamics
- 3.1. Market Drivers
- 3.2. Market Restrains
- 3.3. Market Trends
- 3.4. Market Opportunities
- 4. Market Factor Analysis
- 4.1. Porters Five Forces
- 4.1.1. Bargaining Power of Suppliers
- 4.1.2. Bargaining Power of Buyers
- 4.1.3. Threat of New Entrants
- 4.1.4. Threat of Substitutes
- 4.1.5. Competitive Rivalry
- 4.2. PESTEL analysis
- 4.3. BCG Analysis
- 4.3.1. Stars (High Growth, High Market Share)
- 4.3.2. Cash Cows (Low Growth, High Market Share)
- 4.3.3. Question Mark (High Growth, Low Market Share)
- 4.3.4. Dogs (Low Growth, Low Market Share)
- 4.4. Ansoff Matrix Analysis
- 4.5. Supply Chain Analysis
- 4.6. Regulatory Landscape
- 4.7. Current Market Potential and Opportunity Assessment (TAM–SAM–SOM Framework)
- 4.8. MDP Analyst Note
- 4.1. Porters Five Forces
- 5. Market Analysis, Insights and Forecast 2021-2033
- 5.1. Market Analysis, Insights and Forecast - by Application
- 5.1.1. Hospitals
- 5.1.2. Clinics
- 5.1.3. Others
- 5.2. Market Analysis, Insights and Forecast - by Types
- 5.2.1. Non-Vented Drip Chambers
- 5.2.2. Vented Drip Chambers
- 5.3. Market Analysis, Insights and Forecast - by Region
- 5.3.1. North America
- 5.3.2. South America
- 5.3.3. Europe
- 5.3.4. Middle East & Africa
- 5.3.5. Asia Pacific
- 5.1. Market Analysis, Insights and Forecast - by Application
- 6. Global Drip Chambers Analysis, Insights and Forecast, 2021-2033
- 6.1. Market Analysis, Insights and Forecast - by Application
- 6.1.1. Hospitals
- 6.1.2. Clinics
- 6.1.3. Others
- 6.2. Market Analysis, Insights and Forecast - by Types
- 6.2.1. Non-Vented Drip Chambers
- 6.2.2. Vented Drip Chambers
- 6.1. Market Analysis, Insights and Forecast - by Application
- 7. North America Drip Chambers Analysis, Insights and Forecast, 2020-2032
- 7.1. Market Analysis, Insights and Forecast - by Application
- 7.1.1. Hospitals
- 7.1.2. Clinics
- 7.1.3. Others
- 7.2. Market Analysis, Insights and Forecast - by Types
- 7.2.1. Non-Vented Drip Chambers
- 7.2.2. Vented Drip Chambers
- 7.1. Market Analysis, Insights and Forecast - by Application
- 8. South America Drip Chambers Analysis, Insights and Forecast, 2020-2032
- 8.1. Market Analysis, Insights and Forecast - by Application
- 8.1.1. Hospitals
- 8.1.2. Clinics
- 8.1.3. Others
- 8.2. Market Analysis, Insights and Forecast - by Types
- 8.2.1. Non-Vented Drip Chambers
- 8.2.2. Vented Drip Chambers
- 8.1. Market Analysis, Insights and Forecast - by Application
- 9. Europe Drip Chambers Analysis, Insights and Forecast, 2020-2032
- 9.1. Market Analysis, Insights and Forecast - by Application
- 9.1.1. Hospitals
- 9.1.2. Clinics
- 9.1.3. Others
- 9.2. Market Analysis, Insights and Forecast - by Types
- 9.2.1. Non-Vented Drip Chambers
- 9.2.2. Vented Drip Chambers
- 9.1. Market Analysis, Insights and Forecast - by Application
- 10. Middle East & Africa Drip Chambers Analysis, Insights and Forecast, 2020-2032
- 10.1. Market Analysis, Insights and Forecast - by Application
- 10.1.1. Hospitals
- 10.1.2. Clinics
- 10.1.3. Others
- 10.2. Market Analysis, Insights and Forecast - by Types
- 10.2.1. Non-Vented Drip Chambers
- 10.2.2. Vented Drip Chambers
- 10.1. Market Analysis, Insights and Forecast - by Application
- 11. Asia Pacific Drip Chambers Analysis, Insights and Forecast, 2020-2032
- 11.1. Market Analysis, Insights and Forecast - by Application
- 11.1.1. Hospitals
- 11.1.2. Clinics
- 11.1.3. Others
- 11.2. Market Analysis, Insights and Forecast - by Types
- 11.2.1. Non-Vented Drip Chambers
- 11.2.2. Vented Drip Chambers
- 11.1. Market Analysis, Insights and Forecast - by Application
- 12. Competitive Analysis
- 12.1. Company Profiles
- 12.1.1 B. Braun
- 12.1.1.1. Company Overview
- 12.1.1.2. Products
- 12.1.1.3. Company Financials
- 12.1.1.4. SWOT Analysis
- 12.1.2 Borla
- 12.1.2.1. Company Overview
- 12.1.2.2. Products
- 12.1.2.3. Company Financials
- 12.1.2.4. SWOT Analysis
- 12.1.3 Merit Medical
- 12.1.3.1. Company Overview
- 12.1.3.2. Products
- 12.1.3.3. Company Financials
- 12.1.3.4. SWOT Analysis
- 12.1.4 BQ Plus Medical
- 12.1.4.1. Company Overview
- 12.1.4.2. Products
- 12.1.4.3. Company Financials
- 12.1.4.4. SWOT Analysis
- 12.1.5 Renax Biomedical Technology
- 12.1.5.1. Company Overview
- 12.1.5.2. Products
- 12.1.5.3. Company Financials
- 12.1.5.4. SWOT Analysis
- 12.1.6 Elcam Medical
- 12.1.6.1. Company Overview
- 12.1.6.2. Products
- 12.1.6.3. Company Financials
- 12.1.6.4. SWOT Analysis
- 12.1.7 Promepla
- 12.1.7.1. Company Overview
- 12.1.7.2. Products
- 12.1.7.3. Company Financials
- 12.1.7.4. SWOT Analysis
- 12.1.1 B. Braun
- 12.2. Market Entropy
- 12.2.1 Company's Key Areas Served
- 12.2.2 Recent Developments
- 12.3. Company Market Share Analysis 2025
- 12.3.1 Top 5 Companies Market Share Analysis
- 12.3.2 Top 3 Companies Market Share Analysis
- 12.4. List of Potential Customers
- 13. Research Methodology
List of Figures
- Figure 1: Global Drip Chambers Revenue Breakdown (million, %) by Region 2025 & 2033
- Figure 2: Global Drip Chambers Volume Breakdown (K, %) by Region 2025 & 2033
- Figure 3: North America Drip Chambers Revenue (million), by Application 2025 & 2033
- Figure 4: North America Drip Chambers Volume (K), by Application 2025 & 2033
- Figure 5: North America Drip Chambers Revenue Share (%), by Application 2025 & 2033
- Figure 6: North America Drip Chambers Volume Share (%), by Application 2025 & 2033
- Figure 7: North America Drip Chambers Revenue (million), by Types 2025 & 2033
- Figure 8: North America Drip Chambers Volume (K), by Types 2025 & 2033
- Figure 9: North America Drip Chambers Revenue Share (%), by Types 2025 & 2033
- Figure 10: North America Drip Chambers Volume Share (%), by Types 2025 & 2033
- Figure 11: North America Drip Chambers Revenue (million), by Country 2025 & 2033
- Figure 12: North America Drip Chambers Volume (K), by Country 2025 & 2033
- Figure 13: North America Drip Chambers Revenue Share (%), by Country 2025 & 2033
- Figure 14: North America Drip Chambers Volume Share (%), by Country 2025 & 2033
- Figure 15: South America Drip Chambers Revenue (million), by Application 2025 & 2033
- Figure 16: South America Drip Chambers Volume (K), by Application 2025 & 2033
- Figure 17: South America Drip Chambers Revenue Share (%), by Application 2025 & 2033
- Figure 18: South America Drip Chambers Volume Share (%), by Application 2025 & 2033
- Figure 19: South America Drip Chambers Revenue (million), by Types 2025 & 2033
- Figure 20: South America Drip Chambers Volume (K), by Types 2025 & 2033
- Figure 21: South America Drip Chambers Revenue Share (%), by Types 2025 & 2033
- Figure 22: South America Drip Chambers Volume Share (%), by Types 2025 & 2033
- Figure 23: South America Drip Chambers Revenue (million), by Country 2025 & 2033
- Figure 24: South America Drip Chambers Volume (K), by Country 2025 & 2033
- Figure 25: South America Drip Chambers Revenue Share (%), by Country 2025 & 2033
- Figure 26: South America Drip Chambers Volume Share (%), by Country 2025 & 2033
- Figure 27: Europe Drip Chambers Revenue (million), by Application 2025 & 2033
- Figure 28: Europe Drip Chambers Volume (K), by Application 2025 & 2033
- Figure 29: Europe Drip Chambers Revenue Share (%), by Application 2025 & 2033
- Figure 30: Europe Drip Chambers Volume Share (%), by Application 2025 & 2033
- Figure 31: Europe Drip Chambers Revenue (million), by Types 2025 & 2033
- Figure 32: Europe Drip Chambers Volume (K), by Types 2025 & 2033
- Figure 33: Europe Drip Chambers Revenue Share (%), by Types 2025 & 2033
- Figure 34: Europe Drip Chambers Volume Share (%), by Types 2025 & 2033
- Figure 35: Europe Drip Chambers Revenue (million), by Country 2025 & 2033
- Figure 36: Europe Drip Chambers Volume (K), by Country 2025 & 2033
- Figure 37: Europe Drip Chambers Revenue Share (%), by Country 2025 & 2033
- Figure 38: Europe Drip Chambers Volume Share (%), by Country 2025 & 2033
- Figure 39: Middle East & Africa Drip Chambers Revenue (million), by Application 2025 & 2033
- Figure 40: Middle East & Africa Drip Chambers Volume (K), by Application 2025 & 2033
- Figure 41: Middle East & Africa Drip Chambers Revenue Share (%), by Application 2025 & 2033
- Figure 42: Middle East & Africa Drip Chambers Volume Share (%), by Application 2025 & 2033
- Figure 43: Middle East & Africa Drip Chambers Revenue (million), by Types 2025 & 2033
- Figure 44: Middle East & Africa Drip Chambers Volume (K), by Types 2025 & 2033
- Figure 45: Middle East & Africa Drip Chambers Revenue Share (%), by Types 2025 & 2033
- Figure 46: Middle East & Africa Drip Chambers Volume Share (%), by Types 2025 & 2033
- Figure 47: Middle East & Africa Drip Chambers Revenue (million), by Country 2025 & 2033
- Figure 48: Middle East & Africa Drip Chambers Volume (K), by Country 2025 & 2033
- Figure 49: Middle East & Africa Drip Chambers Revenue Share (%), by Country 2025 & 2033
- Figure 50: Middle East & Africa Drip Chambers Volume Share (%), by Country 2025 & 2033
- Figure 51: Asia Pacific Drip Chambers Revenue (million), by Application 2025 & 2033
- Figure 52: Asia Pacific Drip Chambers Volume (K), by Application 2025 & 2033
- Figure 53: Asia Pacific Drip Chambers Revenue Share (%), by Application 2025 & 2033
- Figure 54: Asia Pacific Drip Chambers Volume Share (%), by Application 2025 & 2033
- Figure 55: Asia Pacific Drip Chambers Revenue (million), by Types 2025 & 2033
- Figure 56: Asia Pacific Drip Chambers Volume (K), by Types 2025 & 2033
- Figure 57: Asia Pacific Drip Chambers Revenue Share (%), by Types 2025 & 2033
- Figure 58: Asia Pacific Drip Chambers Volume Share (%), by Types 2025 & 2033
- Figure 59: Asia Pacific Drip Chambers Revenue (million), by Country 2025 & 2033
- Figure 60: Asia Pacific Drip Chambers Volume (K), by Country 2025 & 2033
- Figure 61: Asia Pacific Drip Chambers Revenue Share (%), by Country 2025 & 2033
- Figure 62: Asia Pacific Drip Chambers Volume Share (%), by Country 2025 & 2033
List of Tables
- Table 1: Global Drip Chambers Revenue million Forecast, by Application 2020 & 2033
- Table 2: Global Drip Chambers Volume K Forecast, by Application 2020 & 2033
- Table 3: Global Drip Chambers Revenue million Forecast, by Types 2020 & 2033
- Table 4: Global Drip Chambers Volume K Forecast, by Types 2020 & 2033
- Table 5: Global Drip Chambers Revenue million Forecast, by Region 2020 & 2033
- Table 6: Global Drip Chambers Volume K Forecast, by Region 2020 & 2033
- Table 7: Global Drip Chambers Revenue million Forecast, by Application 2020 & 2033
- Table 8: Global Drip Chambers Volume K Forecast, by Application 2020 & 2033
- Table 9: Global Drip Chambers Revenue million Forecast, by Types 2020 & 2033
- Table 10: Global Drip Chambers Volume K Forecast, by Types 2020 & 2033
- Table 11: Global Drip Chambers Revenue million Forecast, by Country 2020 & 2033
- Table 12: Global Drip Chambers Volume K Forecast, by Country 2020 & 2033
- Table 13: United States Drip Chambers Revenue (million) Forecast, by Application 2020 & 2033
- Table 14: United States Drip Chambers Volume (K) Forecast, by Application 2020 & 2033
- Table 15: Canada Drip Chambers Revenue (million) Forecast, by Application 2020 & 2033
- Table 16: Canada Drip Chambers Volume (K) Forecast, by Application 2020 & 2033
- Table 17: Mexico Drip Chambers Revenue (million) Forecast, by Application 2020 & 2033
- Table 18: Mexico Drip Chambers Volume (K) Forecast, by Application 2020 & 2033
- Table 19: Global Drip Chambers Revenue million Forecast, by Application 2020 & 2033
- Table 20: Global Drip Chambers Volume K Forecast, by Application 2020 & 2033
- Table 21: Global Drip Chambers Revenue million Forecast, by Types 2020 & 2033
- Table 22: Global Drip Chambers Volume K Forecast, by Types 2020 & 2033
- Table 23: Global Drip Chambers Revenue million Forecast, by Country 2020 & 2033
- Table 24: Global Drip Chambers Volume K Forecast, by Country 2020 & 2033
- Table 25: Brazil Drip Chambers Revenue (million) Forecast, by Application 2020 & 2033
- Table 26: Brazil Drip Chambers Volume (K) Forecast, by Application 2020 & 2033
- Table 27: Argentina Drip Chambers Revenue (million) Forecast, by Application 2020 & 2033
- Table 28: Argentina Drip Chambers Volume (K) Forecast, by Application 2020 & 2033
- Table 29: Rest of South America Drip Chambers Revenue (million) Forecast, by Application 2020 & 2033
- Table 30: Rest of South America Drip Chambers Volume (K) Forecast, by Application 2020 & 2033
- Table 31: Global Drip Chambers Revenue million Forecast, by Application 2020 & 2033
- Table 32: Global Drip Chambers Volume K Forecast, by Application 2020 & 2033
- Table 33: Global Drip Chambers Revenue million Forecast, by Types 2020 & 2033
- Table 34: Global Drip Chambers Volume K Forecast, by Types 2020 & 2033
- Table 35: Global Drip Chambers Revenue million Forecast, by Country 2020 & 2033
- Table 36: Global Drip Chambers Volume K Forecast, by Country 2020 & 2033
- Table 37: United Kingdom Drip Chambers Revenue (million) Forecast, by Application 2020 & 2033
- Table 38: United Kingdom Drip Chambers Volume (K) Forecast, by Application 2020 & 2033
- Table 39: Germany Drip Chambers Revenue (million) Forecast, by Application 2020 & 2033
- Table 40: Germany Drip Chambers Volume (K) Forecast, by Application 2020 & 2033
- Table 41: France Drip Chambers Revenue (million) Forecast, by Application 2020 & 2033
- Table 42: France Drip Chambers Volume (K) Forecast, by Application 2020 & 2033
- Table 43: Italy Drip Chambers Revenue (million) Forecast, by Application 2020 & 2033
- Table 44: Italy Drip Chambers Volume (K) Forecast, by Application 2020 & 2033
- Table 45: Spain Drip Chambers Revenue (million) Forecast, by Application 2020 & 2033
- Table 46: Spain Drip Chambers Volume (K) Forecast, by Application 2020 & 2033
- Table 47: Russia Drip Chambers Revenue (million) Forecast, by Application 2020 & 2033
- Table 48: Russia Drip Chambers Volume (K) Forecast, by Application 2020 & 2033
- Table 49: Benelux Drip Chambers Revenue (million) Forecast, by Application 2020 & 2033
- Table 50: Benelux Drip Chambers Volume (K) Forecast, by Application 2020 & 2033
- Table 51: Nordics Drip Chambers Revenue (million) Forecast, by Application 2020 & 2033
- Table 52: Nordics Drip Chambers Volume (K) Forecast, by Application 2020 & 2033
- Table 53: Rest of Europe Drip Chambers Revenue (million) Forecast, by Application 2020 & 2033
- Table 54: Rest of Europe Drip Chambers Volume (K) Forecast, by Application 2020 & 2033
- Table 55: Global Drip Chambers Revenue million Forecast, by Application 2020 & 2033
- Table 56: Global Drip Chambers Volume K Forecast, by Application 2020 & 2033
- Table 57: Global Drip Chambers Revenue million Forecast, by Types 2020 & 2033
- Table 58: Global Drip Chambers Volume K Forecast, by Types 2020 & 2033
- Table 59: Global Drip Chambers Revenue million Forecast, by Country 2020 & 2033
- Table 60: Global Drip Chambers Volume K Forecast, by Country 2020 & 2033
- Table 61: Turkey Drip Chambers Revenue (million) Forecast, by Application 2020 & 2033
- Table 62: Turkey Drip Chambers Volume (K) Forecast, by Application 2020 & 2033
- Table 63: Israel Drip Chambers Revenue (million) Forecast, by Application 2020 & 2033
- Table 64: Israel Drip Chambers Volume (K) Forecast, by Application 2020 & 2033
- Table 65: GCC Drip Chambers Revenue (million) Forecast, by Application 2020 & 2033
- Table 66: GCC Drip Chambers Volume (K) Forecast, by Application 2020 & 2033
- Table 67: North Africa Drip Chambers Revenue (million) Forecast, by Application 2020 & 2033
- Table 68: North Africa Drip Chambers Volume (K) Forecast, by Application 2020 & 2033
- Table 69: South Africa Drip Chambers Revenue (million) Forecast, by Application 2020 & 2033
- Table 70: South Africa Drip Chambers Volume (K) Forecast, by Application 2020 & 2033
- Table 71: Rest of Middle East & Africa Drip Chambers Revenue (million) Forecast, by Application 2020 & 2033
- Table 72: Rest of Middle East & Africa Drip Chambers Volume (K) Forecast, by Application 2020 & 2033
- Table 73: Global Drip Chambers Revenue million Forecast, by Application 2020 & 2033
- Table 74: Global Drip Chambers Volume K Forecast, by Application 2020 & 2033
- Table 75: Global Drip Chambers Revenue million Forecast, by Types 2020 & 2033
- Table 76: Global Drip Chambers Volume K Forecast, by Types 2020 & 2033
- Table 77: Global Drip Chambers Revenue million Forecast, by Country 2020 & 2033
- Table 78: Global Drip Chambers Volume K Forecast, by Country 2020 & 2033
- Table 79: China Drip Chambers Revenue (million) Forecast, by Application 2020 & 2033
- Table 80: China Drip Chambers Volume (K) Forecast, by Application 2020 & 2033
- Table 81: India Drip Chambers Revenue (million) Forecast, by Application 2020 & 2033
- Table 82: India Drip Chambers Volume (K) Forecast, by Application 2020 & 2033
- Table 83: Japan Drip Chambers Revenue (million) Forecast, by Application 2020 & 2033
- Table 84: Japan Drip Chambers Volume (K) Forecast, by Application 2020 & 2033
- Table 85: South Korea Drip Chambers Revenue (million) Forecast, by Application 2020 & 2033
- Table 86: South Korea Drip Chambers Volume (K) Forecast, by Application 2020 & 2033
- Table 87: ASEAN Drip Chambers Revenue (million) Forecast, by Application 2020 & 2033
- Table 88: ASEAN Drip Chambers Volume (K) Forecast, by Application 2020 & 2033
- Table 89: Oceania Drip Chambers Revenue (million) Forecast, by Application 2020 & 2033
- Table 90: Oceania Drip Chambers Volume (K) Forecast, by Application 2020 & 2033
- Table 91: Rest of Asia Pacific Drip Chambers Revenue (million) Forecast, by Application 2020 & 2033
- Table 92: Rest of Asia Pacific Drip Chambers Volume (K) Forecast, by Application 2020 & 2033
Frequently Asked Questions
1. What is the projected Compound Annual Growth Rate (CAGR) of the Drip Chambers?
The projected CAGR is approximately 6.7%.
2. Which companies are prominent players in the Drip Chambers?
Key companies in the market include B. Braun, Borla, Merit Medical, BQ Plus Medical, Renax Biomedical Technology, Elcam Medical, Promepla.
3. What are the main segments of the Drip Chambers?
The market segments include Application, Types.
4. Can you provide details about the market size?
The market size is estimated to be USD 156.4 million as of 2022.
5. What are some drivers contributing to market growth?
N/A
6. What are the notable trends driving market growth?
N/A
7. Are there any restraints impacting market growth?
N/A
8. Can you provide examples of recent developments in the market?
N/A
9. What pricing options are available for accessing the report?
Pricing options include single-user, multi-user, and enterprise licenses priced at USD 3950.00, USD 5925.00, and USD 7900.00 respectively.
10. Is the market size provided in terms of value or volume?
The market size is provided in terms of value, measured in million and volume, measured in K.
11. Are there any specific market keywords associated with the report?
Yes, the market keyword associated with the report is "Drip Chambers," which aids in identifying and referencing the specific market segment covered.
12. How do I determine which pricing option suits my needs best?
The pricing options vary based on user requirements and access needs. Individual users may opt for single-user licenses, while businesses requiring broader access may choose multi-user or enterprise licenses for cost-effective access to the report.
13. Are there any additional resources or data provided in the Drip Chambers report?
While the report offers comprehensive insights, it's advisable to review the specific contents or supplementary materials provided to ascertain if additional resources or data are available.
14. How can I stay updated on further developments or reports in the Drip Chambers?
To stay informed about further developments, trends, and reports in the Drip Chambers, consider subscribing to industry newsletters, following relevant companies and organizations, or regularly checking reputable industry news sources and publications.
Methodology
Step 1 - Identification of Relevant Samples Size from Population Database


Step 2 - Approaches for Defining Global Market Size (Value, Volume* & Price*)

Note*: In applicable scenarios
Step 3 - Data Sources
Primary Research
- Web Analytics
- Survey Reports
- Research Institute
- Latest Research Reports
- Opinion Leaders
Secondary Research
- Annual Reports
- White Paper
- Latest Press Release
- Industry Association
- Paid Database
- Investor Presentations

Step 4 - Data Triangulation
Involves using different sources of information in order to increase the validity of a study
These sources are likely to be stakeholders in a program - participants, other researchers, program staff, other community members, and so on.
Then we put all data in single framework & apply various statistical tools to find out the dynamic on the market.
During the analysis stage, feedback from the stakeholder groups would be compared to determine areas of agreement as well as areas of divergence