

Key Insights
The global Display Device Glass Substrate market is poised for robust expansion, projected to reach approximately $7.2 billion in 2024, with an anticipated Compound Annual Growth Rate (CAGR) of 3.7% through 2033. This growth is largely propelled by escalating demand across key applications such as smartphones, computers, and televisions, fueled by the continuous innovation in display technologies and an increasing consumer appetite for higher resolution and more immersive visual experiences. The market's dynamic is also influenced by advancements in manufacturing processes, leading to the development of specialized glass substrates like high heat-resistant and low thermal compaction glass, alongside alkali-free variants, which cater to the evolving needs of modern electronic devices. Furthermore, the growing penetration of smart devices and the burgeoning Internet of Things (IoT) ecosystem are creating new avenues for market growth, as advanced display substrates become integral to a wider array of connected devices.
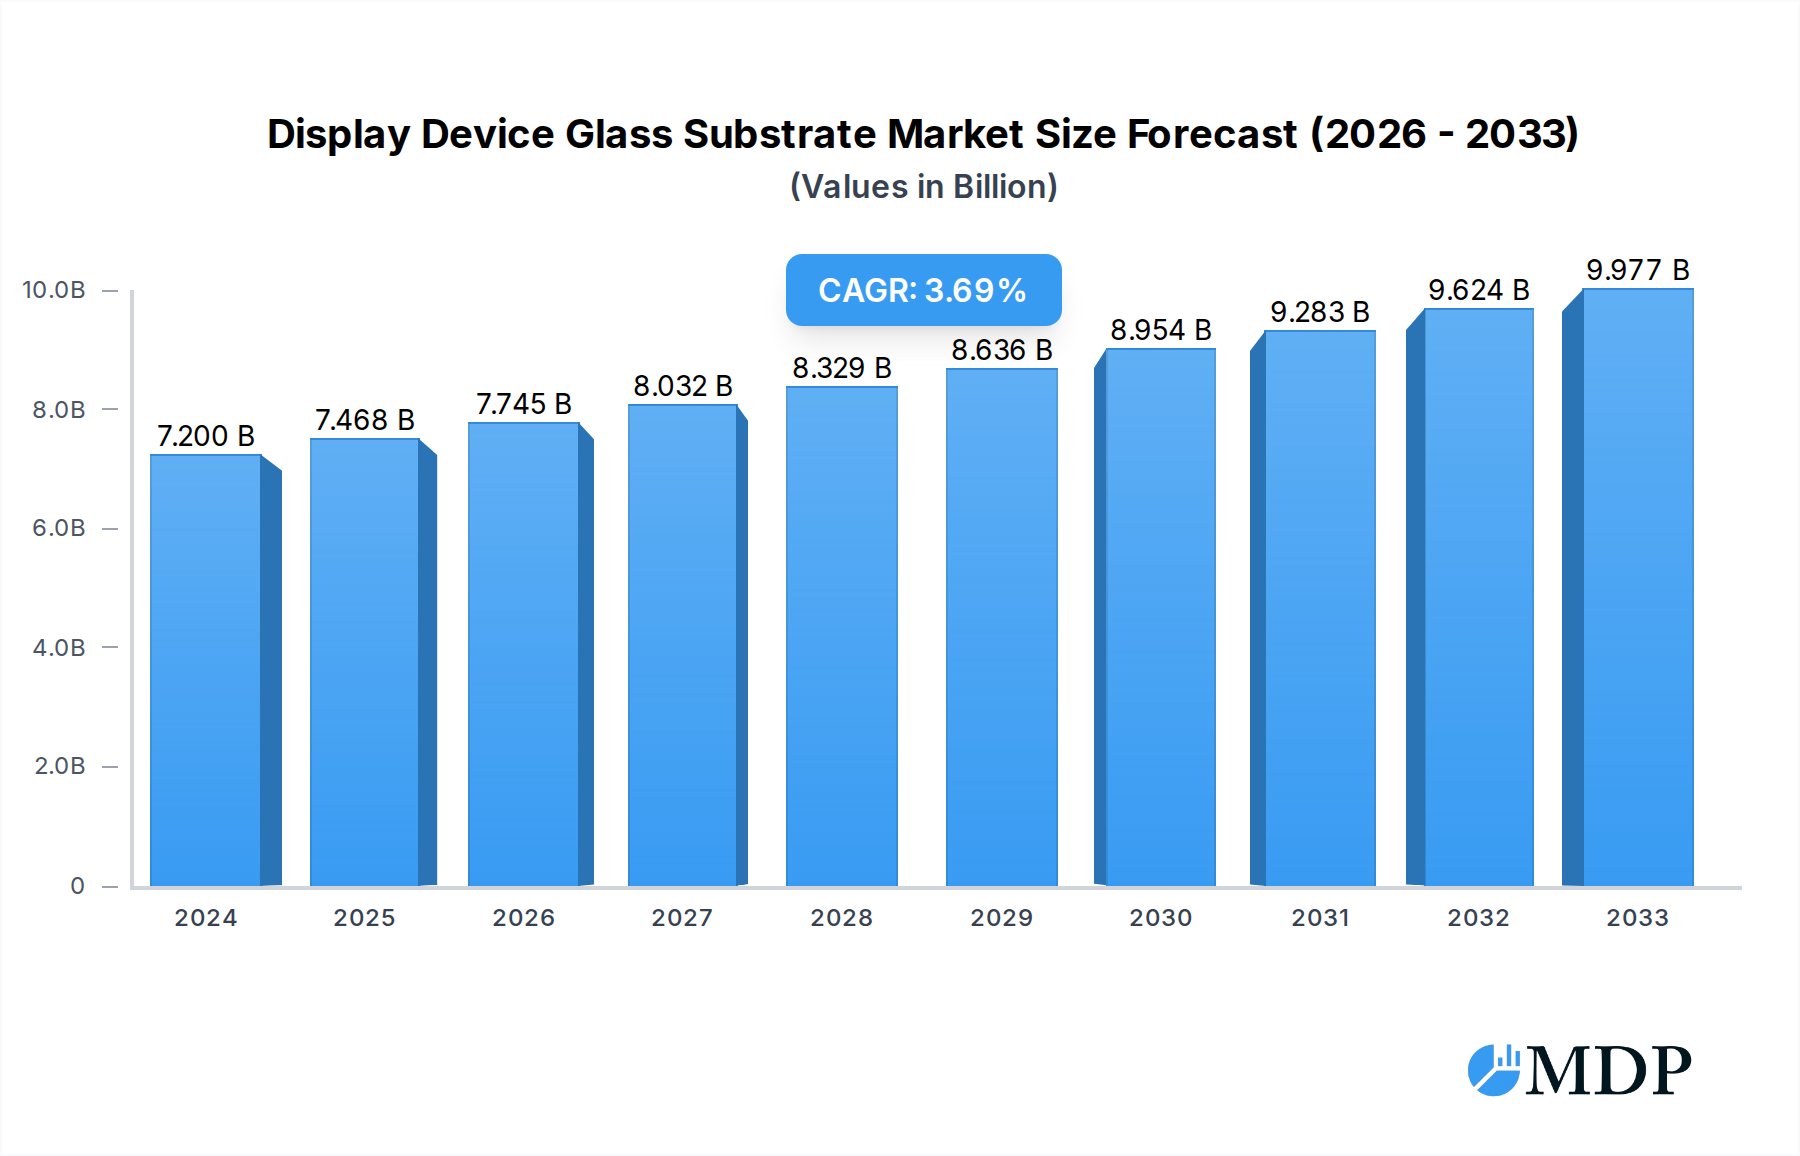
Display Device Glass Substrate Market Size (In Billion)
However, the market faces certain challenges. The development of flexible and foldable display technologies, while promising, introduces complexities in substrate manufacturing and material science, potentially impacting traditional glass substrate demand in specific segments. Intense competition among leading players like Nippon Electric Glass, Corning, and AGC necessitates continuous investment in research and development to maintain a competitive edge and offer innovative solutions at competitive price points. Geopolitical factors and supply chain disruptions can also introduce volatility. Nevertheless, the overarching trend of digitalization and the relentless pursuit of enhanced user interfaces across consumer electronics and industrial applications are expected to sustain a positive growth trajectory for the Display Device Glass Substrate market. The Asia Pacific region, particularly China, is anticipated to remain a dominant force due to its extensive manufacturing capabilities and significant consumer base.

Display Device Glass Substrate Company Market Share
Report Title: Global Display Device Glass Substrate Market: Market Dynamics, Trends, and Forecast 2019-2033
Report Description:
Dive deep into the burgeoning global display device glass substrate market with this comprehensive report. Spanning from 2019 to 2033, with a detailed focus on the base year of 2025 and an extended forecast period of 2025-2033, this study offers unparalleled insights into the market's trajectory. We analyze the critical interplay of market dynamics, emerging trends, and leading players shaping the future of smartphone display glass, tablet screen substrate, TV display glass, and other high-growth applications. Discover the latest innovations in high heat-resistant glass substrate, low thermal compaction glass substrate, and alkali-free glass substrate, essential for next-generation displays. This report provides actionable intelligence for industry stakeholders, including manufacturers, suppliers, investors, and technology developers, looking to capitalize on opportunities within this multi-billion dollar market. Gain a competitive edge by understanding market concentration, key growth drivers, leading market segments, product developments, and strategic outlooks for the display glass market.
Display Device Glass Substrate Market Dynamics & Concentration
The global display device glass substrate market is characterized by a moderate to high concentration, with key players like Nippon Electric Glass, Corning, and AGC holding substantial market shares estimated to be in the billions. Innovation is the primary driver, fueled by the relentless demand for thinner, lighter, and more durable displays across consumer electronics. Regulatory frameworks, while not overly stringent, focus on environmental compliance and material safety, influencing manufacturing processes. Product substitutes, such as flexible plastics, pose a nascent threat but are yet to achieve widespread adoption for rigid display applications. End-user trends overwhelmingly favor higher resolution, larger screen sizes, and enhanced durability for cell phone displays, computer monitors, and television screens. Mergers and acquisitions (M&A) are infrequent but strategic, aimed at acquiring advanced manufacturing capabilities or expanding market reach. The number of significant M&A deals in the historical period (2019-2024) was estimated to be less than ten, indicating a relatively stable competitive landscape with innovation being the primary battleground.
Display Device Glass Substrate Industry Trends & Analysis
The display device glass substrate industry is poised for significant expansion, driven by escalating demand for advanced electronic devices worldwide. This market is expected to witness a Compound Annual Growth Rate (CAGR) of approximately 6.5% from 2025 to 2033, reaching a market value estimated in the tens of billions. The increasing adoption of smartphones, tablets, and high-definition televisions, especially in emerging economies, serves as a primary growth engine. Technological disruptions, such as the rise of foldable and rollable displays, are creating new avenues for specialized glass substrates with enhanced flexibility and resilience. Consumer preferences are shifting towards immersive viewing experiences, demanding larger screen sizes and higher pixel densities, which in turn necessitates the development of larger and thinner glass substrates. The competitive dynamics are intense, with established players continuously investing in research and development to improve material properties like scratch resistance, impact strength, and optical clarity. Alkali-free glass substrates are gaining prominence due to their superior performance characteristics and suitability for advanced display technologies like OLED and Micro-LED. The market penetration of advanced glass substrates for premium devices is already substantial, estimated to be over 75% in high-end smartphones, and this trend is projected to expand to mid-range devices as manufacturing costs decrease. The continuous pursuit of higher refresh rates, reduced power consumption, and enhanced durability in displays will further propel the demand for innovative glass substrate solutions, ensuring robust market growth.
Leading Markets & Segments in Display Device Glass Substrate
The Asia-Pacific region stands as the undisputed leader in the global display device glass substrate market, driven by its robust manufacturing infrastructure and high consumer demand for electronic devices. Within this region, China leads by a significant margin, boasting major display panel manufacturers and a vast domestic market for cell phones, computers, and televisions. The dominance of this region is underpinned by several key drivers, including supportive government policies, substantial investments in research and development, and the presence of leading industry players like Tunghsu Optoelectronic and IRICO Group.
Dominant Region: Asia-Pacific
- Key Drivers:
- Concentration of leading display panel manufacturers.
- Massive domestic consumer market for electronic devices.
- Government incentives for advanced manufacturing.
- Well-established supply chains for raw materials and production.
- Key Drivers:
Dominant Application Segment: Cell Phone
- The cell phone segment accounts for the largest share of the display device glass substrate market, estimated to be over 50% of the total market value in 2025. This dominance is attributed to the ubiquity of smartphones globally and the constant demand for upgrades. Consumers prioritize screen quality, durability, and design, pushing manufacturers to adopt premium glass substrates. The ongoing trend towards larger displays and edge-to-edge screen designs further amplifies the need for sophisticated glass solutions.
Dominant Type Segment: Alkali-free Glass Substrate
- Alkali-free glass substrates are experiencing rapid growth and are increasingly becoming the preferred type for advanced display technologies. Their superior electrical insulation properties, higher thermal resistance, and excellent optical clarity make them indispensable for high-performance displays like OLED and Micro-LED. The shift from traditional glass types in premium smartphones and high-end televisions is a key factor in their market leadership, with their market share in this segment estimated to be exceeding 60% by 2025 and projected to grow consistently.
Display Device Glass Substrate Product Developments
Continuous product innovation is central to the display device glass substrate market. Manufacturers are focused on developing thinner, stronger, and more flexible glass solutions. Key advancements include improved scratch and impact resistance, enhanced optical transmittance, and lower surface roughness for seamless integration with display technologies. The development of high heat-resistant and low thermal compaction glass substrates is crucial for advanced manufacturing processes and improved device performance. These innovations offer competitive advantages by enabling the production of sleeker, more durable, and aesthetically pleasing displays for a wide range of consumer electronics, from smartphones to large-format televisions.
Key Drivers of Display Device Glass Substrate Growth
Several key factors are driving the growth of the display device glass substrate market. The escalating global demand for consumer electronics, particularly smartphones, tablets, and smart wearables, is a primary impetus. Technological advancements in display technologies, such as OLED, Micro-LED, and flexible displays, necessitate the development of specialized, high-performance glass substrates. Increasing consumer preference for larger screen sizes and higher resolution displays further fuels demand. Furthermore, government initiatives promoting domestic manufacturing and technological innovation in key regions contribute significantly to market expansion. Economic growth and rising disposable incomes in developing nations also play a crucial role in boosting sales of electronic devices and, consequently, their display glass components.
Challenges in the Display Device Glass Substrate Market
The display device glass substrate market faces several significant challenges. High manufacturing costs associated with producing advanced glass materials, particularly for specialized types like alkali-free and thin-film glass, can limit adoption in price-sensitive segments. Supply chain disruptions, including the availability and pricing of raw materials, can impact production volumes and profitability. Intense competition among a limited number of key players leads to price pressures and a constant need for innovation to maintain market share. Additionally, the technical complexities involved in developing and manufacturing substrates with extremely tight tolerances for next-generation displays require substantial capital investment and expertise. Environmental regulations and sustainability concerns are also increasingly influencing manufacturing processes and material choices.
Emerging Opportunities in Display Device Glass Substrate
Emerging opportunities in the display device glass substrate market are largely driven by technological breakthroughs and evolving consumer demands. The rapid growth of the 5G ecosystem is spurring demand for more advanced mobile devices with larger, higher-resolution displays, creating a significant market for premium glass substrates. The expanding market for foldable and rollable displays presents a unique opportunity for flexible and ultra-thin glass solutions. Furthermore, the increasing integration of displays in automotive interiors and augmented reality/virtual reality (AR/VR) devices opens up new application frontiers. Strategic partnerships between glass manufacturers and display panel producers are crucial for co-developing innovative solutions tailored to these emerging technologies, driving long-term market expansion.
Leading Players in the Display Device Glass Substrate Sector
- Nippon Electric Glass
- Corning
- AGC
- Tunghsu Optoelectronic
- AvanStrate
- IRICO Group
- CGC
- LG Chem
Key Milestones in Display Device Glass Substrate Industry
- 2019: Increased investment in R&D for thinner and more durable glass substrates by leading players.
- 2020: Growing adoption of alkali-free glass for OLED displays in premium smartphones.
- 2021: Exploration of advanced manufacturing techniques for larger-sized glass substrates for TVs.
- 2022: Rise in demand for specialized glass for foldable and flexible display prototypes.
- 2023: Significant advancements in chemical strengthening techniques for enhanced impact resistance.
- 2024: Focus on sustainable manufacturing practices and recycled materials in glass production.
Strategic Outlook for Display Device Glass Substrate Market
The strategic outlook for the display device glass substrate market remains highly optimistic, driven by continuous innovation and expanding applications. The market is expected to witness sustained growth fueled by the demand for advanced displays in smartphones, tablets, and the burgeoning AR/VR sectors. Key strategies for growth acceleration include deeper investment in R&D for next-generation materials like ultra-thin glass and flexible substrates, as well as the development of more energy-efficient and eco-friendly manufacturing processes. Strategic collaborations with display panel manufacturers and end-device producers will be crucial for aligning product development with market needs. Expansion into new application areas, such as automotive displays and smart surfaces, presents significant future potential.
Display Device Glass Substrate Segmentation
-
1. Application
- 1.1. Cell Phone
- 1.2. Computer
- 1.3. Television
- 1.4. Others
-
2. Types
- 2.1. High Heat-resistant and Low Thermal Compaction Glass Substrate
- 2.2. Alkali-free Glass Substrate
Display Device Glass Substrate Segmentation By Geography
-
1. North America
- 1.1. United States
- 1.2. Canada
- 1.3. Mexico
-
2. South America
- 2.1. Brazil
- 2.2. Argentina
- 2.3. Rest of South America
-
3. Europe
- 3.1. United Kingdom
- 3.2. Germany
- 3.3. France
- 3.4. Italy
- 3.5. Spain
- 3.6. Russia
- 3.7. Benelux
- 3.8. Nordics
- 3.9. Rest of Europe
-
4. Middle East & Africa
- 4.1. Turkey
- 4.2. Israel
- 4.3. GCC
- 4.4. North Africa
- 4.5. South Africa
- 4.6. Rest of Middle East & Africa
-
5. Asia Pacific
- 5.1. China
- 5.2. India
- 5.3. Japan
- 5.4. South Korea
- 5.5. ASEAN
- 5.6. Oceania
- 5.7. Rest of Asia Pacific
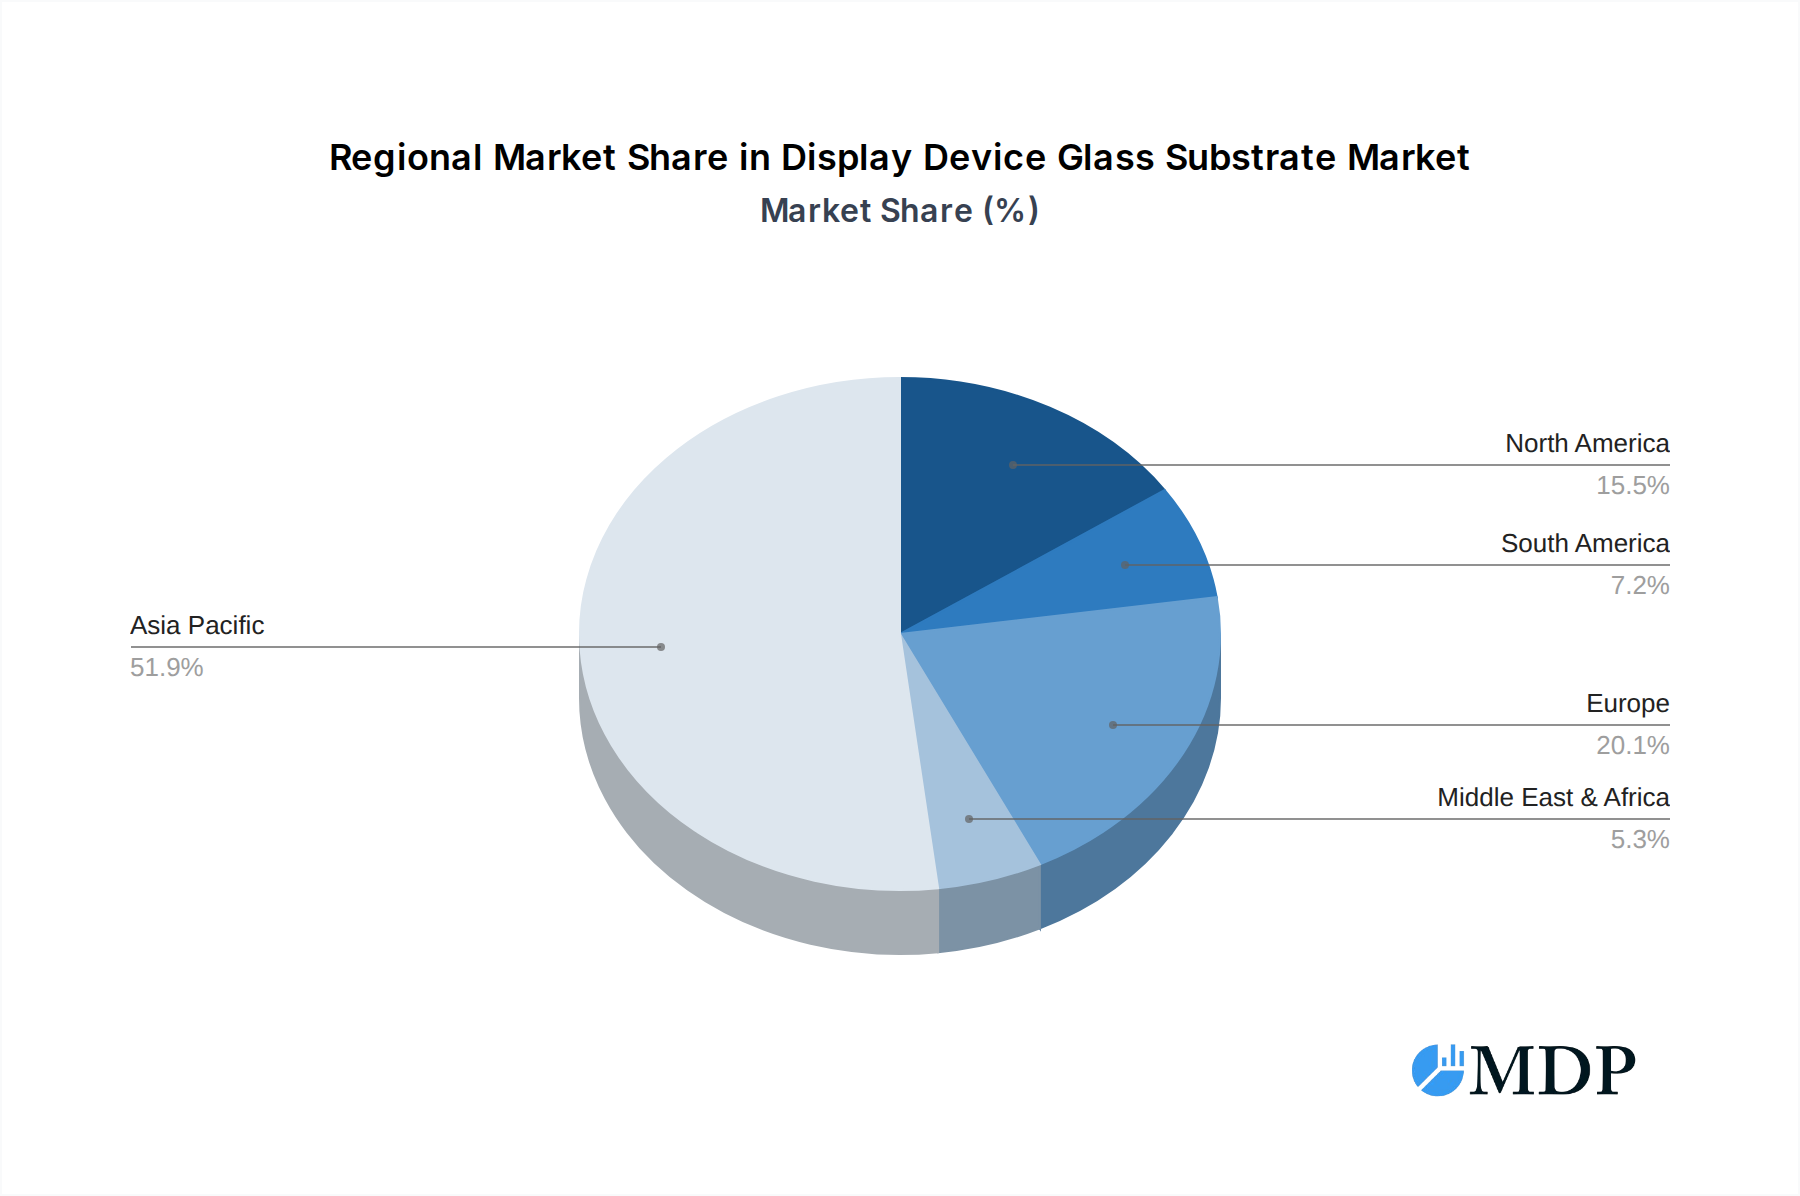
Display Device Glass Substrate Regional Market Share
Geographic Coverage of Display Device Glass Substrate
Display Device Glass Substrate REPORT HIGHLIGHTS
| Aspects | Details |
|---|---|
| Study Period | 2020-2034 |
| Base Year | 2025 |
| Estimated Year | 2026 |
| Forecast Period | 2026-2034 |
| Historical Period | 2020-2025 |
| Growth Rate | CAGR of 3.7% from 2020-2034 |
| Segmentation |
|
Table of Contents
- 1. Introduction
- 1.1. Research Scope
- 1.2. Market Segmentation
- 1.3. Research Methodology
- 1.4. Definitions and Assumptions
- 2. Executive Summary
- 2.1. Introduction
- 3. Market Dynamics
- 3.1. Introduction
- 3.2. Market Drivers
- 3.3. Market Restrains
- 3.4. Market Trends
- 4. Market Factor Analysis
- 4.1. Porters Five Forces
- 4.2. Supply/Value Chain
- 4.3. PESTEL analysis
- 4.4. Market Entropy
- 4.5. Patent/Trademark Analysis
- 5. Global Display Device Glass Substrate Analysis, Insights and Forecast, 2020-2032
- 5.1. Market Analysis, Insights and Forecast - by Application
- 5.1.1. Cell Phone
- 5.1.2. Computer
- 5.1.3. Television
- 5.1.4. Others
- 5.2. Market Analysis, Insights and Forecast - by Types
- 5.2.1. High Heat-resistant and Low Thermal Compaction Glass Substrate
- 5.2.2. Alkali-free Glass Substrate
- 5.3. Market Analysis, Insights and Forecast - by Region
- 5.3.1. North America
- 5.3.2. South America
- 5.3.3. Europe
- 5.3.4. Middle East & Africa
- 5.3.5. Asia Pacific
- 5.1. Market Analysis, Insights and Forecast - by Application
- 6. North America Display Device Glass Substrate Analysis, Insights and Forecast, 2020-2032
- 6.1. Market Analysis, Insights and Forecast - by Application
- 6.1.1. Cell Phone
- 6.1.2. Computer
- 6.1.3. Television
- 6.1.4. Others
- 6.2. Market Analysis, Insights and Forecast - by Types
- 6.2.1. High Heat-resistant and Low Thermal Compaction Glass Substrate
- 6.2.2. Alkali-free Glass Substrate
- 6.1. Market Analysis, Insights and Forecast - by Application
- 7. South America Display Device Glass Substrate Analysis, Insights and Forecast, 2020-2032
- 7.1. Market Analysis, Insights and Forecast - by Application
- 7.1.1. Cell Phone
- 7.1.2. Computer
- 7.1.3. Television
- 7.1.4. Others
- 7.2. Market Analysis, Insights and Forecast - by Types
- 7.2.1. High Heat-resistant and Low Thermal Compaction Glass Substrate
- 7.2.2. Alkali-free Glass Substrate
- 7.1. Market Analysis, Insights and Forecast - by Application
- 8. Europe Display Device Glass Substrate Analysis, Insights and Forecast, 2020-2032
- 8.1. Market Analysis, Insights and Forecast - by Application
- 8.1.1. Cell Phone
- 8.1.2. Computer
- 8.1.3. Television
- 8.1.4. Others
- 8.2. Market Analysis, Insights and Forecast - by Types
- 8.2.1. High Heat-resistant and Low Thermal Compaction Glass Substrate
- 8.2.2. Alkali-free Glass Substrate
- 8.1. Market Analysis, Insights and Forecast - by Application
- 9. Middle East & Africa Display Device Glass Substrate Analysis, Insights and Forecast, 2020-2032
- 9.1. Market Analysis, Insights and Forecast - by Application
- 9.1.1. Cell Phone
- 9.1.2. Computer
- 9.1.3. Television
- 9.1.4. Others
- 9.2. Market Analysis, Insights and Forecast - by Types
- 9.2.1. High Heat-resistant and Low Thermal Compaction Glass Substrate
- 9.2.2. Alkali-free Glass Substrate
- 9.1. Market Analysis, Insights and Forecast - by Application
- 10. Asia Pacific Display Device Glass Substrate Analysis, Insights and Forecast, 2020-2032
- 10.1. Market Analysis, Insights and Forecast - by Application
- 10.1.1. Cell Phone
- 10.1.2. Computer
- 10.1.3. Television
- 10.1.4. Others
- 10.2. Market Analysis, Insights and Forecast - by Types
- 10.2.1. High Heat-resistant and Low Thermal Compaction Glass Substrate
- 10.2.2. Alkali-free Glass Substrate
- 10.1. Market Analysis, Insights and Forecast - by Application
- 11. Competitive Analysis
- 11.1. Global Market Share Analysis 2025
- 11.2. Company Profiles
- 11.2.1 Nippon Electric Glass
- 11.2.1.1. Overview
- 11.2.1.2. Products
- 11.2.1.3. SWOT Analysis
- 11.2.1.4. Recent Developments
- 11.2.1.5. Financials (Based on Availability)
- 11.2.2 Corning
- 11.2.2.1. Overview
- 11.2.2.2. Products
- 11.2.2.3. SWOT Analysis
- 11.2.2.4. Recent Developments
- 11.2.2.5. Financials (Based on Availability)
- 11.2.3 AGC
- 11.2.3.1. Overview
- 11.2.3.2. Products
- 11.2.3.3. SWOT Analysis
- 11.2.3.4. Recent Developments
- 11.2.3.5. Financials (Based on Availability)
- 11.2.4 Tunghsu Optoelectronic
- 11.2.4.1. Overview
- 11.2.4.2. Products
- 11.2.4.3. SWOT Analysis
- 11.2.4.4. Recent Developments
- 11.2.4.5. Financials (Based on Availability)
- 11.2.5 AvanStrate
- 11.2.5.1. Overview
- 11.2.5.2. Products
- 11.2.5.3. SWOT Analysis
- 11.2.5.4. Recent Developments
- 11.2.5.5. Financials (Based on Availability)
- 11.2.6 IRICO Group
- 11.2.6.1. Overview
- 11.2.6.2. Products
- 11.2.6.3. SWOT Analysis
- 11.2.6.4. Recent Developments
- 11.2.6.5. Financials (Based on Availability)
- 11.2.7 CGC
- 11.2.7.1. Overview
- 11.2.7.2. Products
- 11.2.7.3. SWOT Analysis
- 11.2.7.4. Recent Developments
- 11.2.7.5. Financials (Based on Availability)
- 11.2.8 LG Chem
- 11.2.8.1. Overview
- 11.2.8.2. Products
- 11.2.8.3. SWOT Analysis
- 11.2.8.4. Recent Developments
- 11.2.8.5. Financials (Based on Availability)
- 11.2.1 Nippon Electric Glass
List of Figures
- Figure 1: Global Display Device Glass Substrate Revenue Breakdown (undefined, %) by Region 2025 & 2033
- Figure 2: Global Display Device Glass Substrate Volume Breakdown (K, %) by Region 2025 & 2033
- Figure 3: North America Display Device Glass Substrate Revenue (undefined), by Application 2025 & 2033
- Figure 4: North America Display Device Glass Substrate Volume (K), by Application 2025 & 2033
- Figure 5: North America Display Device Glass Substrate Revenue Share (%), by Application 2025 & 2033
- Figure 6: North America Display Device Glass Substrate Volume Share (%), by Application 2025 & 2033
- Figure 7: North America Display Device Glass Substrate Revenue (undefined), by Types 2025 & 2033
- Figure 8: North America Display Device Glass Substrate Volume (K), by Types 2025 & 2033
- Figure 9: North America Display Device Glass Substrate Revenue Share (%), by Types 2025 & 2033
- Figure 10: North America Display Device Glass Substrate Volume Share (%), by Types 2025 & 2033
- Figure 11: North America Display Device Glass Substrate Revenue (undefined), by Country 2025 & 2033
- Figure 12: North America Display Device Glass Substrate Volume (K), by Country 2025 & 2033
- Figure 13: North America Display Device Glass Substrate Revenue Share (%), by Country 2025 & 2033
- Figure 14: North America Display Device Glass Substrate Volume Share (%), by Country 2025 & 2033
- Figure 15: South America Display Device Glass Substrate Revenue (undefined), by Application 2025 & 2033
- Figure 16: South America Display Device Glass Substrate Volume (K), by Application 2025 & 2033
- Figure 17: South America Display Device Glass Substrate Revenue Share (%), by Application 2025 & 2033
- Figure 18: South America Display Device Glass Substrate Volume Share (%), by Application 2025 & 2033
- Figure 19: South America Display Device Glass Substrate Revenue (undefined), by Types 2025 & 2033
- Figure 20: South America Display Device Glass Substrate Volume (K), by Types 2025 & 2033
- Figure 21: South America Display Device Glass Substrate Revenue Share (%), by Types 2025 & 2033
- Figure 22: South America Display Device Glass Substrate Volume Share (%), by Types 2025 & 2033
- Figure 23: South America Display Device Glass Substrate Revenue (undefined), by Country 2025 & 2033
- Figure 24: South America Display Device Glass Substrate Volume (K), by Country 2025 & 2033
- Figure 25: South America Display Device Glass Substrate Revenue Share (%), by Country 2025 & 2033
- Figure 26: South America Display Device Glass Substrate Volume Share (%), by Country 2025 & 2033
- Figure 27: Europe Display Device Glass Substrate Revenue (undefined), by Application 2025 & 2033
- Figure 28: Europe Display Device Glass Substrate Volume (K), by Application 2025 & 2033
- Figure 29: Europe Display Device Glass Substrate Revenue Share (%), by Application 2025 & 2033
- Figure 30: Europe Display Device Glass Substrate Volume Share (%), by Application 2025 & 2033
- Figure 31: Europe Display Device Glass Substrate Revenue (undefined), by Types 2025 & 2033
- Figure 32: Europe Display Device Glass Substrate Volume (K), by Types 2025 & 2033
- Figure 33: Europe Display Device Glass Substrate Revenue Share (%), by Types 2025 & 2033
- Figure 34: Europe Display Device Glass Substrate Volume Share (%), by Types 2025 & 2033
- Figure 35: Europe Display Device Glass Substrate Revenue (undefined), by Country 2025 & 2033
- Figure 36: Europe Display Device Glass Substrate Volume (K), by Country 2025 & 2033
- Figure 37: Europe Display Device Glass Substrate Revenue Share (%), by Country 2025 & 2033
- Figure 38: Europe Display Device Glass Substrate Volume Share (%), by Country 2025 & 2033
- Figure 39: Middle East & Africa Display Device Glass Substrate Revenue (undefined), by Application 2025 & 2033
- Figure 40: Middle East & Africa Display Device Glass Substrate Volume (K), by Application 2025 & 2033
- Figure 41: Middle East & Africa Display Device Glass Substrate Revenue Share (%), by Application 2025 & 2033
- Figure 42: Middle East & Africa Display Device Glass Substrate Volume Share (%), by Application 2025 & 2033
- Figure 43: Middle East & Africa Display Device Glass Substrate Revenue (undefined), by Types 2025 & 2033
- Figure 44: Middle East & Africa Display Device Glass Substrate Volume (K), by Types 2025 & 2033
- Figure 45: Middle East & Africa Display Device Glass Substrate Revenue Share (%), by Types 2025 & 2033
- Figure 46: Middle East & Africa Display Device Glass Substrate Volume Share (%), by Types 2025 & 2033
- Figure 47: Middle East & Africa Display Device Glass Substrate Revenue (undefined), by Country 2025 & 2033
- Figure 48: Middle East & Africa Display Device Glass Substrate Volume (K), by Country 2025 & 2033
- Figure 49: Middle East & Africa Display Device Glass Substrate Revenue Share (%), by Country 2025 & 2033
- Figure 50: Middle East & Africa Display Device Glass Substrate Volume Share (%), by Country 2025 & 2033
- Figure 51: Asia Pacific Display Device Glass Substrate Revenue (undefined), by Application 2025 & 2033
- Figure 52: Asia Pacific Display Device Glass Substrate Volume (K), by Application 2025 & 2033
- Figure 53: Asia Pacific Display Device Glass Substrate Revenue Share (%), by Application 2025 & 2033
- Figure 54: Asia Pacific Display Device Glass Substrate Volume Share (%), by Application 2025 & 2033
- Figure 55: Asia Pacific Display Device Glass Substrate Revenue (undefined), by Types 2025 & 2033
- Figure 56: Asia Pacific Display Device Glass Substrate Volume (K), by Types 2025 & 2033
- Figure 57: Asia Pacific Display Device Glass Substrate Revenue Share (%), by Types 2025 & 2033
- Figure 58: Asia Pacific Display Device Glass Substrate Volume Share (%), by Types 2025 & 2033
- Figure 59: Asia Pacific Display Device Glass Substrate Revenue (undefined), by Country 2025 & 2033
- Figure 60: Asia Pacific Display Device Glass Substrate Volume (K), by Country 2025 & 2033
- Figure 61: Asia Pacific Display Device Glass Substrate Revenue Share (%), by Country 2025 & 2033
- Figure 62: Asia Pacific Display Device Glass Substrate Volume Share (%), by Country 2025 & 2033
List of Tables
- Table 1: Global Display Device Glass Substrate Revenue undefined Forecast, by Application 2020 & 2033
- Table 2: Global Display Device Glass Substrate Volume K Forecast, by Application 2020 & 2033
- Table 3: Global Display Device Glass Substrate Revenue undefined Forecast, by Types 2020 & 2033
- Table 4: Global Display Device Glass Substrate Volume K Forecast, by Types 2020 & 2033
- Table 5: Global Display Device Glass Substrate Revenue undefined Forecast, by Region 2020 & 2033
- Table 6: Global Display Device Glass Substrate Volume K Forecast, by Region 2020 & 2033
- Table 7: Global Display Device Glass Substrate Revenue undefined Forecast, by Application 2020 & 2033
- Table 8: Global Display Device Glass Substrate Volume K Forecast, by Application 2020 & 2033
- Table 9: Global Display Device Glass Substrate Revenue undefined Forecast, by Types 2020 & 2033
- Table 10: Global Display Device Glass Substrate Volume K Forecast, by Types 2020 & 2033
- Table 11: Global Display Device Glass Substrate Revenue undefined Forecast, by Country 2020 & 2033
- Table 12: Global Display Device Glass Substrate Volume K Forecast, by Country 2020 & 2033
- Table 13: United States Display Device Glass Substrate Revenue (undefined) Forecast, by Application 2020 & 2033
- Table 14: United States Display Device Glass Substrate Volume (K) Forecast, by Application 2020 & 2033
- Table 15: Canada Display Device Glass Substrate Revenue (undefined) Forecast, by Application 2020 & 2033
- Table 16: Canada Display Device Glass Substrate Volume (K) Forecast, by Application 2020 & 2033
- Table 17: Mexico Display Device Glass Substrate Revenue (undefined) Forecast, by Application 2020 & 2033
- Table 18: Mexico Display Device Glass Substrate Volume (K) Forecast, by Application 2020 & 2033
- Table 19: Global Display Device Glass Substrate Revenue undefined Forecast, by Application 2020 & 2033
- Table 20: Global Display Device Glass Substrate Volume K Forecast, by Application 2020 & 2033
- Table 21: Global Display Device Glass Substrate Revenue undefined Forecast, by Types 2020 & 2033
- Table 22: Global Display Device Glass Substrate Volume K Forecast, by Types 2020 & 2033
- Table 23: Global Display Device Glass Substrate Revenue undefined Forecast, by Country 2020 & 2033
- Table 24: Global Display Device Glass Substrate Volume K Forecast, by Country 2020 & 2033
- Table 25: Brazil Display Device Glass Substrate Revenue (undefined) Forecast, by Application 2020 & 2033
- Table 26: Brazil Display Device Glass Substrate Volume (K) Forecast, by Application 2020 & 2033
- Table 27: Argentina Display Device Glass Substrate Revenue (undefined) Forecast, by Application 2020 & 2033
- Table 28: Argentina Display Device Glass Substrate Volume (K) Forecast, by Application 2020 & 2033
- Table 29: Rest of South America Display Device Glass Substrate Revenue (undefined) Forecast, by Application 2020 & 2033
- Table 30: Rest of South America Display Device Glass Substrate Volume (K) Forecast, by Application 2020 & 2033
- Table 31: Global Display Device Glass Substrate Revenue undefined Forecast, by Application 2020 & 2033
- Table 32: Global Display Device Glass Substrate Volume K Forecast, by Application 2020 & 2033
- Table 33: Global Display Device Glass Substrate Revenue undefined Forecast, by Types 2020 & 2033
- Table 34: Global Display Device Glass Substrate Volume K Forecast, by Types 2020 & 2033
- Table 35: Global Display Device Glass Substrate Revenue undefined Forecast, by Country 2020 & 2033
- Table 36: Global Display Device Glass Substrate Volume K Forecast, by Country 2020 & 2033
- Table 37: United Kingdom Display Device Glass Substrate Revenue (undefined) Forecast, by Application 2020 & 2033
- Table 38: United Kingdom Display Device Glass Substrate Volume (K) Forecast, by Application 2020 & 2033
- Table 39: Germany Display Device Glass Substrate Revenue (undefined) Forecast, by Application 2020 & 2033
- Table 40: Germany Display Device Glass Substrate Volume (K) Forecast, by Application 2020 & 2033
- Table 41: France Display Device Glass Substrate Revenue (undefined) Forecast, by Application 2020 & 2033
- Table 42: France Display Device Glass Substrate Volume (K) Forecast, by Application 2020 & 2033
- Table 43: Italy Display Device Glass Substrate Revenue (undefined) Forecast, by Application 2020 & 2033
- Table 44: Italy Display Device Glass Substrate Volume (K) Forecast, by Application 2020 & 2033
- Table 45: Spain Display Device Glass Substrate Revenue (undefined) Forecast, by Application 2020 & 2033
- Table 46: Spain Display Device Glass Substrate Volume (K) Forecast, by Application 2020 & 2033
- Table 47: Russia Display Device Glass Substrate Revenue (undefined) Forecast, by Application 2020 & 2033
- Table 48: Russia Display Device Glass Substrate Volume (K) Forecast, by Application 2020 & 2033
- Table 49: Benelux Display Device Glass Substrate Revenue (undefined) Forecast, by Application 2020 & 2033
- Table 50: Benelux Display Device Glass Substrate Volume (K) Forecast, by Application 2020 & 2033
- Table 51: Nordics Display Device Glass Substrate Revenue (undefined) Forecast, by Application 2020 & 2033
- Table 52: Nordics Display Device Glass Substrate Volume (K) Forecast, by Application 2020 & 2033
- Table 53: Rest of Europe Display Device Glass Substrate Revenue (undefined) Forecast, by Application 2020 & 2033
- Table 54: Rest of Europe Display Device Glass Substrate Volume (K) Forecast, by Application 2020 & 2033
- Table 55: Global Display Device Glass Substrate Revenue undefined Forecast, by Application 2020 & 2033
- Table 56: Global Display Device Glass Substrate Volume K Forecast, by Application 2020 & 2033
- Table 57: Global Display Device Glass Substrate Revenue undefined Forecast, by Types 2020 & 2033
- Table 58: Global Display Device Glass Substrate Volume K Forecast, by Types 2020 & 2033
- Table 59: Global Display Device Glass Substrate Revenue undefined Forecast, by Country 2020 & 2033
- Table 60: Global Display Device Glass Substrate Volume K Forecast, by Country 2020 & 2033
- Table 61: Turkey Display Device Glass Substrate Revenue (undefined) Forecast, by Application 2020 & 2033
- Table 62: Turkey Display Device Glass Substrate Volume (K) Forecast, by Application 2020 & 2033
- Table 63: Israel Display Device Glass Substrate Revenue (undefined) Forecast, by Application 2020 & 2033
- Table 64: Israel Display Device Glass Substrate Volume (K) Forecast, by Application 2020 & 2033
- Table 65: GCC Display Device Glass Substrate Revenue (undefined) Forecast, by Application 2020 & 2033
- Table 66: GCC Display Device Glass Substrate Volume (K) Forecast, by Application 2020 & 2033
- Table 67: North Africa Display Device Glass Substrate Revenue (undefined) Forecast, by Application 2020 & 2033
- Table 68: North Africa Display Device Glass Substrate Volume (K) Forecast, by Application 2020 & 2033
- Table 69: South Africa Display Device Glass Substrate Revenue (undefined) Forecast, by Application 2020 & 2033
- Table 70: South Africa Display Device Glass Substrate Volume (K) Forecast, by Application 2020 & 2033
- Table 71: Rest of Middle East & Africa Display Device Glass Substrate Revenue (undefined) Forecast, by Application 2020 & 2033
- Table 72: Rest of Middle East & Africa Display Device Glass Substrate Volume (K) Forecast, by Application 2020 & 2033
- Table 73: Global Display Device Glass Substrate Revenue undefined Forecast, by Application 2020 & 2033
- Table 74: Global Display Device Glass Substrate Volume K Forecast, by Application 2020 & 2033
- Table 75: Global Display Device Glass Substrate Revenue undefined Forecast, by Types 2020 & 2033
- Table 76: Global Display Device Glass Substrate Volume K Forecast, by Types 2020 & 2033
- Table 77: Global Display Device Glass Substrate Revenue undefined Forecast, by Country 2020 & 2033
- Table 78: Global Display Device Glass Substrate Volume K Forecast, by Country 2020 & 2033
- Table 79: China Display Device Glass Substrate Revenue (undefined) Forecast, by Application 2020 & 2033
- Table 80: China Display Device Glass Substrate Volume (K) Forecast, by Application 2020 & 2033
- Table 81: India Display Device Glass Substrate Revenue (undefined) Forecast, by Application 2020 & 2033
- Table 82: India Display Device Glass Substrate Volume (K) Forecast, by Application 2020 & 2033
- Table 83: Japan Display Device Glass Substrate Revenue (undefined) Forecast, by Application 2020 & 2033
- Table 84: Japan Display Device Glass Substrate Volume (K) Forecast, by Application 2020 & 2033
- Table 85: South Korea Display Device Glass Substrate Revenue (undefined) Forecast, by Application 2020 & 2033
- Table 86: South Korea Display Device Glass Substrate Volume (K) Forecast, by Application 2020 & 2033
- Table 87: ASEAN Display Device Glass Substrate Revenue (undefined) Forecast, by Application 2020 & 2033
- Table 88: ASEAN Display Device Glass Substrate Volume (K) Forecast, by Application 2020 & 2033
- Table 89: Oceania Display Device Glass Substrate Revenue (undefined) Forecast, by Application 2020 & 2033
- Table 90: Oceania Display Device Glass Substrate Volume (K) Forecast, by Application 2020 & 2033
- Table 91: Rest of Asia Pacific Display Device Glass Substrate Revenue (undefined) Forecast, by Application 2020 & 2033
- Table 92: Rest of Asia Pacific Display Device Glass Substrate Volume (K) Forecast, by Application 2020 & 2033
Frequently Asked Questions
1. What is the projected Compound Annual Growth Rate (CAGR) of the Display Device Glass Substrate?
The projected CAGR is approximately 3.7%.
2. Which companies are prominent players in the Display Device Glass Substrate?
Key companies in the market include Nippon Electric Glass, Corning, AGC, Tunghsu Optoelectronic, AvanStrate, IRICO Group, CGC, LG Chem.
3. What are the main segments of the Display Device Glass Substrate?
The market segments include Application, Types.
4. Can you provide details about the market size?
The market size is estimated to be USD XXX N/A as of 2022.
5. What are some drivers contributing to market growth?
N/A
6. What are the notable trends driving market growth?
N/A
7. Are there any restraints impacting market growth?
N/A
8. Can you provide examples of recent developments in the market?
N/A
9. What pricing options are available for accessing the report?
Pricing options include single-user, multi-user, and enterprise licenses priced at USD 3350.00, USD 5025.00, and USD 6700.00 respectively.
10. Is the market size provided in terms of value or volume?
The market size is provided in terms of value, measured in N/A and volume, measured in K.
11. Are there any specific market keywords associated with the report?
Yes, the market keyword associated with the report is "Display Device Glass Substrate," which aids in identifying and referencing the specific market segment covered.
12. How do I determine which pricing option suits my needs best?
The pricing options vary based on user requirements and access needs. Individual users may opt for single-user licenses, while businesses requiring broader access may choose multi-user or enterprise licenses for cost-effective access to the report.
13. Are there any additional resources or data provided in the Display Device Glass Substrate report?
While the report offers comprehensive insights, it's advisable to review the specific contents or supplementary materials provided to ascertain if additional resources or data are available.
14. How can I stay updated on further developments or reports in the Display Device Glass Substrate?
To stay informed about further developments, trends, and reports in the Display Device Glass Substrate, consider subscribing to industry newsletters, following relevant companies and organizations, or regularly checking reputable industry news sources and publications.
Methodology
Step 1 - Identification of Relevant Samples Size from Population Database


Step 2 - Approaches for Defining Global Market Size (Value, Volume* & Price*)

Note*: In applicable scenarios
Step 3 - Data Sources
Primary Research
- Web Analytics
- Survey Reports
- Research Institute
- Latest Research Reports
- Opinion Leaders
Secondary Research
- Annual Reports
- White Paper
- Latest Press Release
- Industry Association
- Paid Database
- Investor Presentations

Step 4 - Data Triangulation
Involves using different sources of information in order to increase the validity of a study
These sources are likely to be stakeholders in a program - participants, other researchers, program staff, other community members, and so on.
Then we put all data in single framework & apply various statistical tools to find out the dynamic on the market.
During the analysis stage, feedback from the stakeholder groups would be compared to determine areas of agreement as well as areas of divergence