

Key Insights
The Digital Power Utility market is poised for significant expansion, projected to reach an impressive USD 227.85 billion by 2025, and demonstrating a robust compound annual growth rate (CAGR) of 11.13% throughout the forecast period of 2025-2033. This substantial growth is propelled by an increasing demand for enhanced grid efficiency, reliability, and the integration of renewable energy sources. Key drivers include the growing need for advanced grid management solutions to handle the complexities of distributed energy resources, the imperative to reduce operational costs through automation, and the continuous advancement of digital technologies like AI, IoT, and cloud computing. The sector is witnessing a strong trend towards smart grid deployments, predictive maintenance, and enhanced cybersecurity measures to protect critical infrastructure. Furthermore, the growing emphasis on decarbonization and the transition to a sustainable energy future are further accelerating the adoption of digital solutions within the power utility landscape.
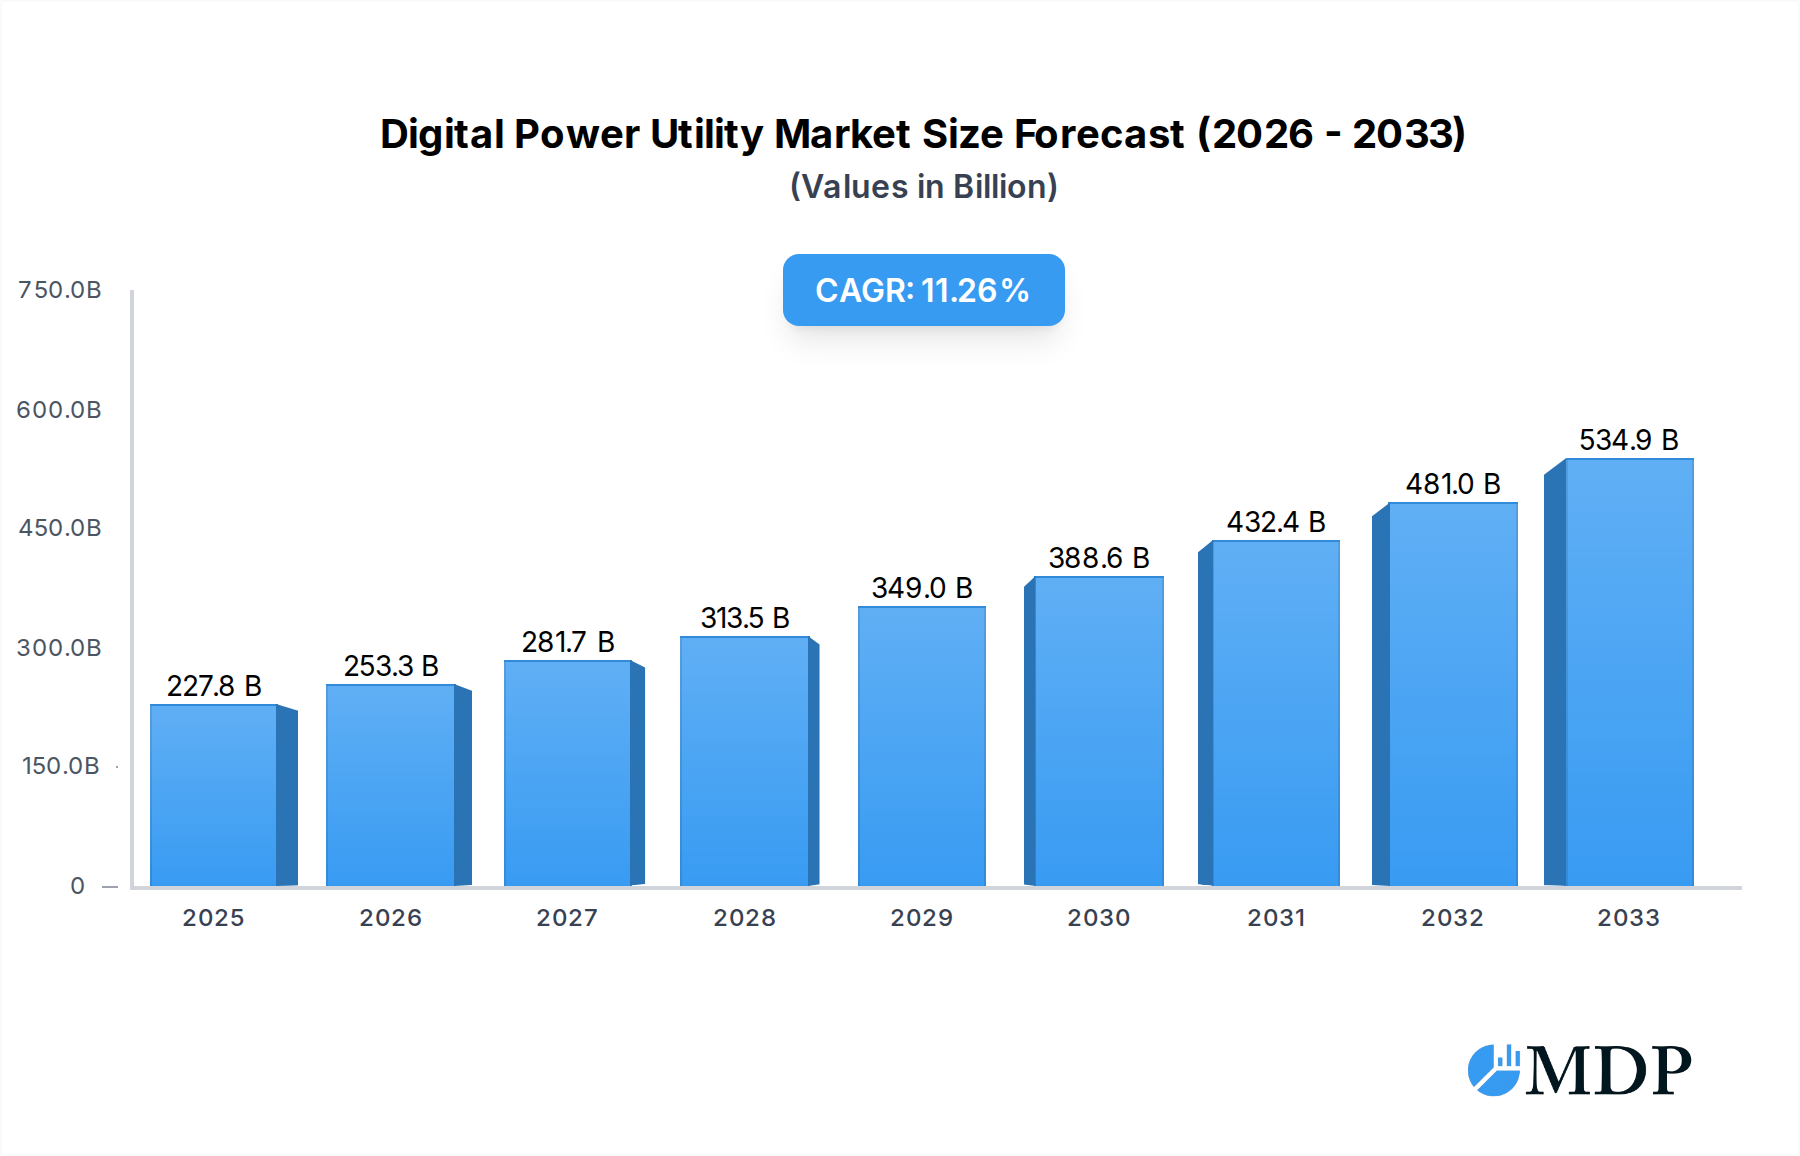
Digital Power Utility Market Size (In Billion)
The market segmentation reveals a dynamic landscape, with Power Generation, Transmission and Distribution, and Energy Storage representing critical application areas, each contributing to the overall market value. The shift towards digital transformation is evident in both Hardware Services and Software Services, with software solutions increasingly playing a pivotal role in enabling sophisticated analytics, real-time monitoring, and operational optimization. Major industry players like General Electric, Siemens, ABB, and technology giants such as IBM, Microsoft, and Accenture are actively investing in and developing innovative digital solutions, further intensifying competition and driving market evolution. Geographically, North America and Europe are leading the adoption of digital power utility technologies due to well-established infrastructure and proactive regulatory frameworks. However, the Asia Pacific region, particularly China and India, presents substantial growth opportunities driven by rapid infrastructure development and increasing energy demands. The Middle East & Africa and South America are also expected to witness considerable growth as they focus on modernizing their power grids.

Digital Power Utility Company Market Share
Digital Power Utility Market Dynamics & Concentration Report Description
This comprehensive report, "Digital Power Utility Market Dynamics & Concentration," offers an in-depth analysis of the global digital power utility landscape from 2019 to 2033, with a base year of 2025. The study delves into the intricate market concentration, dissecting innovation drivers that are propelling advancements in areas like smart grids and IoT integration. It examines the evolving regulatory frameworks shaping the industry's trajectory and evaluates the impact of product substitutes on market share. End-user trends, particularly the growing demand for renewable energy integration and grid modernization, are thoroughly investigated. Mergers and acquisitions (M&A) activities are a significant focal point, with the report detailing recent deal counts and their influence on market consolidation. Leading companies such as General Electric, Siemens, ABB, Accenture, Capgemini, Sap, IBM, Microsoft Corporation, Oracle Corporation, Wipro, Infosys, and others are analyzed for their market share and strategic positioning. The report estimates the digital power utility market value at approximately one billion dollars in 2025, with a projected market share for leading players ranging from xx% to xx%. M&A deal counts are estimated to be around xx deals in the historical period, with an anticipated increase to xx deals during the forecast period. This analysis provides actionable insights for industry stakeholders seeking to navigate the complexities of this rapidly evolving sector.
Digital Power Utility Market Dynamics & Concentration
The global Digital Power Utility market exhibits a moderate to high concentration, with a few dominant players capturing a significant portion of the market share, estimated to be over one billion dollars in value. Key innovation drivers fueling this growth include the widespread adoption of the Internet of Things (IoT) for remote monitoring and control, the increasing integration of renewable energy sources requiring sophisticated grid management solutions, and the advancement of Artificial Intelligence (AI) and Machine Learning (ML) for predictive maintenance and grid optimization. Regulatory frameworks worldwide are increasingly mandating the adoption of digital technologies to enhance grid reliability, improve efficiency, and support decarbonization efforts. For instance, government initiatives promoting smart grid deployment and cybersecurity standards are directly impacting market development.
Product substitutes, while emerging, are largely complementary rather than directly replacing core digital utility solutions. These might include advanced energy management software for industrial consumers or localized microgrid solutions. However, the fundamental need for centralized and intelligent grid management ensures the sustained demand for comprehensive digital power utility platforms. End-user trends are characterized by a growing appetite for real-time data access, enhanced operational efficiency, and a proactive approach to grid management. Utilities are increasingly seeking solutions that offer improved asset performance management, reduced operational costs, and enhanced customer engagement through digital channels.
Mergers and acquisitions (M&A) activities have been a significant factor in shaping the market concentration. Strategic acquisitions of specialized technology providers by larger utility solution vendors are common, aimed at expanding product portfolios and geographical reach. The historical period (2019-2024) saw an estimated xx M&A deals, with the forecast period (2025-2033) expected to witness a further xx deals, indicating continued consolidation and strategic collaborations. Companies like General Electric, Siemens, ABB, and IBM have been active participants in this M&A landscape, acquiring smaller firms to bolster their digital offerings. The estimated market share of the top 5 players is around xx%, underscoring the competitive yet consolidated nature of the industry.
Digital Power Utility Industry Trends & Analysis
The Digital Power Utility industry is poised for substantial growth, driven by a confluence of technological advancements, evolving consumer preferences, and the imperative for a more sustainable and resilient energy infrastructure. The global market is projected to reach one billion dollars in value by the base year of 2025, with a compound annual growth rate (CAGR) of approximately xx% during the forecast period of 2025–2033. This robust growth trajectory is underpinned by several key trends.
Technological disruptions are at the forefront of this transformation. The proliferation of smart meters and sensors is generating vast amounts of data, enabling real-time monitoring, predictive maintenance, and dynamic load balancing. The integration of AI and ML algorithms is revolutionizing grid operations, allowing for optimized energy distribution, enhanced fault detection, and improved forecasting of energy demand and renewable energy generation. The deployment of blockchain technology is also gaining traction for secure energy trading and verifiable carbon footprint tracking. Furthermore, the advancement of edge computing is enabling faster data processing closer to the source, reducing latency and improving the responsiveness of grid management systems.
Consumer preferences are shifting towards greater transparency, control, and sustainability in their energy consumption. Prosumers, individuals who both consume and produce energy (e.g., through rooftop solar panels), are becoming a significant demographic, necessitating utility solutions that can seamlessly integrate distributed energy resources (DERs) into the grid. Demand for reliable and uninterrupted power supply, coupled with a growing awareness of climate change, is accelerating the adoption of digital solutions that can enhance grid resilience and facilitate the integration of renewable energy sources. Utilities are also facing pressure to improve customer engagement through digital platforms, offering personalized insights into energy usage and providing self-service options.
Competitive dynamics within the Digital Power Utility market are characterized by intense innovation and strategic partnerships. Major technology providers like Siemens, GE, and ABB are investing heavily in R&D to develop comprehensive digital solutions, while IT giants such as Microsoft, IBM, and Oracle are leveraging their cloud and AI expertise to offer integrated platforms. Consultancies like Accenture and Capgemini are playing a crucial role in helping utilities implement these digital transformations. Software service providers are increasingly offering Software-as-a-Service (SaaS) models, reducing upfront investment for utilities. The market penetration of advanced digital solutions is expected to increase significantly, moving from an estimated xx% in 2025 to xx% by 2033. The competition also extends to specialized firms focusing on niche areas like cybersecurity for critical infrastructure or advanced analytics for grid optimization. The interplay between hardware and software service providers is crucial, with seamless integration being a key differentiator. The ongoing digitalization efforts are not merely about adopting new technologies but about fundamentally reshaping how power is generated, transmitted, distributed, and consumed, leading to a more efficient, sustainable, and resilient energy future.
Leading Markets & Segments in Digital Power Utility
North America currently holds the dominant position in the global Digital Power Utility market, driven by robust economic policies, significant investments in smart grid infrastructure, and a strong emphasis on grid modernization and cybersecurity. The United States, in particular, leads the region with extensive deployments of advanced metering infrastructure (AMI), smart substations, and distributed energy resource management systems (DERMS). Favorable government initiatives, such as the Infrastructure Investment and Jobs Act, continue to pour billions of dollars into upgrading the nation's energy grid, further solidifying its market leadership. Economic policies promoting renewable energy integration and grid flexibility are also key accelerators.
Within North America, the Transmission and Distribution segment is experiencing the most significant growth. This is attributed to the critical need for utilities to enhance grid reliability, reduce transmission losses, and manage the influx of intermittent renewable energy sources. Investments in digital substations, advanced grid monitoring systems, and automated control technologies are paramount in this segment. The development of smart grids, which enable real-time data exchange and intelligent decision-making across the entire power network, is a primary driver. The economic impact of upgrading aging infrastructure and the pressure to integrate millions of solar panels and wind turbines are pushing utilities to adopt sophisticated digital solutions for efficient management.
The Software Service segment is another key area of dominance, reflecting the increasing demand for cloud-based platforms, AI-powered analytics, and cybersecurity solutions. Companies are moving away from proprietary on-premise systems towards flexible, scalable SaaS offerings that provide advanced functionalities for grid optimization, asset management, and customer engagement. The growing complexity of energy systems, including the management of distributed energy resources and electric vehicle charging infrastructure, necessitates sophisticated software solutions. The cybersecurity aspect of this segment is also critical, as utilities grapple with an increasing threat landscape targeting critical infrastructure. The need for predictive maintenance enabled by AI/ML algorithms further fuels the demand for advanced software services, aiming to minimize downtime and optimize operational efficiency, contributing to the overall market value projected to be in the billions.
Key Drivers for North America's Dominance:
- Economic Policies: Government incentives for smart grid deployment, renewable energy integration, and grid modernization programs exceeding billions of dollars.
- Infrastructure Investment: Significant capital allocated by utilities and governments for upgrading existing grid infrastructure and building new digital capabilities, with projected investments in the billions.
- Technological Adoption: High adoption rates of smart meters, IoT devices, and advanced analytics platforms.
- Regulatory Frameworks: Mandates for grid reliability, cybersecurity, and environmental compliance driving digital transformation.
Dominance Analysis of Transmission and Distribution:
- The increasing complexity of managing bidirectional power flow from distributed energy resources (DERs) requires advanced digital solutions for real-time monitoring and control.
- The imperative to reduce line losses and improve overall grid efficiency drives investments in digital substations and automated grid management systems.
- The aging grid infrastructure necessitates extensive upgrades, with digital technologies offering a cost-effective and efficient approach to modernization.
Dominance Analysis of Software Service:
- The shift towards cloud-based solutions and SaaS models offers scalability and flexibility for utilities.
- AI and ML are crucial for predictive maintenance, demand forecasting, and anomaly detection, directly impacting operational efficiency and cost savings, with potential savings in the billions.
- Enhanced cybersecurity solutions are critical to protect the increasingly interconnected digital infrastructure from cyber threats.
Digital Power Utility Product Developments
Recent product developments in the Digital Power Utility sector are heavily focused on enhancing grid intelligence, operational efficiency, and sustainability. Innovations in AI-powered predictive maintenance algorithms are reducing costly unplanned outages by forecasting equipment failures with high accuracy. Advanced grid analytics platforms are enabling utilities to better manage the integration of renewable energy sources and distributed energy resources (DERs), optimizing power flow and improving grid stability. Furthermore, the development of robust cybersecurity solutions tailored for critical infrastructure is a key area, protecting vital operational technology (OT) systems from sophisticated cyber threats. The application of digital twins for simulating grid operations and testing new strategies before deployment is also gaining traction, offering significant competitive advantages by minimizing risks and optimizing performance, contributing to a market value in the billions.
Key Drivers of Digital Power Utility Growth
Several key factors are propelling the growth of the Digital Power Utility market, with the overall market size estimated to be in the billions. Technological advancements, particularly in Artificial Intelligence (AI), the Internet of Things (IoT), and cloud computing, are foundational. These technologies enable enhanced grid automation, real-time monitoring, and data-driven decision-making, leading to greater efficiency and reliability. Economic factors such as the increasing demand for clean energy and the need for grid modernization to accommodate renewable energy sources are significant drivers. Regulatory frameworks worldwide are increasingly mandating the adoption of digital solutions to improve grid resilience, cybersecurity, and carbon footprint reduction. For instance, government initiatives promoting smart grid deployment are injecting billions into the sector. The growing pressure on utilities to reduce operational costs and improve customer service further fuels the adoption of digital solutions.
Challenges in the Digital Power Utility Market
Despite substantial growth, the Digital Power Utility market faces several challenges that could impede its progress, impacting a market valued in the billions. A primary concern is the significant upfront investment required for implementing new digital technologies, which can be a substantial barrier for some utilities. Cybersecurity threats pose a continuous risk, as interconnected digital systems become more vulnerable to sophisticated cyberattacks, potentially leading to massive disruptions. Regulatory hurdles, while often drivers of change, can also create complexities due to varying standards and compliance requirements across different jurisdictions. Furthermore, the integration of legacy systems with new digital platforms can be technically challenging and costly. Lastly, a shortage of skilled personnel with expertise in both utility operations and advanced digital technologies presents a significant challenge in deploying and managing these complex systems effectively.
Emerging Opportunities in Digital Power Utility
Emerging opportunities in the Digital Power Utility market, estimated to reach billions in value, are numerous and transformative. The accelerating integration of renewable energy sources, such as solar and wind power, presents a significant catalyst for growth, demanding sophisticated digital solutions for grid balancing and forecasting. The expansion of electric vehicle (EV) charging infrastructure creates new avenues for smart charging management and grid load optimization. advancements in AI and machine learning are unlocking new possibilities for predictive analytics, anomaly detection, and autonomous grid operations, promising unprecedented levels of efficiency. Strategic partnerships between traditional utilities and technology providers are crucial for co-developing innovative solutions and expanding market reach. Furthermore, the growing demand for energy efficiency and demand-side management solutions offers substantial opportunities for utilities to engage customers digitally and promote sustainable energy consumption.
Leading Players in the Digital Power Utility Sector
- General Electric
- Siemens
- ABB
- Accenture
- Capgemini
- Sap
- IBM
- Microsoft Corporation
- Oracle Corporation
- Wipro
- Infosys
Key Milestones in Digital Power Utility Industry
- 2019: Increased adoption of AI for grid anomaly detection and predictive maintenance.
- 2020: Significant investments in cybersecurity solutions for critical energy infrastructure.
- 2021: Major utility companies begin piloting blockchain for energy trading.
- 2022: Expansion of smart meter deployments globally, generating vast amounts of data.
- 2023: Increased focus on integrating distributed energy resources (DERs) through digital platforms.
- 2024: Growing trend of cloud-based SaaS solutions for grid management and analytics.
- 2025 (Estimated): Widespread implementation of digital twins for grid simulation and optimization.
- 2026 (Estimated): Enhanced AI capabilities for autonomous grid operations are anticipated.
- 2027 (Estimated): Integration of advanced IoT sensors for granular real-time grid monitoring.
- 2028 (Estimated): Significant growth in demand for smart EV charging management solutions.
- 2029 (Estimated): Further consolidation through strategic M&A activities.
- 2030 (Estimated): Increased regulatory push for decarbonization through digital solutions.
- 2031 (Estimated): Advanced analytics platforms enabling hyper-personalized energy services for consumers.
- 2032 (Estimated): Maturation of edge computing for faster grid response times.
- 2033 (Estimated): Fully integrated, resilient, and sustainable digital power grids become the norm.
Strategic Outlook for Digital Power Utility Market
The strategic outlook for the Digital Power Utility market, projected to reach billions in value, is characterized by sustained innovation and expansion. Growth accelerators include the ongoing digital transformation of aging infrastructure, driven by the necessity for enhanced reliability and efficiency. The increasing integration of renewable energy sources and electric vehicles will continue to demand sophisticated grid management and smart charging solutions. Advancements in AI and machine learning will unlock new levels of predictive capabilities and autonomous operations, further optimizing grid performance. Strategic partnerships between technology providers and utility companies will be crucial for co-creating tailored solutions and expanding market penetration. The emphasis on cybersecurity will remain paramount, driving demand for robust protective measures. Overall, the market is set for continuous evolution, focusing on building a more resilient, sustainable, and intelligent energy future.
Digital Power Utility Segmentation
-
1. Application
- 1.1. Power Generation
- 1.2. Transmission and Distribution
- 1.3. Energy Storage
- 1.4. Other
-
2. Types
- 2.1. Hardware Service
- 2.2. software Service
Digital Power Utility Segmentation By Geography
-
1. North America
- 1.1. United States
- 1.2. Canada
- 1.3. Mexico
-
2. South America
- 2.1. Brazil
- 2.2. Argentina
- 2.3. Rest of South America
-
3. Europe
- 3.1. United Kingdom
- 3.2. Germany
- 3.3. France
- 3.4. Italy
- 3.5. Spain
- 3.6. Russia
- 3.7. Benelux
- 3.8. Nordics
- 3.9. Rest of Europe
-
4. Middle East & Africa
- 4.1. Turkey
- 4.2. Israel
- 4.3. GCC
- 4.4. North Africa
- 4.5. South Africa
- 4.6. Rest of Middle East & Africa
-
5. Asia Pacific
- 5.1. China
- 5.2. India
- 5.3. Japan
- 5.4. South Korea
- 5.5. ASEAN
- 5.6. Oceania
- 5.7. Rest of Asia Pacific
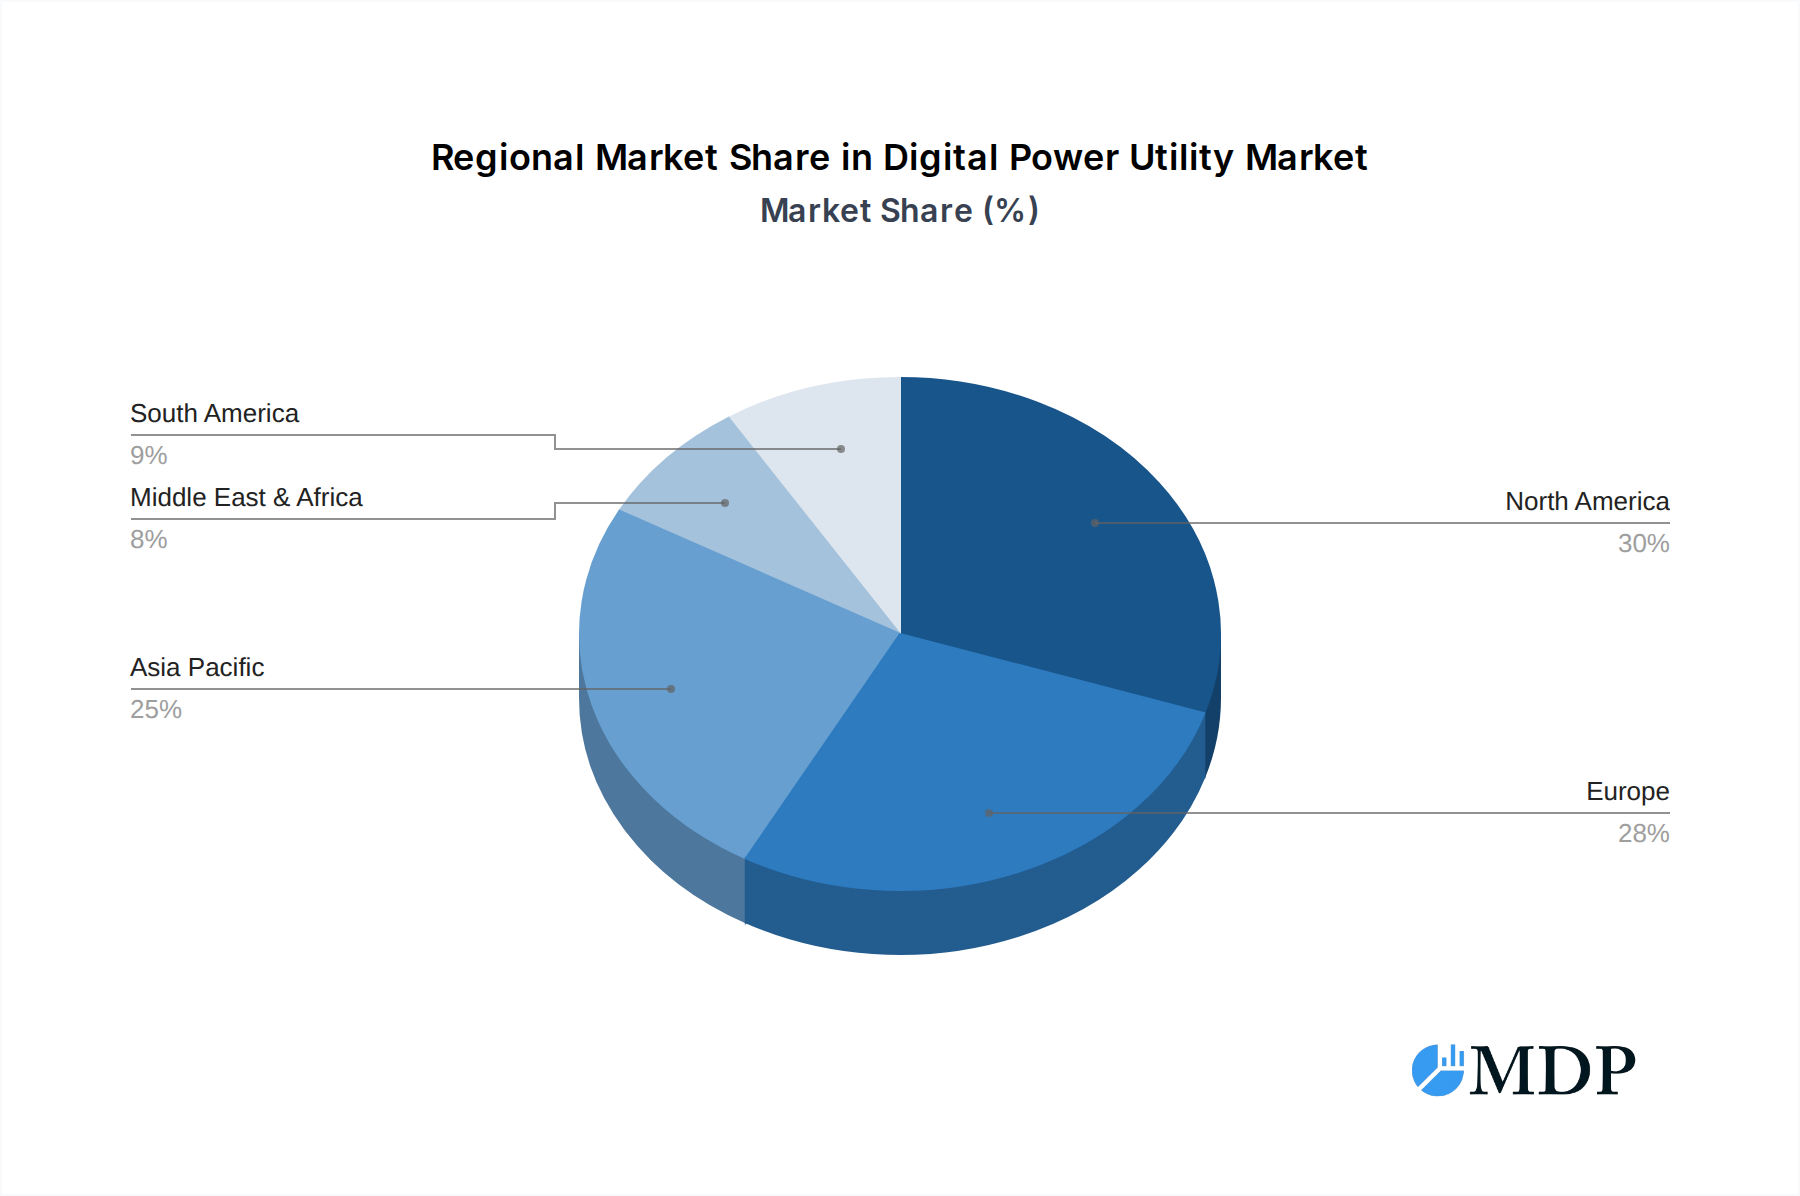
Digital Power Utility Regional Market Share
Geographic Coverage of Digital Power Utility
Digital Power Utility REPORT HIGHLIGHTS
| Aspects | Details |
|---|---|
| Study Period | 2020-2034 |
| Base Year | 2025 |
| Estimated Year | 2026 |
| Forecast Period | 2026-2034 |
| Historical Period | 2020-2025 |
| Growth Rate | CAGR of 11.13% from 2020-2034 |
| Segmentation |
|
Table of Contents
- 1. Introduction
- 1.1. Research Scope
- 1.2. Market Segmentation
- 1.3. Research Methodology
- 1.4. Definitions and Assumptions
- 2. Executive Summary
- 2.1. Introduction
- 3. Market Dynamics
- 3.1. Introduction
- 3.2. Market Drivers
- 3.3. Market Restrains
- 3.4. Market Trends
- 4. Market Factor Analysis
- 4.1. Porters Five Forces
- 4.2. Supply/Value Chain
- 4.3. PESTEL analysis
- 4.4. Market Entropy
- 4.5. Patent/Trademark Analysis
- 5. Global Digital Power Utility Analysis, Insights and Forecast, 2020-2032
- 5.1. Market Analysis, Insights and Forecast - by Application
- 5.1.1. Power Generation
- 5.1.2. Transmission and Distribution
- 5.1.3. Energy Storage
- 5.1.4. Other
- 5.2. Market Analysis, Insights and Forecast - by Types
- 5.2.1. Hardware Service
- 5.2.2. software Service
- 5.3. Market Analysis, Insights and Forecast - by Region
- 5.3.1. North America
- 5.3.2. South America
- 5.3.3. Europe
- 5.3.4. Middle East & Africa
- 5.3.5. Asia Pacific
- 5.1. Market Analysis, Insights and Forecast - by Application
- 6. North America Digital Power Utility Analysis, Insights and Forecast, 2020-2032
- 6.1. Market Analysis, Insights and Forecast - by Application
- 6.1.1. Power Generation
- 6.1.2. Transmission and Distribution
- 6.1.3. Energy Storage
- 6.1.4. Other
- 6.2. Market Analysis, Insights and Forecast - by Types
- 6.2.1. Hardware Service
- 6.2.2. software Service
- 6.1. Market Analysis, Insights and Forecast - by Application
- 7. South America Digital Power Utility Analysis, Insights and Forecast, 2020-2032
- 7.1. Market Analysis, Insights and Forecast - by Application
- 7.1.1. Power Generation
- 7.1.2. Transmission and Distribution
- 7.1.3. Energy Storage
- 7.1.4. Other
- 7.2. Market Analysis, Insights and Forecast - by Types
- 7.2.1. Hardware Service
- 7.2.2. software Service
- 7.1. Market Analysis, Insights and Forecast - by Application
- 8. Europe Digital Power Utility Analysis, Insights and Forecast, 2020-2032
- 8.1. Market Analysis, Insights and Forecast - by Application
- 8.1.1. Power Generation
- 8.1.2. Transmission and Distribution
- 8.1.3. Energy Storage
- 8.1.4. Other
- 8.2. Market Analysis, Insights and Forecast - by Types
- 8.2.1. Hardware Service
- 8.2.2. software Service
- 8.1. Market Analysis, Insights and Forecast - by Application
- 9. Middle East & Africa Digital Power Utility Analysis, Insights and Forecast, 2020-2032
- 9.1. Market Analysis, Insights and Forecast - by Application
- 9.1.1. Power Generation
- 9.1.2. Transmission and Distribution
- 9.1.3. Energy Storage
- 9.1.4. Other
- 9.2. Market Analysis, Insights and Forecast - by Types
- 9.2.1. Hardware Service
- 9.2.2. software Service
- 9.1. Market Analysis, Insights and Forecast - by Application
- 10. Asia Pacific Digital Power Utility Analysis, Insights and Forecast, 2020-2032
- 10.1. Market Analysis, Insights and Forecast - by Application
- 10.1.1. Power Generation
- 10.1.2. Transmission and Distribution
- 10.1.3. Energy Storage
- 10.1.4. Other
- 10.2. Market Analysis, Insights and Forecast - by Types
- 10.2.1. Hardware Service
- 10.2.2. software Service
- 10.1. Market Analysis, Insights and Forecast - by Application
- 11. Competitive Analysis
- 11.1. Global Market Share Analysis 2025
- 11.2. Company Profiles
- 11.2.1 General Electric
- 11.2.1.1. Overview
- 11.2.1.2. Products
- 11.2.1.3. SWOT Analysis
- 11.2.1.4. Recent Developments
- 11.2.1.5. Financials (Based on Availability)
- 11.2.2 Siemens
- 11.2.2.1. Overview
- 11.2.2.2. Products
- 11.2.2.3. SWOT Analysis
- 11.2.2.4. Recent Developments
- 11.2.2.5. Financials (Based on Availability)
- 11.2.3 ABB
- 11.2.3.1. Overview
- 11.2.3.2. Products
- 11.2.3.3. SWOT Analysis
- 11.2.3.4. Recent Developments
- 11.2.3.5. Financials (Based on Availability)
- 11.2.4 Accenture
- 11.2.4.1. Overview
- 11.2.4.2. Products
- 11.2.4.3. SWOT Analysis
- 11.2.4.4. Recent Developments
- 11.2.4.5. Financials (Based on Availability)
- 11.2.5 Capgemini
- 11.2.5.1. Overview
- 11.2.5.2. Products
- 11.2.5.3. SWOT Analysis
- 11.2.5.4. Recent Developments
- 11.2.5.5. Financials (Based on Availability)
- 11.2.6 Sap
- 11.2.6.1. Overview
- 11.2.6.2. Products
- 11.2.6.3. SWOT Analysis
- 11.2.6.4. Recent Developments
- 11.2.6.5. Financials (Based on Availability)
- 11.2.7 IBM
- 11.2.7.1. Overview
- 11.2.7.2. Products
- 11.2.7.3. SWOT Analysis
- 11.2.7.4. Recent Developments
- 11.2.7.5. Financials (Based on Availability)
- 11.2.8 Microsoft Corporation
- 11.2.8.1. Overview
- 11.2.8.2. Products
- 11.2.8.3. SWOT Analysis
- 11.2.8.4. Recent Developments
- 11.2.8.5. Financials (Based on Availability)
- 11.2.9 Oracle Corporation
- 11.2.9.1. Overview
- 11.2.9.2. Products
- 11.2.9.3. SWOT Analysis
- 11.2.9.4. Recent Developments
- 11.2.9.5. Financials (Based on Availability)
- 11.2.10 Wipro
- 11.2.10.1. Overview
- 11.2.10.2. Products
- 11.2.10.3. SWOT Analysis
- 11.2.10.4. Recent Developments
- 11.2.10.5. Financials (Based on Availability)
- 11.2.11 Infosys
- 11.2.11.1. Overview
- 11.2.11.2. Products
- 11.2.11.3. SWOT Analysis
- 11.2.11.4. Recent Developments
- 11.2.11.5. Financials (Based on Availability)
- 11.2.1 General Electric
List of Figures
- Figure 1: Global Digital Power Utility Revenue Breakdown (billion, %) by Region 2025 & 2033
- Figure 2: North America Digital Power Utility Revenue (billion), by Application 2025 & 2033
- Figure 3: North America Digital Power Utility Revenue Share (%), by Application 2025 & 2033
- Figure 4: North America Digital Power Utility Revenue (billion), by Types 2025 & 2033
- Figure 5: North America Digital Power Utility Revenue Share (%), by Types 2025 & 2033
- Figure 6: North America Digital Power Utility Revenue (billion), by Country 2025 & 2033
- Figure 7: North America Digital Power Utility Revenue Share (%), by Country 2025 & 2033
- Figure 8: South America Digital Power Utility Revenue (billion), by Application 2025 & 2033
- Figure 9: South America Digital Power Utility Revenue Share (%), by Application 2025 & 2033
- Figure 10: South America Digital Power Utility Revenue (billion), by Types 2025 & 2033
- Figure 11: South America Digital Power Utility Revenue Share (%), by Types 2025 & 2033
- Figure 12: South America Digital Power Utility Revenue (billion), by Country 2025 & 2033
- Figure 13: South America Digital Power Utility Revenue Share (%), by Country 2025 & 2033
- Figure 14: Europe Digital Power Utility Revenue (billion), by Application 2025 & 2033
- Figure 15: Europe Digital Power Utility Revenue Share (%), by Application 2025 & 2033
- Figure 16: Europe Digital Power Utility Revenue (billion), by Types 2025 & 2033
- Figure 17: Europe Digital Power Utility Revenue Share (%), by Types 2025 & 2033
- Figure 18: Europe Digital Power Utility Revenue (billion), by Country 2025 & 2033
- Figure 19: Europe Digital Power Utility Revenue Share (%), by Country 2025 & 2033
- Figure 20: Middle East & Africa Digital Power Utility Revenue (billion), by Application 2025 & 2033
- Figure 21: Middle East & Africa Digital Power Utility Revenue Share (%), by Application 2025 & 2033
- Figure 22: Middle East & Africa Digital Power Utility Revenue (billion), by Types 2025 & 2033
- Figure 23: Middle East & Africa Digital Power Utility Revenue Share (%), by Types 2025 & 2033
- Figure 24: Middle East & Africa Digital Power Utility Revenue (billion), by Country 2025 & 2033
- Figure 25: Middle East & Africa Digital Power Utility Revenue Share (%), by Country 2025 & 2033
- Figure 26: Asia Pacific Digital Power Utility Revenue (billion), by Application 2025 & 2033
- Figure 27: Asia Pacific Digital Power Utility Revenue Share (%), by Application 2025 & 2033
- Figure 28: Asia Pacific Digital Power Utility Revenue (billion), by Types 2025 & 2033
- Figure 29: Asia Pacific Digital Power Utility Revenue Share (%), by Types 2025 & 2033
- Figure 30: Asia Pacific Digital Power Utility Revenue (billion), by Country 2025 & 2033
- Figure 31: Asia Pacific Digital Power Utility Revenue Share (%), by Country 2025 & 2033
List of Tables
- Table 1: Global Digital Power Utility Revenue billion Forecast, by Application 2020 & 2033
- Table 2: Global Digital Power Utility Revenue billion Forecast, by Types 2020 & 2033
- Table 3: Global Digital Power Utility Revenue billion Forecast, by Region 2020 & 2033
- Table 4: Global Digital Power Utility Revenue billion Forecast, by Application 2020 & 2033
- Table 5: Global Digital Power Utility Revenue billion Forecast, by Types 2020 & 2033
- Table 6: Global Digital Power Utility Revenue billion Forecast, by Country 2020 & 2033
- Table 7: United States Digital Power Utility Revenue (billion) Forecast, by Application 2020 & 2033
- Table 8: Canada Digital Power Utility Revenue (billion) Forecast, by Application 2020 & 2033
- Table 9: Mexico Digital Power Utility Revenue (billion) Forecast, by Application 2020 & 2033
- Table 10: Global Digital Power Utility Revenue billion Forecast, by Application 2020 & 2033
- Table 11: Global Digital Power Utility Revenue billion Forecast, by Types 2020 & 2033
- Table 12: Global Digital Power Utility Revenue billion Forecast, by Country 2020 & 2033
- Table 13: Brazil Digital Power Utility Revenue (billion) Forecast, by Application 2020 & 2033
- Table 14: Argentina Digital Power Utility Revenue (billion) Forecast, by Application 2020 & 2033
- Table 15: Rest of South America Digital Power Utility Revenue (billion) Forecast, by Application 2020 & 2033
- Table 16: Global Digital Power Utility Revenue billion Forecast, by Application 2020 & 2033
- Table 17: Global Digital Power Utility Revenue billion Forecast, by Types 2020 & 2033
- Table 18: Global Digital Power Utility Revenue billion Forecast, by Country 2020 & 2033
- Table 19: United Kingdom Digital Power Utility Revenue (billion) Forecast, by Application 2020 & 2033
- Table 20: Germany Digital Power Utility Revenue (billion) Forecast, by Application 2020 & 2033
- Table 21: France Digital Power Utility Revenue (billion) Forecast, by Application 2020 & 2033
- Table 22: Italy Digital Power Utility Revenue (billion) Forecast, by Application 2020 & 2033
- Table 23: Spain Digital Power Utility Revenue (billion) Forecast, by Application 2020 & 2033
- Table 24: Russia Digital Power Utility Revenue (billion) Forecast, by Application 2020 & 2033
- Table 25: Benelux Digital Power Utility Revenue (billion) Forecast, by Application 2020 & 2033
- Table 26: Nordics Digital Power Utility Revenue (billion) Forecast, by Application 2020 & 2033
- Table 27: Rest of Europe Digital Power Utility Revenue (billion) Forecast, by Application 2020 & 2033
- Table 28: Global Digital Power Utility Revenue billion Forecast, by Application 2020 & 2033
- Table 29: Global Digital Power Utility Revenue billion Forecast, by Types 2020 & 2033
- Table 30: Global Digital Power Utility Revenue billion Forecast, by Country 2020 & 2033
- Table 31: Turkey Digital Power Utility Revenue (billion) Forecast, by Application 2020 & 2033
- Table 32: Israel Digital Power Utility Revenue (billion) Forecast, by Application 2020 & 2033
- Table 33: GCC Digital Power Utility Revenue (billion) Forecast, by Application 2020 & 2033
- Table 34: North Africa Digital Power Utility Revenue (billion) Forecast, by Application 2020 & 2033
- Table 35: South Africa Digital Power Utility Revenue (billion) Forecast, by Application 2020 & 2033
- Table 36: Rest of Middle East & Africa Digital Power Utility Revenue (billion) Forecast, by Application 2020 & 2033
- Table 37: Global Digital Power Utility Revenue billion Forecast, by Application 2020 & 2033
- Table 38: Global Digital Power Utility Revenue billion Forecast, by Types 2020 & 2033
- Table 39: Global Digital Power Utility Revenue billion Forecast, by Country 2020 & 2033
- Table 40: China Digital Power Utility Revenue (billion) Forecast, by Application 2020 & 2033
- Table 41: India Digital Power Utility Revenue (billion) Forecast, by Application 2020 & 2033
- Table 42: Japan Digital Power Utility Revenue (billion) Forecast, by Application 2020 & 2033
- Table 43: South Korea Digital Power Utility Revenue (billion) Forecast, by Application 2020 & 2033
- Table 44: ASEAN Digital Power Utility Revenue (billion) Forecast, by Application 2020 & 2033
- Table 45: Oceania Digital Power Utility Revenue (billion) Forecast, by Application 2020 & 2033
- Table 46: Rest of Asia Pacific Digital Power Utility Revenue (billion) Forecast, by Application 2020 & 2033
Frequently Asked Questions
1. What is the projected Compound Annual Growth Rate (CAGR) of the Digital Power Utility?
The projected CAGR is approximately 11.13%.
2. Which companies are prominent players in the Digital Power Utility?
Key companies in the market include General Electric, Siemens, ABB, Accenture, Capgemini, Sap, IBM, Microsoft Corporation, Oracle Corporation, Wipro, Infosys.
3. What are the main segments of the Digital Power Utility?
The market segments include Application, Types.
4. Can you provide details about the market size?
The market size is estimated to be USD 227.85 billion as of 2022.
5. What are some drivers contributing to market growth?
N/A
6. What are the notable trends driving market growth?
N/A
7. Are there any restraints impacting market growth?
N/A
8. Can you provide examples of recent developments in the market?
N/A
9. What pricing options are available for accessing the report?
Pricing options include single-user, multi-user, and enterprise licenses priced at USD 3350.00, USD 5025.00, and USD 6700.00 respectively.
10. Is the market size provided in terms of value or volume?
The market size is provided in terms of value, measured in billion.
11. Are there any specific market keywords associated with the report?
Yes, the market keyword associated with the report is "Digital Power Utility," which aids in identifying and referencing the specific market segment covered.
12. How do I determine which pricing option suits my needs best?
The pricing options vary based on user requirements and access needs. Individual users may opt for single-user licenses, while businesses requiring broader access may choose multi-user or enterprise licenses for cost-effective access to the report.
13. Are there any additional resources or data provided in the Digital Power Utility report?
While the report offers comprehensive insights, it's advisable to review the specific contents or supplementary materials provided to ascertain if additional resources or data are available.
14. How can I stay updated on further developments or reports in the Digital Power Utility?
To stay informed about further developments, trends, and reports in the Digital Power Utility, consider subscribing to industry newsletters, following relevant companies and organizations, or regularly checking reputable industry news sources and publications.
Methodology
Step 1 - Identification of Relevant Samples Size from Population Database


Step 2 - Approaches for Defining Global Market Size (Value, Volume* & Price*)

Note*: In applicable scenarios
Step 3 - Data Sources
Primary Research
- Web Analytics
- Survey Reports
- Research Institute
- Latest Research Reports
- Opinion Leaders
Secondary Research
- Annual Reports
- White Paper
- Latest Press Release
- Industry Association
- Paid Database
- Investor Presentations

Step 4 - Data Triangulation
Involves using different sources of information in order to increase the validity of a study
These sources are likely to be stakeholders in a program - participants, other researchers, program staff, other community members, and so on.
Then we put all data in single framework & apply various statistical tools to find out the dynamic on the market.
During the analysis stage, feedback from the stakeholder groups would be compared to determine areas of agreement as well as areas of divergence