

Key Insights
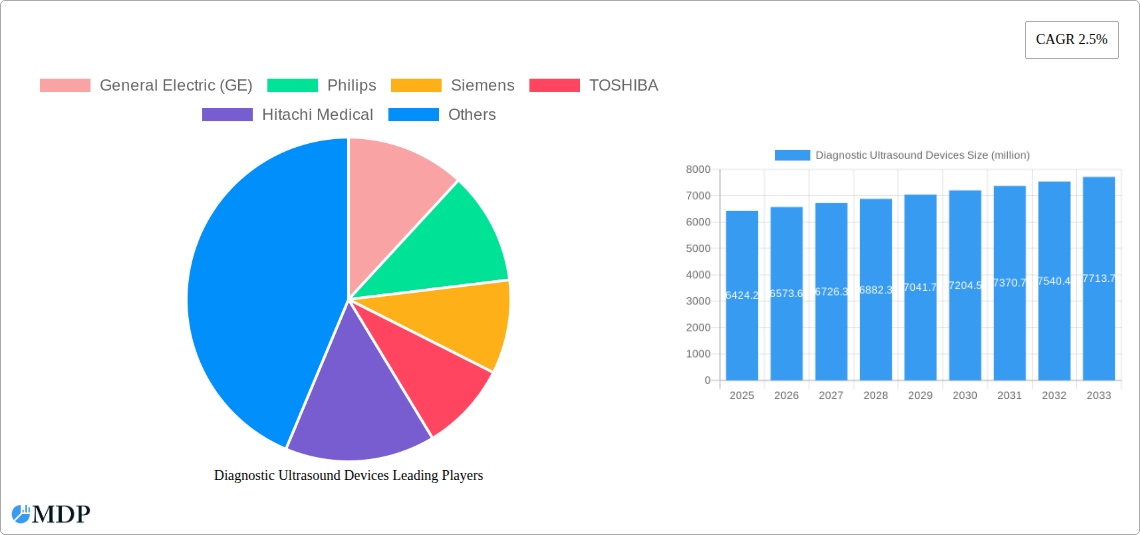
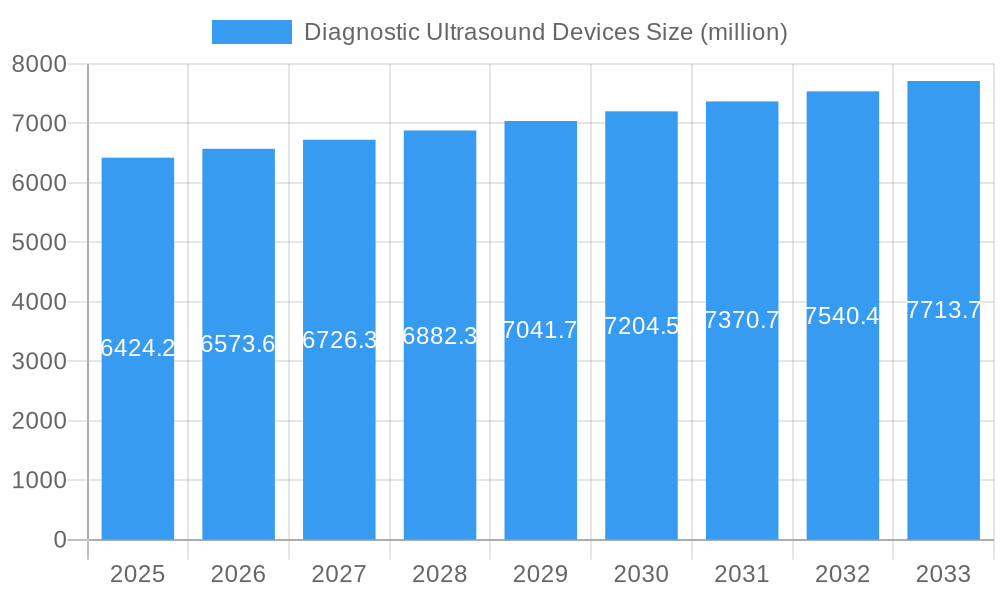
The global diagnostic ultrasound devices market, valued at $6,424.2 million in 2025, is projected to experience steady growth, driven by a compound annual growth rate (CAGR) of 2.5% from 2025 to 2033. This growth is fueled by several key factors. Technological advancements leading to improved image quality, portability, and functionality are making ultrasound more accessible and appealing to healthcare providers. The increasing prevalence of chronic diseases, particularly cardiovascular and oncology conditions, necessitates frequent diagnostic imaging, thereby boosting demand. Furthermore, the rising adoption of point-of-care ultrasound (POCUS) in various settings, including emergency rooms, clinics, and even ambulances, contributes to market expansion. The expanding geriatric population also plays a significant role, as older individuals often require more frequent ultrasound examinations. Competitive forces are also driving innovation, with established players like GE, Philips, and Siemens continuously developing and launching advanced ultrasound systems, alongside emerging players like Mindray and SonoScape offering competitive, cost-effective alternatives.
Diagnostic Ultrasound Devices Market Size (In Billion)
However, the market faces certain challenges. The high initial cost of purchasing and maintaining advanced ultrasound systems can be a barrier, especially for smaller healthcare facilities in developing regions. The regulatory landscape for medical devices, varying across different countries, also presents complexity and potential delays for product approvals. Additionally, the increasing adoption of alternative imaging techniques, such as MRI and CT scans, presents some level of competition for market share. Nonetheless, the overall growth trajectory remains positive, driven by the irreplaceable role of ultrasound in providing non-invasive, cost-effective, and real-time diagnostic imaging across various medical specialties. The market's future success hinges on continuous innovation, affordable technology, and expanded access in underserved areas.
Diagnostic Ultrasound Devices Company Market Share
Diagnostic Ultrasound Devices Market Report: 2019-2033
This comprehensive report provides a detailed analysis of the global diagnostic ultrasound devices market, projecting a market valuation exceeding $XX billion by 2033. It offers actionable insights for industry stakeholders, investors, and strategists seeking to navigate this dynamic sector. The report covers the period from 2019 to 2033, with a base year of 2025 and a forecast period from 2025 to 2033. Key players analyzed include General Electric (GE), Philips, Siemens, TOSHIBA, Hitachi Medical, Mindray, Sonosite (FUJIFILM), Esaote, Samsung Medison, Konica Minolta, SonoScape, LANDWIND MEDICAL, SIUI, CHISON, and EDAN Instruments. The report leverages high-impact keywords to maximize search visibility and offers in-depth analysis across key market segments.
Diagnostic Ultrasound Devices Market Dynamics & Concentration
The global diagnostic ultrasound devices market is characterized by a moderately concentrated landscape with a few major players holding significant market share. GE, Philips, and Siemens collectively account for an estimated xx% of the market in 2025, showcasing their dominance through established brand recognition, extensive distribution networks, and a diverse product portfolio. However, the market is witnessing increasing competition from emerging players like Mindray and SonoScape, who are aggressively expanding their market share through cost-effective solutions and technological innovation.
- Market Concentration: The top 5 players hold approximately xx% market share in 2025.
- Innovation Drivers: Technological advancements such as AI-powered image analysis and portable ultrasound systems are driving market growth.
- Regulatory Frameworks: Stringent regulatory approvals and safety standards influence market dynamics.
- Product Substitutes: While limited, alternative imaging technologies present some degree of competitive pressure.
- End-User Trends: Increasing demand from hospitals, clinics, and ambulatory care centers fuels market expansion.
- M&A Activities: The past five years have seen xx M&A deals within the diagnostic ultrasound devices sector, indicating a trend of consolidation and strategic expansion.
Diagnostic Ultrasound Devices Industry Trends & Analysis
The diagnostic ultrasound devices market is experiencing robust growth, with a projected CAGR of xx% during the forecast period (2025-2033). This growth is fueled by several key factors: the increasing prevalence of chronic diseases requiring regular diagnostic imaging, rising disposable incomes globally leading to increased healthcare spending, technological advancements enabling improved image quality and portability, and growing adoption of point-of-care ultrasound. The market penetration of advanced ultrasound technologies, such as contrast-enhanced ultrasound and elastography, remains relatively low but is expected to increase significantly during the forecast period. Competitive dynamics are shaped by continuous innovation, strategic partnerships, and the expansion into emerging markets.
Leading Markets & Segments in Diagnostic Ultrasound Devices
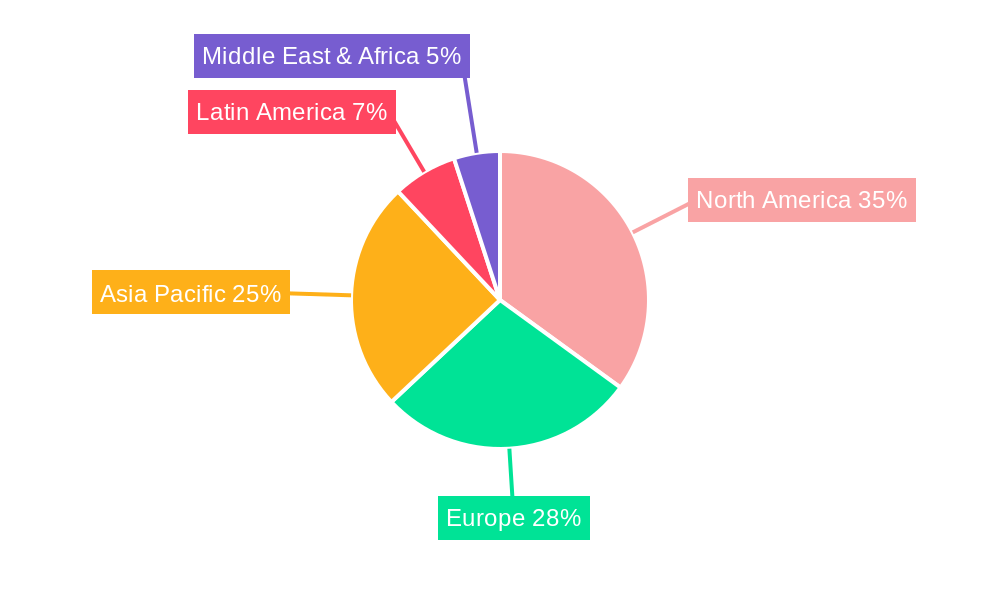
North America currently holds the largest market share in diagnostic ultrasound devices, driven by high healthcare expenditure, advanced medical infrastructure, and a large aging population. However, the Asia-Pacific region is expected to witness the fastest growth during the forecast period. This is primarily due to increasing healthcare awareness, rising disposable incomes, and supportive government initiatives.
- North America: High healthcare spending, advanced infrastructure, and strong regulatory framework.
- Europe: Well-established healthcare systems, but slower growth compared to Asia-Pacific.
- Asia-Pacific: Fastest-growing region due to rising disposable income, increased healthcare awareness, and government initiatives.
Within segments, cardiovascular ultrasound holds a significant market share, followed by abdominal and obstetrics/gynecology ultrasound. The growing demand for portable and handheld ultrasound systems is also driving the growth of specific segments.
Diagnostic Ultrasound Devices Product Developments
Recent product innovations focus on enhancing image quality, improving portability, and integrating advanced functionalities such as AI-powered image analysis. Manufacturers are increasingly focusing on developing cost-effective solutions to expand market access in developing economies. The integration of AI and machine learning allows for faster diagnosis and improved accuracy, while miniaturization enables point-of-care applications expanding accessibility.
Key Drivers of Diagnostic Ultrasound Devices Growth
Several factors are driving the growth of the diagnostic ultrasound devices market, including:
- Technological advancements: AI-powered image analysis, improved image quality, and portability.
- Rising prevalence of chronic diseases: Increased need for diagnostic imaging.
- Favorable regulatory environment: Support for technological innovation and market expansion.
Challenges in the Diagnostic Ultrasound Devices Market
The market faces several challenges, including:
- High cost of advanced ultrasound systems: Limiting accessibility in resource-constrained settings.
- Stringent regulatory approvals: Increasing development costs and timelines.
- Intense competition: Pressuring pricing and profitability.
Emerging Opportunities in Diagnostic Ultrasound Devices
Significant growth opportunities exist in expanding access to point-of-care ultrasound, developing AI-powered diagnostic tools, and penetrating emerging markets. Strategic partnerships and collaborations among device manufacturers, healthcare providers, and technology companies can further accelerate market expansion.
Leading Players in the Diagnostic Ultrasound Devices Sector
- General Electric (GE)
- Philips
- Siemens
- TOSHIBA
- Hitachi Medical
- Mindray
- Sonosite (FUJIFILM)
- Esaote
- Samsung Medison
- Konica Minolta
- SonoScape
- LANDWIND MEDICAL
- SIUI
- CHISON
- EDAN Instruments
Key Milestones in Diagnostic Ultrasound Devices Industry
- 2020: Mindray launches a new line of portable ultrasound systems.
- 2022: Philips announces a significant investment in AI-powered ultrasound technology.
- 2023: Several key mergers and acquisitions reshape the market landscape. (Specific details are unavailable and require further research).
Strategic Outlook for Diagnostic Ultrasound Devices Market
The diagnostic ultrasound devices market holds immense potential for growth driven by continuous technological advancements, rising healthcare spending, and increasing demand for point-of-care diagnostics. Strategic partnerships, focused product innovation, and expansion into underserved markets will be crucial for sustained success in this dynamic sector.
Diagnostic Ultrasound Devices Segmentation
-
1. Application
- 1.1. Radiology/Oncology
- 1.2. Cardiology
- 1.3. Obstetrics & Gynecology
- 1.4. Mammography/Breast
- 1.5. Emergency Medicine
- 1.6. Vascular
- 1.7. Others
-
2. Types
- 2.1. 2D
- 2.2. 3D&4D
- 2.3. Doppler
Diagnostic Ultrasound Devices Segmentation By Geography
-
1. North America
- 1.1. United States
- 1.2. Canada
- 1.3. Mexico
-
2. South America
- 2.1. Brazil
- 2.2. Argentina
- 2.3. Rest of South America
-
3. Europe
- 3.1. United Kingdom
- 3.2. Germany
- 3.3. France
- 3.4. Italy
- 3.5. Spain
- 3.6. Russia
- 3.7. Benelux
- 3.8. Nordics
- 3.9. Rest of Europe
-
4. Middle East & Africa
- 4.1. Turkey
- 4.2. Israel
- 4.3. GCC
- 4.4. North Africa
- 4.5. South Africa
- 4.6. Rest of Middle East & Africa
-
5. Asia Pacific
- 5.1. China
- 5.2. India
- 5.3. Japan
- 5.4. South Korea
- 5.5. ASEAN
- 5.6. Oceania
- 5.7. Rest of Asia Pacific
Diagnostic Ultrasound Devices Regional Market Share
Geographic Coverage of Diagnostic Ultrasound Devices
Diagnostic Ultrasound Devices REPORT HIGHLIGHTS
| Aspects | Details |
|---|---|
| Study Period | 2020-2034 |
| Base Year | 2025 |
| Estimated Year | 2026 |
| Forecast Period | 2026-2034 |
| Historical Period | 2020-2025 |
| Growth Rate | CAGR of 2.5% from 2020-2034 |
| Segmentation |
|
Table of Contents
- 1. Introduction
- 1.1. Research Scope
- 1.2. Market Segmentation
- 1.3. Research Objective
- 1.4. Definitions and Assumptions
- 2. Executive Summary
- 2.1. Market Snapshot
- 3. Market Dynamics
- 3.1. Market Drivers
- 3.2. Market Restrains
- 3.3. Market Trends
- 3.4. Market Opportunities
- 4. Market Factor Analysis
- 4.1. Porters Five Forces
- 4.1.1. Bargaining Power of Suppliers
- 4.1.2. Bargaining Power of Buyers
- 4.1.3. Threat of New Entrants
- 4.1.4. Threat of Substitutes
- 4.1.5. Competitive Rivalry
- 4.2. PESTEL analysis
- 4.3. BCG Analysis
- 4.3.1. Stars (High Growth, High Market Share)
- 4.3.2. Cash Cows (Low Growth, High Market Share)
- 4.3.3. Question Mark (High Growth, Low Market Share)
- 4.3.4. Dogs (Low Growth, Low Market Share)
- 4.4. Ansoff Matrix Analysis
- 4.5. Supply Chain Analysis
- 4.6. Regulatory Landscape
- 4.7. Current Market Potential and Opportunity Assessment (TAM–SAM–SOM Framework)
- 4.8. MDP Analyst Note
- 4.1. Porters Five Forces
- 5. Market Analysis, Insights and Forecast 2021-2033
- 5.1. Market Analysis, Insights and Forecast - by Application
- 5.1.1. Radiology/Oncology
- 5.1.2. Cardiology
- 5.1.3. Obstetrics & Gynecology
- 5.1.4. Mammography/Breast
- 5.1.5. Emergency Medicine
- 5.1.6. Vascular
- 5.1.7. Others
- 5.2. Market Analysis, Insights and Forecast - by Types
- 5.2.1. 2D
- 5.2.2. 3D&4D
- 5.2.3. Doppler
- 5.3. Market Analysis, Insights and Forecast - by Region
- 5.3.1. North America
- 5.3.2. South America
- 5.3.3. Europe
- 5.3.4. Middle East & Africa
- 5.3.5. Asia Pacific
- 5.1. Market Analysis, Insights and Forecast - by Application
- 6. Global Diagnostic Ultrasound Devices Analysis, Insights and Forecast, 2021-2033
- 6.1. Market Analysis, Insights and Forecast - by Application
- 6.1.1. Radiology/Oncology
- 6.1.2. Cardiology
- 6.1.3. Obstetrics & Gynecology
- 6.1.4. Mammography/Breast
- 6.1.5. Emergency Medicine
- 6.1.6. Vascular
- 6.1.7. Others
- 6.2. Market Analysis, Insights and Forecast - by Types
- 6.2.1. 2D
- 6.2.2. 3D&4D
- 6.2.3. Doppler
- 6.1. Market Analysis, Insights and Forecast - by Application
- 7. North America Diagnostic Ultrasound Devices Analysis, Insights and Forecast, 2020-2032
- 7.1. Market Analysis, Insights and Forecast - by Application
- 7.1.1. Radiology/Oncology
- 7.1.2. Cardiology
- 7.1.3. Obstetrics & Gynecology
- 7.1.4. Mammography/Breast
- 7.1.5. Emergency Medicine
- 7.1.6. Vascular
- 7.1.7. Others
- 7.2. Market Analysis, Insights and Forecast - by Types
- 7.2.1. 2D
- 7.2.2. 3D&4D
- 7.2.3. Doppler
- 7.1. Market Analysis, Insights and Forecast - by Application
- 8. South America Diagnostic Ultrasound Devices Analysis, Insights and Forecast, 2020-2032
- 8.1. Market Analysis, Insights and Forecast - by Application
- 8.1.1. Radiology/Oncology
- 8.1.2. Cardiology
- 8.1.3. Obstetrics & Gynecology
- 8.1.4. Mammography/Breast
- 8.1.5. Emergency Medicine
- 8.1.6. Vascular
- 8.1.7. Others
- 8.2. Market Analysis, Insights and Forecast - by Types
- 8.2.1. 2D
- 8.2.2. 3D&4D
- 8.2.3. Doppler
- 8.1. Market Analysis, Insights and Forecast - by Application
- 9. Europe Diagnostic Ultrasound Devices Analysis, Insights and Forecast, 2020-2032
- 9.1. Market Analysis, Insights and Forecast - by Application
- 9.1.1. Radiology/Oncology
- 9.1.2. Cardiology
- 9.1.3. Obstetrics & Gynecology
- 9.1.4. Mammography/Breast
- 9.1.5. Emergency Medicine
- 9.1.6. Vascular
- 9.1.7. Others
- 9.2. Market Analysis, Insights and Forecast - by Types
- 9.2.1. 2D
- 9.2.2. 3D&4D
- 9.2.3. Doppler
- 9.1. Market Analysis, Insights and Forecast - by Application
- 10. Middle East & Africa Diagnostic Ultrasound Devices Analysis, Insights and Forecast, 2020-2032
- 10.1. Market Analysis, Insights and Forecast - by Application
- 10.1.1. Radiology/Oncology
- 10.1.2. Cardiology
- 10.1.3. Obstetrics & Gynecology
- 10.1.4. Mammography/Breast
- 10.1.5. Emergency Medicine
- 10.1.6. Vascular
- 10.1.7. Others
- 10.2. Market Analysis, Insights and Forecast - by Types
- 10.2.1. 2D
- 10.2.2. 3D&4D
- 10.2.3. Doppler
- 10.1. Market Analysis, Insights and Forecast - by Application
- 11. Asia Pacific Diagnostic Ultrasound Devices Analysis, Insights and Forecast, 2020-2032
- 11.1. Market Analysis, Insights and Forecast - by Application
- 11.1.1. Radiology/Oncology
- 11.1.2. Cardiology
- 11.1.3. Obstetrics & Gynecology
- 11.1.4. Mammography/Breast
- 11.1.5. Emergency Medicine
- 11.1.6. Vascular
- 11.1.7. Others
- 11.2. Market Analysis, Insights and Forecast - by Types
- 11.2.1. 2D
- 11.2.2. 3D&4D
- 11.2.3. Doppler
- 11.1. Market Analysis, Insights and Forecast - by Application
- 12. Competitive Analysis
- 12.1. Company Profiles
- 12.1.1 General Electric (GE)
- 12.1.1.1. Company Overview
- 12.1.1.2. Products
- 12.1.1.3. Company Financials
- 12.1.1.4. SWOT Analysis
- 12.1.2 Philips
- 12.1.2.1. Company Overview
- 12.1.2.2. Products
- 12.1.2.3. Company Financials
- 12.1.2.4. SWOT Analysis
- 12.1.3 Siemens
- 12.1.3.1. Company Overview
- 12.1.3.2. Products
- 12.1.3.3. Company Financials
- 12.1.3.4. SWOT Analysis
- 12.1.4 TOSHIBA
- 12.1.4.1. Company Overview
- 12.1.4.2. Products
- 12.1.4.3. Company Financials
- 12.1.4.4. SWOT Analysis
- 12.1.5 Hitachi Medical
- 12.1.5.1. Company Overview
- 12.1.5.2. Products
- 12.1.5.3. Company Financials
- 12.1.5.4. SWOT Analysis
- 12.1.6 Mindray
- 12.1.6.1. Company Overview
- 12.1.6.2. Products
- 12.1.6.3. Company Financials
- 12.1.6.4. SWOT Analysis
- 12.1.7 Sonosite (FUJIFILM )
- 12.1.7.1. Company Overview
- 12.1.7.2. Products
- 12.1.7.3. Company Financials
- 12.1.7.4. SWOT Analysis
- 12.1.8 Esaote
- 12.1.8.1. Company Overview
- 12.1.8.2. Products
- 12.1.8.3. Company Financials
- 12.1.8.4. SWOT Analysis
- 12.1.9 Samsung Medison
- 12.1.9.1. Company Overview
- 12.1.9.2. Products
- 12.1.9.3. Company Financials
- 12.1.9.4. SWOT Analysis
- 12.1.10 Konica Minolta
- 12.1.10.1. Company Overview
- 12.1.10.2. Products
- 12.1.10.3. Company Financials
- 12.1.10.4. SWOT Analysis
- 12.1.11 SonoScape
- 12.1.11.1. Company Overview
- 12.1.11.2. Products
- 12.1.11.3. Company Financials
- 12.1.11.4. SWOT Analysis
- 12.1.12 LANDWIND MEDICAL
- 12.1.12.1. Company Overview
- 12.1.12.2. Products
- 12.1.12.3. Company Financials
- 12.1.12.4. SWOT Analysis
- 12.1.13 SIUI
- 12.1.13.1. Company Overview
- 12.1.13.2. Products
- 12.1.13.3. Company Financials
- 12.1.13.4. SWOT Analysis
- 12.1.14 CHISON
- 12.1.14.1. Company Overview
- 12.1.14.2. Products
- 12.1.14.3. Company Financials
- 12.1.14.4. SWOT Analysis
- 12.1.15 EDAN Instruments
- 12.1.15.1. Company Overview
- 12.1.15.2. Products
- 12.1.15.3. Company Financials
- 12.1.15.4. SWOT Analysis
- 12.1.1 General Electric (GE)
- 12.2. Market Entropy
- 12.2.1 Company's Key Areas Served
- 12.2.2 Recent Developments
- 12.3. Company Market Share Analysis 2025
- 12.3.1 Top 5 Companies Market Share Analysis
- 12.3.2 Top 3 Companies Market Share Analysis
- 12.4. List of Potential Customers
- 13. Research Methodology
List of Figures
- Figure 1: Global Diagnostic Ultrasound Devices Revenue Breakdown (million, %) by Region 2025 & 2033
- Figure 2: Global Diagnostic Ultrasound Devices Volume Breakdown (K, %) by Region 2025 & 2033
- Figure 3: North America Diagnostic Ultrasound Devices Revenue (million), by Application 2025 & 2033
- Figure 4: North America Diagnostic Ultrasound Devices Volume (K), by Application 2025 & 2033
- Figure 5: North America Diagnostic Ultrasound Devices Revenue Share (%), by Application 2025 & 2033
- Figure 6: North America Diagnostic Ultrasound Devices Volume Share (%), by Application 2025 & 2033
- Figure 7: North America Diagnostic Ultrasound Devices Revenue (million), by Types 2025 & 2033
- Figure 8: North America Diagnostic Ultrasound Devices Volume (K), by Types 2025 & 2033
- Figure 9: North America Diagnostic Ultrasound Devices Revenue Share (%), by Types 2025 & 2033
- Figure 10: North America Diagnostic Ultrasound Devices Volume Share (%), by Types 2025 & 2033
- Figure 11: North America Diagnostic Ultrasound Devices Revenue (million), by Country 2025 & 2033
- Figure 12: North America Diagnostic Ultrasound Devices Volume (K), by Country 2025 & 2033
- Figure 13: North America Diagnostic Ultrasound Devices Revenue Share (%), by Country 2025 & 2033
- Figure 14: North America Diagnostic Ultrasound Devices Volume Share (%), by Country 2025 & 2033
- Figure 15: South America Diagnostic Ultrasound Devices Revenue (million), by Application 2025 & 2033
- Figure 16: South America Diagnostic Ultrasound Devices Volume (K), by Application 2025 & 2033
- Figure 17: South America Diagnostic Ultrasound Devices Revenue Share (%), by Application 2025 & 2033
- Figure 18: South America Diagnostic Ultrasound Devices Volume Share (%), by Application 2025 & 2033
- Figure 19: South America Diagnostic Ultrasound Devices Revenue (million), by Types 2025 & 2033
- Figure 20: South America Diagnostic Ultrasound Devices Volume (K), by Types 2025 & 2033
- Figure 21: South America Diagnostic Ultrasound Devices Revenue Share (%), by Types 2025 & 2033
- Figure 22: South America Diagnostic Ultrasound Devices Volume Share (%), by Types 2025 & 2033
- Figure 23: South America Diagnostic Ultrasound Devices Revenue (million), by Country 2025 & 2033
- Figure 24: South America Diagnostic Ultrasound Devices Volume (K), by Country 2025 & 2033
- Figure 25: South America Diagnostic Ultrasound Devices Revenue Share (%), by Country 2025 & 2033
- Figure 26: South America Diagnostic Ultrasound Devices Volume Share (%), by Country 2025 & 2033
- Figure 27: Europe Diagnostic Ultrasound Devices Revenue (million), by Application 2025 & 2033
- Figure 28: Europe Diagnostic Ultrasound Devices Volume (K), by Application 2025 & 2033
- Figure 29: Europe Diagnostic Ultrasound Devices Revenue Share (%), by Application 2025 & 2033
- Figure 30: Europe Diagnostic Ultrasound Devices Volume Share (%), by Application 2025 & 2033
- Figure 31: Europe Diagnostic Ultrasound Devices Revenue (million), by Types 2025 & 2033
- Figure 32: Europe Diagnostic Ultrasound Devices Volume (K), by Types 2025 & 2033
- Figure 33: Europe Diagnostic Ultrasound Devices Revenue Share (%), by Types 2025 & 2033
- Figure 34: Europe Diagnostic Ultrasound Devices Volume Share (%), by Types 2025 & 2033
- Figure 35: Europe Diagnostic Ultrasound Devices Revenue (million), by Country 2025 & 2033
- Figure 36: Europe Diagnostic Ultrasound Devices Volume (K), by Country 2025 & 2033
- Figure 37: Europe Diagnostic Ultrasound Devices Revenue Share (%), by Country 2025 & 2033
- Figure 38: Europe Diagnostic Ultrasound Devices Volume Share (%), by Country 2025 & 2033
- Figure 39: Middle East & Africa Diagnostic Ultrasound Devices Revenue (million), by Application 2025 & 2033
- Figure 40: Middle East & Africa Diagnostic Ultrasound Devices Volume (K), by Application 2025 & 2033
- Figure 41: Middle East & Africa Diagnostic Ultrasound Devices Revenue Share (%), by Application 2025 & 2033
- Figure 42: Middle East & Africa Diagnostic Ultrasound Devices Volume Share (%), by Application 2025 & 2033
- Figure 43: Middle East & Africa Diagnostic Ultrasound Devices Revenue (million), by Types 2025 & 2033
- Figure 44: Middle East & Africa Diagnostic Ultrasound Devices Volume (K), by Types 2025 & 2033
- Figure 45: Middle East & Africa Diagnostic Ultrasound Devices Revenue Share (%), by Types 2025 & 2033
- Figure 46: Middle East & Africa Diagnostic Ultrasound Devices Volume Share (%), by Types 2025 & 2033
- Figure 47: Middle East & Africa Diagnostic Ultrasound Devices Revenue (million), by Country 2025 & 2033
- Figure 48: Middle East & Africa Diagnostic Ultrasound Devices Volume (K), by Country 2025 & 2033
- Figure 49: Middle East & Africa Diagnostic Ultrasound Devices Revenue Share (%), by Country 2025 & 2033
- Figure 50: Middle East & Africa Diagnostic Ultrasound Devices Volume Share (%), by Country 2025 & 2033
- Figure 51: Asia Pacific Diagnostic Ultrasound Devices Revenue (million), by Application 2025 & 2033
- Figure 52: Asia Pacific Diagnostic Ultrasound Devices Volume (K), by Application 2025 & 2033
- Figure 53: Asia Pacific Diagnostic Ultrasound Devices Revenue Share (%), by Application 2025 & 2033
- Figure 54: Asia Pacific Diagnostic Ultrasound Devices Volume Share (%), by Application 2025 & 2033
- Figure 55: Asia Pacific Diagnostic Ultrasound Devices Revenue (million), by Types 2025 & 2033
- Figure 56: Asia Pacific Diagnostic Ultrasound Devices Volume (K), by Types 2025 & 2033
- Figure 57: Asia Pacific Diagnostic Ultrasound Devices Revenue Share (%), by Types 2025 & 2033
- Figure 58: Asia Pacific Diagnostic Ultrasound Devices Volume Share (%), by Types 2025 & 2033
- Figure 59: Asia Pacific Diagnostic Ultrasound Devices Revenue (million), by Country 2025 & 2033
- Figure 60: Asia Pacific Diagnostic Ultrasound Devices Volume (K), by Country 2025 & 2033
- Figure 61: Asia Pacific Diagnostic Ultrasound Devices Revenue Share (%), by Country 2025 & 2033
- Figure 62: Asia Pacific Diagnostic Ultrasound Devices Volume Share (%), by Country 2025 & 2033
List of Tables
- Table 1: Global Diagnostic Ultrasound Devices Revenue million Forecast, by Application 2020 & 2033
- Table 2: Global Diagnostic Ultrasound Devices Volume K Forecast, by Application 2020 & 2033
- Table 3: Global Diagnostic Ultrasound Devices Revenue million Forecast, by Types 2020 & 2033
- Table 4: Global Diagnostic Ultrasound Devices Volume K Forecast, by Types 2020 & 2033
- Table 5: Global Diagnostic Ultrasound Devices Revenue million Forecast, by Region 2020 & 2033
- Table 6: Global Diagnostic Ultrasound Devices Volume K Forecast, by Region 2020 & 2033
- Table 7: Global Diagnostic Ultrasound Devices Revenue million Forecast, by Application 2020 & 2033
- Table 8: Global Diagnostic Ultrasound Devices Volume K Forecast, by Application 2020 & 2033
- Table 9: Global Diagnostic Ultrasound Devices Revenue million Forecast, by Types 2020 & 2033
- Table 10: Global Diagnostic Ultrasound Devices Volume K Forecast, by Types 2020 & 2033
- Table 11: Global Diagnostic Ultrasound Devices Revenue million Forecast, by Country 2020 & 2033
- Table 12: Global Diagnostic Ultrasound Devices Volume K Forecast, by Country 2020 & 2033
- Table 13: United States Diagnostic Ultrasound Devices Revenue (million) Forecast, by Application 2020 & 2033
- Table 14: United States Diagnostic Ultrasound Devices Volume (K) Forecast, by Application 2020 & 2033
- Table 15: Canada Diagnostic Ultrasound Devices Revenue (million) Forecast, by Application 2020 & 2033
- Table 16: Canada Diagnostic Ultrasound Devices Volume (K) Forecast, by Application 2020 & 2033
- Table 17: Mexico Diagnostic Ultrasound Devices Revenue (million) Forecast, by Application 2020 & 2033
- Table 18: Mexico Diagnostic Ultrasound Devices Volume (K) Forecast, by Application 2020 & 2033
- Table 19: Global Diagnostic Ultrasound Devices Revenue million Forecast, by Application 2020 & 2033
- Table 20: Global Diagnostic Ultrasound Devices Volume K Forecast, by Application 2020 & 2033
- Table 21: Global Diagnostic Ultrasound Devices Revenue million Forecast, by Types 2020 & 2033
- Table 22: Global Diagnostic Ultrasound Devices Volume K Forecast, by Types 2020 & 2033
- Table 23: Global Diagnostic Ultrasound Devices Revenue million Forecast, by Country 2020 & 2033
- Table 24: Global Diagnostic Ultrasound Devices Volume K Forecast, by Country 2020 & 2033
- Table 25: Brazil Diagnostic Ultrasound Devices Revenue (million) Forecast, by Application 2020 & 2033
- Table 26: Brazil Diagnostic Ultrasound Devices Volume (K) Forecast, by Application 2020 & 2033
- Table 27: Argentina Diagnostic Ultrasound Devices Revenue (million) Forecast, by Application 2020 & 2033
- Table 28: Argentina Diagnostic Ultrasound Devices Volume (K) Forecast, by Application 2020 & 2033
- Table 29: Rest of South America Diagnostic Ultrasound Devices Revenue (million) Forecast, by Application 2020 & 2033
- Table 30: Rest of South America Diagnostic Ultrasound Devices Volume (K) Forecast, by Application 2020 & 2033
- Table 31: Global Diagnostic Ultrasound Devices Revenue million Forecast, by Application 2020 & 2033
- Table 32: Global Diagnostic Ultrasound Devices Volume K Forecast, by Application 2020 & 2033
- Table 33: Global Diagnostic Ultrasound Devices Revenue million Forecast, by Types 2020 & 2033
- Table 34: Global Diagnostic Ultrasound Devices Volume K Forecast, by Types 2020 & 2033
- Table 35: Global Diagnostic Ultrasound Devices Revenue million Forecast, by Country 2020 & 2033
- Table 36: Global Diagnostic Ultrasound Devices Volume K Forecast, by Country 2020 & 2033
- Table 37: United Kingdom Diagnostic Ultrasound Devices Revenue (million) Forecast, by Application 2020 & 2033
- Table 38: United Kingdom Diagnostic Ultrasound Devices Volume (K) Forecast, by Application 2020 & 2033
- Table 39: Germany Diagnostic Ultrasound Devices Revenue (million) Forecast, by Application 2020 & 2033
- Table 40: Germany Diagnostic Ultrasound Devices Volume (K) Forecast, by Application 2020 & 2033
- Table 41: France Diagnostic Ultrasound Devices Revenue (million) Forecast, by Application 2020 & 2033
- Table 42: France Diagnostic Ultrasound Devices Volume (K) Forecast, by Application 2020 & 2033
- Table 43: Italy Diagnostic Ultrasound Devices Revenue (million) Forecast, by Application 2020 & 2033
- Table 44: Italy Diagnostic Ultrasound Devices Volume (K) Forecast, by Application 2020 & 2033
- Table 45: Spain Diagnostic Ultrasound Devices Revenue (million) Forecast, by Application 2020 & 2033
- Table 46: Spain Diagnostic Ultrasound Devices Volume (K) Forecast, by Application 2020 & 2033
- Table 47: Russia Diagnostic Ultrasound Devices Revenue (million) Forecast, by Application 2020 & 2033
- Table 48: Russia Diagnostic Ultrasound Devices Volume (K) Forecast, by Application 2020 & 2033
- Table 49: Benelux Diagnostic Ultrasound Devices Revenue (million) Forecast, by Application 2020 & 2033
- Table 50: Benelux Diagnostic Ultrasound Devices Volume (K) Forecast, by Application 2020 & 2033
- Table 51: Nordics Diagnostic Ultrasound Devices Revenue (million) Forecast, by Application 2020 & 2033
- Table 52: Nordics Diagnostic Ultrasound Devices Volume (K) Forecast, by Application 2020 & 2033
- Table 53: Rest of Europe Diagnostic Ultrasound Devices Revenue (million) Forecast, by Application 2020 & 2033
- Table 54: Rest of Europe Diagnostic Ultrasound Devices Volume (K) Forecast, by Application 2020 & 2033
- Table 55: Global Diagnostic Ultrasound Devices Revenue million Forecast, by Application 2020 & 2033
- Table 56: Global Diagnostic Ultrasound Devices Volume K Forecast, by Application 2020 & 2033
- Table 57: Global Diagnostic Ultrasound Devices Revenue million Forecast, by Types 2020 & 2033
- Table 58: Global Diagnostic Ultrasound Devices Volume K Forecast, by Types 2020 & 2033
- Table 59: Global Diagnostic Ultrasound Devices Revenue million Forecast, by Country 2020 & 2033
- Table 60: Global Diagnostic Ultrasound Devices Volume K Forecast, by Country 2020 & 2033
- Table 61: Turkey Diagnostic Ultrasound Devices Revenue (million) Forecast, by Application 2020 & 2033
- Table 62: Turkey Diagnostic Ultrasound Devices Volume (K) Forecast, by Application 2020 & 2033
- Table 63: Israel Diagnostic Ultrasound Devices Revenue (million) Forecast, by Application 2020 & 2033
- Table 64: Israel Diagnostic Ultrasound Devices Volume (K) Forecast, by Application 2020 & 2033
- Table 65: GCC Diagnostic Ultrasound Devices Revenue (million) Forecast, by Application 2020 & 2033
- Table 66: GCC Diagnostic Ultrasound Devices Volume (K) Forecast, by Application 2020 & 2033
- Table 67: North Africa Diagnostic Ultrasound Devices Revenue (million) Forecast, by Application 2020 & 2033
- Table 68: North Africa Diagnostic Ultrasound Devices Volume (K) Forecast, by Application 2020 & 2033
- Table 69: South Africa Diagnostic Ultrasound Devices Revenue (million) Forecast, by Application 2020 & 2033
- Table 70: South Africa Diagnostic Ultrasound Devices Volume (K) Forecast, by Application 2020 & 2033
- Table 71: Rest of Middle East & Africa Diagnostic Ultrasound Devices Revenue (million) Forecast, by Application 2020 & 2033
- Table 72: Rest of Middle East & Africa Diagnostic Ultrasound Devices Volume (K) Forecast, by Application 2020 & 2033
- Table 73: Global Diagnostic Ultrasound Devices Revenue million Forecast, by Application 2020 & 2033
- Table 74: Global Diagnostic Ultrasound Devices Volume K Forecast, by Application 2020 & 2033
- Table 75: Global Diagnostic Ultrasound Devices Revenue million Forecast, by Types 2020 & 2033
- Table 76: Global Diagnostic Ultrasound Devices Volume K Forecast, by Types 2020 & 2033
- Table 77: Global Diagnostic Ultrasound Devices Revenue million Forecast, by Country 2020 & 2033
- Table 78: Global Diagnostic Ultrasound Devices Volume K Forecast, by Country 2020 & 2033
- Table 79: China Diagnostic Ultrasound Devices Revenue (million) Forecast, by Application 2020 & 2033
- Table 80: China Diagnostic Ultrasound Devices Volume (K) Forecast, by Application 2020 & 2033
- Table 81: India Diagnostic Ultrasound Devices Revenue (million) Forecast, by Application 2020 & 2033
- Table 82: India Diagnostic Ultrasound Devices Volume (K) Forecast, by Application 2020 & 2033
- Table 83: Japan Diagnostic Ultrasound Devices Revenue (million) Forecast, by Application 2020 & 2033
- Table 84: Japan Diagnostic Ultrasound Devices Volume (K) Forecast, by Application 2020 & 2033
- Table 85: South Korea Diagnostic Ultrasound Devices Revenue (million) Forecast, by Application 2020 & 2033
- Table 86: South Korea Diagnostic Ultrasound Devices Volume (K) Forecast, by Application 2020 & 2033
- Table 87: ASEAN Diagnostic Ultrasound Devices Revenue (million) Forecast, by Application 2020 & 2033
- Table 88: ASEAN Diagnostic Ultrasound Devices Volume (K) Forecast, by Application 2020 & 2033
- Table 89: Oceania Diagnostic Ultrasound Devices Revenue (million) Forecast, by Application 2020 & 2033
- Table 90: Oceania Diagnostic Ultrasound Devices Volume (K) Forecast, by Application 2020 & 2033
- Table 91: Rest of Asia Pacific Diagnostic Ultrasound Devices Revenue (million) Forecast, by Application 2020 & 2033
- Table 92: Rest of Asia Pacific Diagnostic Ultrasound Devices Volume (K) Forecast, by Application 2020 & 2033
Frequently Asked Questions
1. What is the projected Compound Annual Growth Rate (CAGR) of the Diagnostic Ultrasound Devices?
The projected CAGR is approximately 2.5%.
2. Which companies are prominent players in the Diagnostic Ultrasound Devices?
Key companies in the market include General Electric (GE), Philips, Siemens, TOSHIBA, Hitachi Medical, Mindray, Sonosite (FUJIFILM ), Esaote, Samsung Medison, Konica Minolta, SonoScape, LANDWIND MEDICAL, SIUI, CHISON, EDAN Instruments.
3. What are the main segments of the Diagnostic Ultrasound Devices?
The market segments include Application, Types.
4. Can you provide details about the market size?
The market size is estimated to be USD 6424.2 million as of 2022.
5. What are some drivers contributing to market growth?
N/A
6. What are the notable trends driving market growth?
N/A
7. Are there any restraints impacting market growth?
N/A
8. Can you provide examples of recent developments in the market?
N/A
9. What pricing options are available for accessing the report?
Pricing options include single-user, multi-user, and enterprise licenses priced at USD 3950.00, USD 5925.00, and USD 7900.00 respectively.
10. Is the market size provided in terms of value or volume?
The market size is provided in terms of value, measured in million and volume, measured in K.
11. Are there any specific market keywords associated with the report?
Yes, the market keyword associated with the report is "Diagnostic Ultrasound Devices," which aids in identifying and referencing the specific market segment covered.
12. How do I determine which pricing option suits my needs best?
The pricing options vary based on user requirements and access needs. Individual users may opt for single-user licenses, while businesses requiring broader access may choose multi-user or enterprise licenses for cost-effective access to the report.
13. Are there any additional resources or data provided in the Diagnostic Ultrasound Devices report?
While the report offers comprehensive insights, it's advisable to review the specific contents or supplementary materials provided to ascertain if additional resources or data are available.
14. How can I stay updated on further developments or reports in the Diagnostic Ultrasound Devices?
To stay informed about further developments, trends, and reports in the Diagnostic Ultrasound Devices, consider subscribing to industry newsletters, following relevant companies and organizations, or regularly checking reputable industry news sources and publications.
Methodology
Step 1 - Identification of Relevant Samples Size from Population Database


Step 2 - Approaches for Defining Global Market Size (Value, Volume* & Price*)

Note*: In applicable scenarios
Step 3 - Data Sources
Primary Research
- Web Analytics
- Survey Reports
- Research Institute
- Latest Research Reports
- Opinion Leaders
Secondary Research
- Annual Reports
- White Paper
- Latest Press Release
- Industry Association
- Paid Database
- Investor Presentations

Step 4 - Data Triangulation
Involves using different sources of information in order to increase the validity of a study
These sources are likely to be stakeholders in a program - participants, other researchers, program staff, other community members, and so on.
Then we put all data in single framework & apply various statistical tools to find out the dynamic on the market.
During the analysis stage, feedback from the stakeholder groups would be compared to determine areas of agreement as well as areas of divergence