

Key Insights
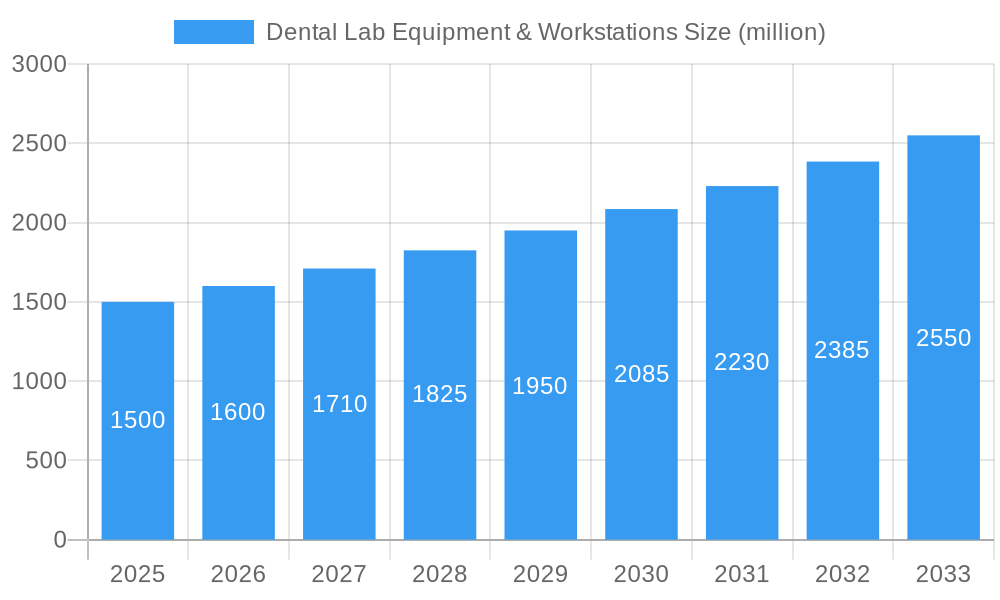
The global Dental Lab Equipment & Workstations market is poised for robust expansion, projected to reach an estimated $1,500 million in 2025 and grow at a Compound Annual Growth Rate (CAGR) of 6.5% through 2033. This substantial growth is underpinned by an increasing global demand for advanced dental prosthetics and restorative procedures, driven by an aging population, rising disposable incomes, and a growing awareness of oral healthcare importance. Technological advancements, particularly in digital dentistry such as CAD/CAM systems and 3D printing, are revolutionizing dental laboratory workflows, leading to greater efficiency, precision, and customization. The shift towards minimally invasive dentistry and the demand for aesthetic dental solutions further fuel the adoption of sophisticated equipment. Key market drivers include the increasing prevalence of dental caries, periodontal diseases, and tooth loss, necessitating a greater volume of laboratory-processed dental restorations. Furthermore, favorable reimbursement policies and insurance coverage for dental treatments in many developed nations are contributing to increased patient spending and, consequently, higher demand for dental lab products.
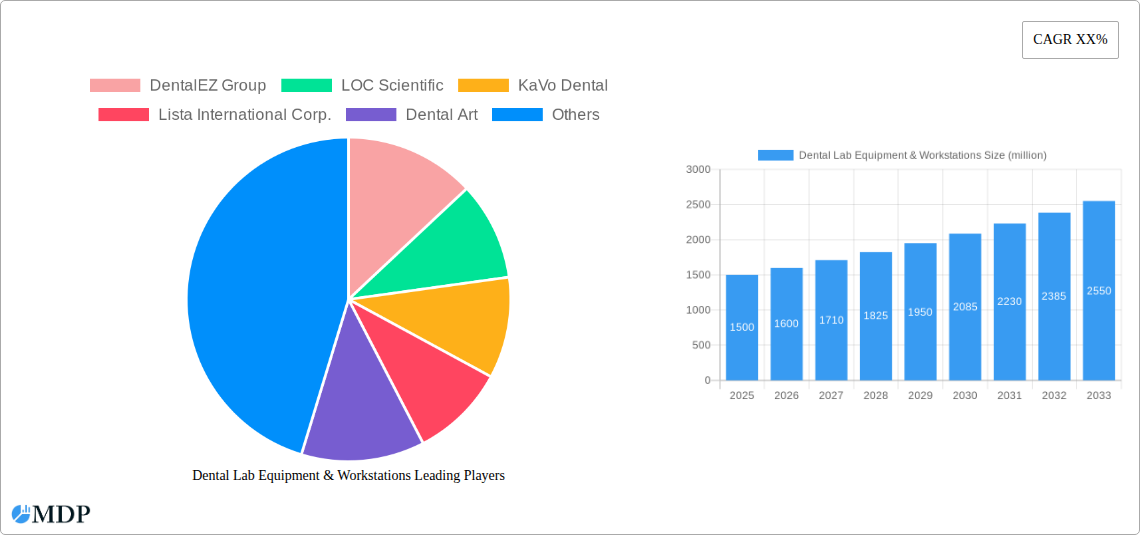
Dental Lab Equipment & Workstations Market Size (In Billion)
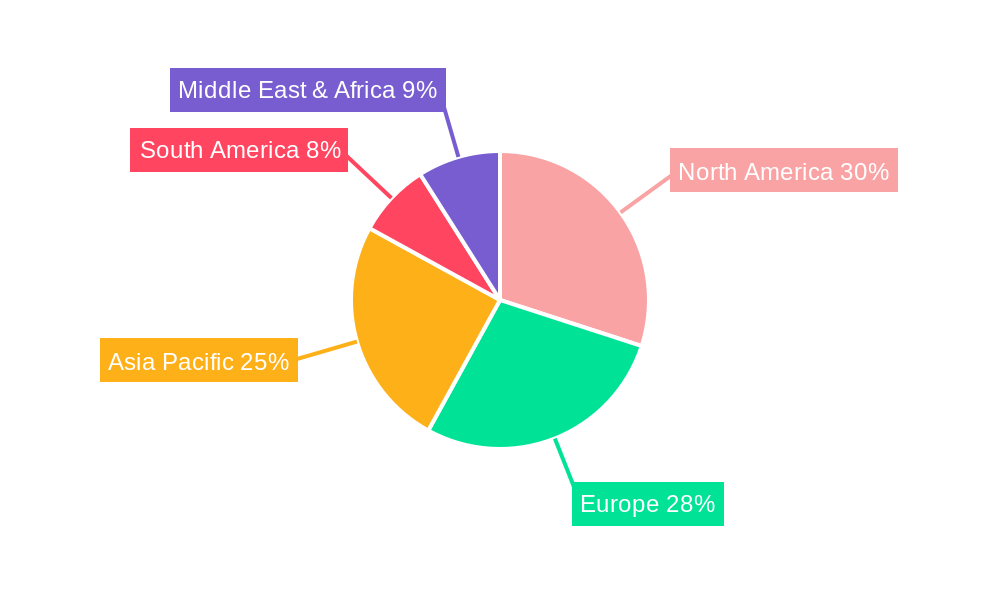
The market segmentation reveals a significant presence of hospital and clinic applications, reflecting the trend of in-house dental laboratory setups within larger healthcare facilities. Within types, single and double workstations are expected to dominate owing to their versatility and applicability across various dental laboratory tasks. Geographically, North America and Europe currently hold a substantial market share, driven by well-established healthcare infrastructure, high patient spending power, and early adoption of innovative dental technologies. However, the Asia Pacific region is anticipated to witness the fastest growth due to a burgeoning patient base, expanding dental tourism, and increasing investments in healthcare infrastructure. Restraints such as the high initial cost of advanced dental lab equipment and the need for skilled technicians to operate them could pose challenges. Nevertheless, ongoing innovation, strategic partnerships, and a growing emphasis on personalized patient care are expected to propel the Dental Lab Equipment & Workstations market forward, making it a dynamic and promising sector within the broader healthcare industry.
Dental Lab Equipment & Workstations Company Market Share
Unlocking the Future of Dental Laboratories: A Comprehensive Report on Dental Lab Equipment & Workstations
This in-depth report provides a strategic analysis of the global Dental Lab Equipment & Workstations market, valued at over $500 million in 2024. Delving into the period from 2019 to 2033, with a base year of 2025 and a forecast period of 2025-2033, this comprehensive study offers actionable insights for industry stakeholders. With a projected Compound Annual Growth Rate (CAGR) of 7.5%, the market is poised for significant expansion driven by technological advancements, increasing demand for advanced dental prosthetics, and evolving patient needs. This report meticulously dissects market dynamics, key trends, leading segments, product innovations, growth drivers, challenges, and emerging opportunities, empowering businesses to navigate this dynamic landscape and secure a competitive edge.
Dental Lab Equipment & Workstations Market Dynamics & Concentration
The Dental Lab Equipment & Workstations market exhibits a moderate concentration, with a few key players holding significant market share. Leading entities like DentalEZ Group, KaVo Dental, and Lista International Corp. dominate through robust product portfolios and extensive distribution networks. Innovation is a critical driver, fueled by the relentless pursuit of precision, efficiency, and automation in dental workflows. Advancements in digital dentistry, including CAD/CAM technology, 3D printing, and intraoral scanners, are revolutionizing lab operations. Regulatory frameworks, though evolving, primarily focus on patient safety and device efficacy, influencing product development and market entry. The increasing demand for esthetic dentistry and personalized treatment solutions are shaping end-user preferences, pushing laboratories towards sophisticated workstations and equipment. The market has witnessed strategic mergers and acquisitions, such as LOC Scientific's acquisition of a smaller specialized equipment manufacturer, aimed at expanding market reach and technological capabilities. This dynamic landscape encourages collaboration and consolidation, impacting overall market concentration and competitive intensity.
- Market Concentration: Moderate, with key players dominating a substantial portion of the market share.
- Innovation Drivers: Digital dentistry (CAD/CAM, 3D printing), automation, precision manufacturing, and material science.
- Regulatory Frameworks: Emphasis on patient safety, device validation, and compliance with international standards.
- Product Substitutes: While direct substitutes are limited, advancements in chairside dentistry and in-house lab solutions pose indirect competition.
- End-User Trends: Growing demand for esthetic restorations, digital workflows, and personalized patient care.
- M&A Activities: Strategic acquisitions and partnerships aimed at expanding product lines and market presence, with an estimated 5-10 major deals annually in the historical period.
Dental Lab Equipment & Workstations Industry Trends & Analysis
The Dental Lab Equipment & Workstations industry is experiencing robust growth, propelled by a confluence of technological advancements, increasing disposable incomes, and a rising global prevalence of dental disorders. The adoption of digital workflows, encompassing CAD/CAM systems and 3D printing technologies, is fundamentally transforming dental laboratory operations, leading to enhanced precision, faster turnaround times, and improved patient outcomes. This digital revolution necessitates investments in modern dental lab workstations and associated equipment, driving market expansion. Furthermore, the burgeoning demand for advanced dental prosthetics, such as dental implants, veneers, and crowns, particularly in emerging economies, is a significant growth catalyst. This trend is supported by increasing oral healthcare awareness and a growing preference for esthetic dental treatments. The aging global population also contributes to market growth, as older individuals are more prone to dental issues requiring restorative procedures. The competitive landscape is characterized by continuous innovation, with companies striving to offer integrated solutions that streamline laboratory processes. The CAGR of 7.5% signifies a healthy expansion, with market penetration reaching over 60% in developed regions and steadily increasing in developing nations. The shift towards personalized dentistry is also influencing product development, with manufacturers focusing on customizable workstations and versatile equipment capable of handling a wide array of restorative materials and techniques.
Leading Markets & Segments in Dental Lab Equipment & Workstations
North America currently dominates the Dental Lab Equipment & Workstations market, driven by its highly developed healthcare infrastructure, significant investment in dental research and development, and a strong emphasis on advanced dental care. The United States, in particular, represents a substantial market due to its high disposable incomes and widespread adoption of digital dentistry technologies. Within North America, clinics constitute the largest segment by application, accounting for an estimated 70% of the market share. This dominance is attributed to the growing trend of dental clinics integrating in-house laboratories or outsourcing to specialized labs equipped with advanced workstations to meet the escalating demand for faster and more efficient dental services.
Key Drivers for Dominance:
- Economic Policies: Favorable reimbursement policies for advanced dental procedures and government initiatives promoting healthcare innovation.
- Infrastructure: Well-established dental practices and laboratories with a high capacity for adopting new technologies.
- Technological Adoption: Early and widespread acceptance of digital dentistry, including CAD/CAM and 3D printing, which are intrinsically linked to sophisticated workstations.
- Consumer Demand: A high demand for esthetic and high-quality dental restorations, driving the need for precision equipment.
In terms of product types, Single Tables represent the most dominant segment, accounting for approximately 55% of the market. This is due to their versatility, cost-effectiveness for smaller practices and specialized labs, and their ability to be integrated into existing workflows. However, the demand for Double Tables is steadily increasing, driven by larger laboratories requiring increased capacity and ergonomic solutions for multiple technicians. The "Other" category, encompassing specialized workstations for specific applications like orthodontics or prosthodontics, is also experiencing significant growth, albeit from a smaller base.
Dental Lab Equipment & Workstations Product Developments
Recent product developments in the Dental Lab Equipment & Workstations sector are characterized by a strong focus on digital integration and enhanced ergonomics. Manufacturers are introducing modular and customizable workstations that seamlessly incorporate CAD/CAM units, 3D printers, and polishing stations, creating efficient, all-in-one solutions. Innovations include integrated dust extraction systems for improved safety and cleaner working environments, as well as advanced lighting solutions for enhanced visibility during intricate procedures. The competitive advantage lies in offering comprehensive, user-friendly systems that reduce manual labor, increase precision, and shorten production times for dental prosthetics.
Key Drivers of Dental Lab Equipment & Workstations Growth
The Dental Lab Equipment & Workstations market is propelled by several key drivers. Technologically, the widespread adoption of digital dentistry, including CAD/CAM and 3D printing, necessitates advanced workstations for seamless integration and operation. Economically, rising disposable incomes and increased healthcare spending globally are fueling demand for sophisticated dental treatments and, consequently, for the equipment used to produce them. Regulatory advancements that encourage innovation and patient safety also play a role. The growing prevalence of dental issues and an increasing emphasis on esthetic dentistry further amplify the need for high-quality lab equipment and efficient workstations.
Challenges in the Dental Lab Equipment & Workstations Market
Despite its growth, the Dental Lab Equipment & Workstations market faces several challenges. High initial investment costs for advanced digital equipment and workstations can be a barrier for smaller laboratories and emerging markets, impacting market penetration. Stringent regulatory approval processes for new devices can lead to extended development timelines and increased costs for manufacturers. Furthermore, the rapid pace of technological evolution requires continuous investment in upgrades and training, posing a challenge for some dental practices. Intense competition can also lead to price pressures, impacting profit margins.
Emerging Opportunities in Dental Lab Equipment & Workstations
Emerging opportunities in the Dental Lab Equipment & Workstations market are abundant, primarily driven by ongoing technological breakthroughs. The miniaturization and increased accessibility of 3D printing technology are opening new avenues for specialized dental applications and on-demand production. Strategic partnerships between equipment manufacturers and software developers are creating integrated digital ecosystems, offering comprehensive solutions for dental professionals. Market expansion into underserved regions, coupled with tailored product offerings to meet local needs and price points, presents significant growth potential. The increasing demand for personalized dental solutions, driven by patient expectations for custom-fit restorations, also offers a fertile ground for innovation.
Leading Players in the Dental Lab Equipment & Workstations Sector
- DentalEZ Group
- LOC Scientific
- KaVo Dental
- Lista International Corp.
- Dental Art
- SARATOGA
- Sinol dental
- KPF Dental
- REITEL Feinwerktechnik GmbH
- ERIO
- MULTY-DENT
- Iride International
- ZILFOR
- CATO SRL
Key Milestones in Dental Lab Equipment & Workstations Industry
- 2019: Introduction of advanced multi-material 3D printers for dental applications, enabling faster and more versatile prosthetic production.
- 2020: Major players like KaVo Dental launched integrated CAD/CAM workflow solutions, streamlining digital design and manufacturing processes.
- 2021: Significant increase in M&A activity as companies sought to expand their digital technology portfolios.
- 2022: Emergence of AI-powered design software that assists in creating more precise and patient-specific dental restorations.
- 2023: Increased focus on sustainable manufacturing practices and the development of eco-friendly lab equipment materials.
- 2024: Launch of highly ergonomic and modular workstation designs aimed at improving technician comfort and efficiency, valued at over $500 million globally.
Strategic Outlook for Dental Lab Equipment & Workstations Market
The strategic outlook for the Dental Lab Equipment & Workstations market is overwhelmingly positive, characterized by sustained growth and technological innovation. The continued integration of digital workflows, including AI and advanced robotics, will be a primary growth accelerator. Manufacturers who can offer comprehensive, user-friendly, and customizable solutions that enhance laboratory efficiency and precision will likely capture significant market share. Strategic collaborations with dental schools and research institutions will foster further innovation and adoption of new technologies. Furthermore, expanding into developing markets with adaptable and cost-effective solutions presents substantial untapped potential.
Dental Lab Equipment & Workstations Segmentation
-
1. Application
- 1.1. Hospital
- 1.2. Clinic
-
2. Types
- 2.1. Single Tables
- 2.2. Double Tables
- 2.3. Other
Dental Lab Equipment & Workstations Segmentation By Geography
-
1. North America
- 1.1. United States
- 1.2. Canada
- 1.3. Mexico
-
2. South America
- 2.1. Brazil
- 2.2. Argentina
- 2.3. Rest of South America
-
3. Europe
- 3.1. United Kingdom
- 3.2. Germany
- 3.3. France
- 3.4. Italy
- 3.5. Spain
- 3.6. Russia
- 3.7. Benelux
- 3.8. Nordics
- 3.9. Rest of Europe
-
4. Middle East & Africa
- 4.1. Turkey
- 4.2. Israel
- 4.3. GCC
- 4.4. North Africa
- 4.5. South Africa
- 4.6. Rest of Middle East & Africa
-
5. Asia Pacific
- 5.1. China
- 5.2. India
- 5.3. Japan
- 5.4. South Korea
- 5.5. ASEAN
- 5.6. Oceania
- 5.7. Rest of Asia Pacific
Dental Lab Equipment & Workstations Regional Market Share
Geographic Coverage of Dental Lab Equipment & Workstations
Dental Lab Equipment & Workstations REPORT HIGHLIGHTS
| Aspects | Details |
|---|---|
| Study Period | 2020-2034 |
| Base Year | 2025 |
| Estimated Year | 2026 |
| Forecast Period | 2026-2034 |
| Historical Period | 2020-2025 |
| Growth Rate | CAGR of 7.3% from 2020-2034 |
| Segmentation |
|
Table of Contents
- 1. Introduction
- 1.1. Research Scope
- 1.2. Market Segmentation
- 1.3. Research Objective
- 1.4. Definitions and Assumptions
- 2. Executive Summary
- 2.1. Market Snapshot
- 3. Market Dynamics
- 3.1. Market Drivers
- 3.2. Market Restrains
- 3.3. Market Trends
- 3.4. Market Opportunities
- 4. Market Factor Analysis
- 4.1. Porters Five Forces
- 4.1.1. Bargaining Power of Suppliers
- 4.1.2. Bargaining Power of Buyers
- 4.1.3. Threat of New Entrants
- 4.1.4. Threat of Substitutes
- 4.1.5. Competitive Rivalry
- 4.2. PESTEL analysis
- 4.3. BCG Analysis
- 4.3.1. Stars (High Growth, High Market Share)
- 4.3.2. Cash Cows (Low Growth, High Market Share)
- 4.3.3. Question Mark (High Growth, Low Market Share)
- 4.3.4. Dogs (Low Growth, Low Market Share)
- 4.4. Ansoff Matrix Analysis
- 4.5. Supply Chain Analysis
- 4.6. Regulatory Landscape
- 4.7. Current Market Potential and Opportunity Assessment (TAM–SAM–SOM Framework)
- 4.8. MDP Analyst Note
- 4.1. Porters Five Forces
- 5. Market Analysis, Insights and Forecast 2021-2033
- 5.1. Market Analysis, Insights and Forecast - by Application
- 5.1.1. Hospital
- 5.1.2. Clinic
- 5.2. Market Analysis, Insights and Forecast - by Types
- 5.2.1. Single Tables
- 5.2.2. Double Tables
- 5.2.3. Other
- 5.3. Market Analysis, Insights and Forecast - by Region
- 5.3.1. North America
- 5.3.2. South America
- 5.3.3. Europe
- 5.3.4. Middle East & Africa
- 5.3.5. Asia Pacific
- 5.1. Market Analysis, Insights and Forecast - by Application
- 6. Global Dental Lab Equipment & Workstations Analysis, Insights and Forecast, 2021-2033
- 6.1. Market Analysis, Insights and Forecast - by Application
- 6.1.1. Hospital
- 6.1.2. Clinic
- 6.2. Market Analysis, Insights and Forecast - by Types
- 6.2.1. Single Tables
- 6.2.2. Double Tables
- 6.2.3. Other
- 6.1. Market Analysis, Insights and Forecast - by Application
- 7. North America Dental Lab Equipment & Workstations Analysis, Insights and Forecast, 2020-2032
- 7.1. Market Analysis, Insights and Forecast - by Application
- 7.1.1. Hospital
- 7.1.2. Clinic
- 7.2. Market Analysis, Insights and Forecast - by Types
- 7.2.1. Single Tables
- 7.2.2. Double Tables
- 7.2.3. Other
- 7.1. Market Analysis, Insights and Forecast - by Application
- 8. South America Dental Lab Equipment & Workstations Analysis, Insights and Forecast, 2020-2032
- 8.1. Market Analysis, Insights and Forecast - by Application
- 8.1.1. Hospital
- 8.1.2. Clinic
- 8.2. Market Analysis, Insights and Forecast - by Types
- 8.2.1. Single Tables
- 8.2.2. Double Tables
- 8.2.3. Other
- 8.1. Market Analysis, Insights and Forecast - by Application
- 9. Europe Dental Lab Equipment & Workstations Analysis, Insights and Forecast, 2020-2032
- 9.1. Market Analysis, Insights and Forecast - by Application
- 9.1.1. Hospital
- 9.1.2. Clinic
- 9.2. Market Analysis, Insights and Forecast - by Types
- 9.2.1. Single Tables
- 9.2.2. Double Tables
- 9.2.3. Other
- 9.1. Market Analysis, Insights and Forecast - by Application
- 10. Middle East & Africa Dental Lab Equipment & Workstations Analysis, Insights and Forecast, 2020-2032
- 10.1. Market Analysis, Insights and Forecast - by Application
- 10.1.1. Hospital
- 10.1.2. Clinic
- 10.2. Market Analysis, Insights and Forecast - by Types
- 10.2.1. Single Tables
- 10.2.2. Double Tables
- 10.2.3. Other
- 10.1. Market Analysis, Insights and Forecast - by Application
- 11. Asia Pacific Dental Lab Equipment & Workstations Analysis, Insights and Forecast, 2020-2032
- 11.1. Market Analysis, Insights and Forecast - by Application
- 11.1.1. Hospital
- 11.1.2. Clinic
- 11.2. Market Analysis, Insights and Forecast - by Types
- 11.2.1. Single Tables
- 11.2.2. Double Tables
- 11.2.3. Other
- 11.1. Market Analysis, Insights and Forecast - by Application
- 12. Competitive Analysis
- 12.1. Company Profiles
- 12.1.1 DentalEZ Group
- 12.1.1.1. Company Overview
- 12.1.1.2. Products
- 12.1.1.3. Company Financials
- 12.1.1.4. SWOT Analysis
- 12.1.2 LOC Scientific
- 12.1.2.1. Company Overview
- 12.1.2.2. Products
- 12.1.2.3. Company Financials
- 12.1.2.4. SWOT Analysis
- 12.1.3 KaVo Dental
- 12.1.3.1. Company Overview
- 12.1.3.2. Products
- 12.1.3.3. Company Financials
- 12.1.3.4. SWOT Analysis
- 12.1.4 Lista International Corp.
- 12.1.4.1. Company Overview
- 12.1.4.2. Products
- 12.1.4.3. Company Financials
- 12.1.4.4. SWOT Analysis
- 12.1.5 Dental Art
- 12.1.5.1. Company Overview
- 12.1.5.2. Products
- 12.1.5.3. Company Financials
- 12.1.5.4. SWOT Analysis
- 12.1.6 SARATOGA
- 12.1.6.1. Company Overview
- 12.1.6.2. Products
- 12.1.6.3. Company Financials
- 12.1.6.4. SWOT Analysis
- 12.1.7 Sinol dental
- 12.1.7.1. Company Overview
- 12.1.7.2. Products
- 12.1.7.3. Company Financials
- 12.1.7.4. SWOT Analysis
- 12.1.8 KPF Dental
- 12.1.8.1. Company Overview
- 12.1.8.2. Products
- 12.1.8.3. Company Financials
- 12.1.8.4. SWOT Analysis
- 12.1.9 REITEL Feinwerktechnik GmbH
- 12.1.9.1. Company Overview
- 12.1.9.2. Products
- 12.1.9.3. Company Financials
- 12.1.9.4. SWOT Analysis
- 12.1.10 ERIO
- 12.1.10.1. Company Overview
- 12.1.10.2. Products
- 12.1.10.3. Company Financials
- 12.1.10.4. SWOT Analysis
- 12.1.11 MULTY-DENT
- 12.1.11.1. Company Overview
- 12.1.11.2. Products
- 12.1.11.3. Company Financials
- 12.1.11.4. SWOT Analysis
- 12.1.12 Iride International
- 12.1.12.1. Company Overview
- 12.1.12.2. Products
- 12.1.12.3. Company Financials
- 12.1.12.4. SWOT Analysis
- 12.1.13 ZILFOR
- 12.1.13.1. Company Overview
- 12.1.13.2. Products
- 12.1.13.3. Company Financials
- 12.1.13.4. SWOT Analysis
- 12.1.14 CATO SRL
- 12.1.14.1. Company Overview
- 12.1.14.2. Products
- 12.1.14.3. Company Financials
- 12.1.14.4. SWOT Analysis
- 12.1.1 DentalEZ Group
- 12.2. Market Entropy
- 12.2.1 Company's Key Areas Served
- 12.2.2 Recent Developments
- 12.3. Company Market Share Analysis 2025
- 12.3.1 Top 5 Companies Market Share Analysis
- 12.3.2 Top 3 Companies Market Share Analysis
- 12.4. List of Potential Customers
- 13. Research Methodology
List of Figures
- Figure 1: Global Dental Lab Equipment & Workstations Revenue Breakdown (undefined, %) by Region 2025 & 2033
- Figure 2: Global Dental Lab Equipment & Workstations Volume Breakdown (K, %) by Region 2025 & 2033
- Figure 3: North America Dental Lab Equipment & Workstations Revenue (undefined), by Application 2025 & 2033
- Figure 4: North America Dental Lab Equipment & Workstations Volume (K), by Application 2025 & 2033
- Figure 5: North America Dental Lab Equipment & Workstations Revenue Share (%), by Application 2025 & 2033
- Figure 6: North America Dental Lab Equipment & Workstations Volume Share (%), by Application 2025 & 2033
- Figure 7: North America Dental Lab Equipment & Workstations Revenue (undefined), by Types 2025 & 2033
- Figure 8: North America Dental Lab Equipment & Workstations Volume (K), by Types 2025 & 2033
- Figure 9: North America Dental Lab Equipment & Workstations Revenue Share (%), by Types 2025 & 2033
- Figure 10: North America Dental Lab Equipment & Workstations Volume Share (%), by Types 2025 & 2033
- Figure 11: North America Dental Lab Equipment & Workstations Revenue (undefined), by Country 2025 & 2033
- Figure 12: North America Dental Lab Equipment & Workstations Volume (K), by Country 2025 & 2033
- Figure 13: North America Dental Lab Equipment & Workstations Revenue Share (%), by Country 2025 & 2033
- Figure 14: North America Dental Lab Equipment & Workstations Volume Share (%), by Country 2025 & 2033
- Figure 15: South America Dental Lab Equipment & Workstations Revenue (undefined), by Application 2025 & 2033
- Figure 16: South America Dental Lab Equipment & Workstations Volume (K), by Application 2025 & 2033
- Figure 17: South America Dental Lab Equipment & Workstations Revenue Share (%), by Application 2025 & 2033
- Figure 18: South America Dental Lab Equipment & Workstations Volume Share (%), by Application 2025 & 2033
- Figure 19: South America Dental Lab Equipment & Workstations Revenue (undefined), by Types 2025 & 2033
- Figure 20: South America Dental Lab Equipment & Workstations Volume (K), by Types 2025 & 2033
- Figure 21: South America Dental Lab Equipment & Workstations Revenue Share (%), by Types 2025 & 2033
- Figure 22: South America Dental Lab Equipment & Workstations Volume Share (%), by Types 2025 & 2033
- Figure 23: South America Dental Lab Equipment & Workstations Revenue (undefined), by Country 2025 & 2033
- Figure 24: South America Dental Lab Equipment & Workstations Volume (K), by Country 2025 & 2033
- Figure 25: South America Dental Lab Equipment & Workstations Revenue Share (%), by Country 2025 & 2033
- Figure 26: South America Dental Lab Equipment & Workstations Volume Share (%), by Country 2025 & 2033
- Figure 27: Europe Dental Lab Equipment & Workstations Revenue (undefined), by Application 2025 & 2033
- Figure 28: Europe Dental Lab Equipment & Workstations Volume (K), by Application 2025 & 2033
- Figure 29: Europe Dental Lab Equipment & Workstations Revenue Share (%), by Application 2025 & 2033
- Figure 30: Europe Dental Lab Equipment & Workstations Volume Share (%), by Application 2025 & 2033
- Figure 31: Europe Dental Lab Equipment & Workstations Revenue (undefined), by Types 2025 & 2033
- Figure 32: Europe Dental Lab Equipment & Workstations Volume (K), by Types 2025 & 2033
- Figure 33: Europe Dental Lab Equipment & Workstations Revenue Share (%), by Types 2025 & 2033
- Figure 34: Europe Dental Lab Equipment & Workstations Volume Share (%), by Types 2025 & 2033
- Figure 35: Europe Dental Lab Equipment & Workstations Revenue (undefined), by Country 2025 & 2033
- Figure 36: Europe Dental Lab Equipment & Workstations Volume (K), by Country 2025 & 2033
- Figure 37: Europe Dental Lab Equipment & Workstations Revenue Share (%), by Country 2025 & 2033
- Figure 38: Europe Dental Lab Equipment & Workstations Volume Share (%), by Country 2025 & 2033
- Figure 39: Middle East & Africa Dental Lab Equipment & Workstations Revenue (undefined), by Application 2025 & 2033
- Figure 40: Middle East & Africa Dental Lab Equipment & Workstations Volume (K), by Application 2025 & 2033
- Figure 41: Middle East & Africa Dental Lab Equipment & Workstations Revenue Share (%), by Application 2025 & 2033
- Figure 42: Middle East & Africa Dental Lab Equipment & Workstations Volume Share (%), by Application 2025 & 2033
- Figure 43: Middle East & Africa Dental Lab Equipment & Workstations Revenue (undefined), by Types 2025 & 2033
- Figure 44: Middle East & Africa Dental Lab Equipment & Workstations Volume (K), by Types 2025 & 2033
- Figure 45: Middle East & Africa Dental Lab Equipment & Workstations Revenue Share (%), by Types 2025 & 2033
- Figure 46: Middle East & Africa Dental Lab Equipment & Workstations Volume Share (%), by Types 2025 & 2033
- Figure 47: Middle East & Africa Dental Lab Equipment & Workstations Revenue (undefined), by Country 2025 & 2033
- Figure 48: Middle East & Africa Dental Lab Equipment & Workstations Volume (K), by Country 2025 & 2033
- Figure 49: Middle East & Africa Dental Lab Equipment & Workstations Revenue Share (%), by Country 2025 & 2033
- Figure 50: Middle East & Africa Dental Lab Equipment & Workstations Volume Share (%), by Country 2025 & 2033
- Figure 51: Asia Pacific Dental Lab Equipment & Workstations Revenue (undefined), by Application 2025 & 2033
- Figure 52: Asia Pacific Dental Lab Equipment & Workstations Volume (K), by Application 2025 & 2033
- Figure 53: Asia Pacific Dental Lab Equipment & Workstations Revenue Share (%), by Application 2025 & 2033
- Figure 54: Asia Pacific Dental Lab Equipment & Workstations Volume Share (%), by Application 2025 & 2033
- Figure 55: Asia Pacific Dental Lab Equipment & Workstations Revenue (undefined), by Types 2025 & 2033
- Figure 56: Asia Pacific Dental Lab Equipment & Workstations Volume (K), by Types 2025 & 2033
- Figure 57: Asia Pacific Dental Lab Equipment & Workstations Revenue Share (%), by Types 2025 & 2033
- Figure 58: Asia Pacific Dental Lab Equipment & Workstations Volume Share (%), by Types 2025 & 2033
- Figure 59: Asia Pacific Dental Lab Equipment & Workstations Revenue (undefined), by Country 2025 & 2033
- Figure 60: Asia Pacific Dental Lab Equipment & Workstations Volume (K), by Country 2025 & 2033
- Figure 61: Asia Pacific Dental Lab Equipment & Workstations Revenue Share (%), by Country 2025 & 2033
- Figure 62: Asia Pacific Dental Lab Equipment & Workstations Volume Share (%), by Country 2025 & 2033
List of Tables
- Table 1: Global Dental Lab Equipment & Workstations Revenue undefined Forecast, by Application 2020 & 2033
- Table 2: Global Dental Lab Equipment & Workstations Volume K Forecast, by Application 2020 & 2033
- Table 3: Global Dental Lab Equipment & Workstations Revenue undefined Forecast, by Types 2020 & 2033
- Table 4: Global Dental Lab Equipment & Workstations Volume K Forecast, by Types 2020 & 2033
- Table 5: Global Dental Lab Equipment & Workstations Revenue undefined Forecast, by Region 2020 & 2033
- Table 6: Global Dental Lab Equipment & Workstations Volume K Forecast, by Region 2020 & 2033
- Table 7: Global Dental Lab Equipment & Workstations Revenue undefined Forecast, by Application 2020 & 2033
- Table 8: Global Dental Lab Equipment & Workstations Volume K Forecast, by Application 2020 & 2033
- Table 9: Global Dental Lab Equipment & Workstations Revenue undefined Forecast, by Types 2020 & 2033
- Table 10: Global Dental Lab Equipment & Workstations Volume K Forecast, by Types 2020 & 2033
- Table 11: Global Dental Lab Equipment & Workstations Revenue undefined Forecast, by Country 2020 & 2033
- Table 12: Global Dental Lab Equipment & Workstations Volume K Forecast, by Country 2020 & 2033
- Table 13: United States Dental Lab Equipment & Workstations Revenue (undefined) Forecast, by Application 2020 & 2033
- Table 14: United States Dental Lab Equipment & Workstations Volume (K) Forecast, by Application 2020 & 2033
- Table 15: Canada Dental Lab Equipment & Workstations Revenue (undefined) Forecast, by Application 2020 & 2033
- Table 16: Canada Dental Lab Equipment & Workstations Volume (K) Forecast, by Application 2020 & 2033
- Table 17: Mexico Dental Lab Equipment & Workstations Revenue (undefined) Forecast, by Application 2020 & 2033
- Table 18: Mexico Dental Lab Equipment & Workstations Volume (K) Forecast, by Application 2020 & 2033
- Table 19: Global Dental Lab Equipment & Workstations Revenue undefined Forecast, by Application 2020 & 2033
- Table 20: Global Dental Lab Equipment & Workstations Volume K Forecast, by Application 2020 & 2033
- Table 21: Global Dental Lab Equipment & Workstations Revenue undefined Forecast, by Types 2020 & 2033
- Table 22: Global Dental Lab Equipment & Workstations Volume K Forecast, by Types 2020 & 2033
- Table 23: Global Dental Lab Equipment & Workstations Revenue undefined Forecast, by Country 2020 & 2033
- Table 24: Global Dental Lab Equipment & Workstations Volume K Forecast, by Country 2020 & 2033
- Table 25: Brazil Dental Lab Equipment & Workstations Revenue (undefined) Forecast, by Application 2020 & 2033
- Table 26: Brazil Dental Lab Equipment & Workstations Volume (K) Forecast, by Application 2020 & 2033
- Table 27: Argentina Dental Lab Equipment & Workstations Revenue (undefined) Forecast, by Application 2020 & 2033
- Table 28: Argentina Dental Lab Equipment & Workstations Volume (K) Forecast, by Application 2020 & 2033
- Table 29: Rest of South America Dental Lab Equipment & Workstations Revenue (undefined) Forecast, by Application 2020 & 2033
- Table 30: Rest of South America Dental Lab Equipment & Workstations Volume (K) Forecast, by Application 2020 & 2033
- Table 31: Global Dental Lab Equipment & Workstations Revenue undefined Forecast, by Application 2020 & 2033
- Table 32: Global Dental Lab Equipment & Workstations Volume K Forecast, by Application 2020 & 2033
- Table 33: Global Dental Lab Equipment & Workstations Revenue undefined Forecast, by Types 2020 & 2033
- Table 34: Global Dental Lab Equipment & Workstations Volume K Forecast, by Types 2020 & 2033
- Table 35: Global Dental Lab Equipment & Workstations Revenue undefined Forecast, by Country 2020 & 2033
- Table 36: Global Dental Lab Equipment & Workstations Volume K Forecast, by Country 2020 & 2033
- Table 37: United Kingdom Dental Lab Equipment & Workstations Revenue (undefined) Forecast, by Application 2020 & 2033
- Table 38: United Kingdom Dental Lab Equipment & Workstations Volume (K) Forecast, by Application 2020 & 2033
- Table 39: Germany Dental Lab Equipment & Workstations Revenue (undefined) Forecast, by Application 2020 & 2033
- Table 40: Germany Dental Lab Equipment & Workstations Volume (K) Forecast, by Application 2020 & 2033
- Table 41: France Dental Lab Equipment & Workstations Revenue (undefined) Forecast, by Application 2020 & 2033
- Table 42: France Dental Lab Equipment & Workstations Volume (K) Forecast, by Application 2020 & 2033
- Table 43: Italy Dental Lab Equipment & Workstations Revenue (undefined) Forecast, by Application 2020 & 2033
- Table 44: Italy Dental Lab Equipment & Workstations Volume (K) Forecast, by Application 2020 & 2033
- Table 45: Spain Dental Lab Equipment & Workstations Revenue (undefined) Forecast, by Application 2020 & 2033
- Table 46: Spain Dental Lab Equipment & Workstations Volume (K) Forecast, by Application 2020 & 2033
- Table 47: Russia Dental Lab Equipment & Workstations Revenue (undefined) Forecast, by Application 2020 & 2033
- Table 48: Russia Dental Lab Equipment & Workstations Volume (K) Forecast, by Application 2020 & 2033
- Table 49: Benelux Dental Lab Equipment & Workstations Revenue (undefined) Forecast, by Application 2020 & 2033
- Table 50: Benelux Dental Lab Equipment & Workstations Volume (K) Forecast, by Application 2020 & 2033
- Table 51: Nordics Dental Lab Equipment & Workstations Revenue (undefined) Forecast, by Application 2020 & 2033
- Table 52: Nordics Dental Lab Equipment & Workstations Volume (K) Forecast, by Application 2020 & 2033
- Table 53: Rest of Europe Dental Lab Equipment & Workstations Revenue (undefined) Forecast, by Application 2020 & 2033
- Table 54: Rest of Europe Dental Lab Equipment & Workstations Volume (K) Forecast, by Application 2020 & 2033
- Table 55: Global Dental Lab Equipment & Workstations Revenue undefined Forecast, by Application 2020 & 2033
- Table 56: Global Dental Lab Equipment & Workstations Volume K Forecast, by Application 2020 & 2033
- Table 57: Global Dental Lab Equipment & Workstations Revenue undefined Forecast, by Types 2020 & 2033
- Table 58: Global Dental Lab Equipment & Workstations Volume K Forecast, by Types 2020 & 2033
- Table 59: Global Dental Lab Equipment & Workstations Revenue undefined Forecast, by Country 2020 & 2033
- Table 60: Global Dental Lab Equipment & Workstations Volume K Forecast, by Country 2020 & 2033
- Table 61: Turkey Dental Lab Equipment & Workstations Revenue (undefined) Forecast, by Application 2020 & 2033
- Table 62: Turkey Dental Lab Equipment & Workstations Volume (K) Forecast, by Application 2020 & 2033
- Table 63: Israel Dental Lab Equipment & Workstations Revenue (undefined) Forecast, by Application 2020 & 2033
- Table 64: Israel Dental Lab Equipment & Workstations Volume (K) Forecast, by Application 2020 & 2033
- Table 65: GCC Dental Lab Equipment & Workstations Revenue (undefined) Forecast, by Application 2020 & 2033
- Table 66: GCC Dental Lab Equipment & Workstations Volume (K) Forecast, by Application 2020 & 2033
- Table 67: North Africa Dental Lab Equipment & Workstations Revenue (undefined) Forecast, by Application 2020 & 2033
- Table 68: North Africa Dental Lab Equipment & Workstations Volume (K) Forecast, by Application 2020 & 2033
- Table 69: South Africa Dental Lab Equipment & Workstations Revenue (undefined) Forecast, by Application 2020 & 2033
- Table 70: South Africa Dental Lab Equipment & Workstations Volume (K) Forecast, by Application 2020 & 2033
- Table 71: Rest of Middle East & Africa Dental Lab Equipment & Workstations Revenue (undefined) Forecast, by Application 2020 & 2033
- Table 72: Rest of Middle East & Africa Dental Lab Equipment & Workstations Volume (K) Forecast, by Application 2020 & 2033
- Table 73: Global Dental Lab Equipment & Workstations Revenue undefined Forecast, by Application 2020 & 2033
- Table 74: Global Dental Lab Equipment & Workstations Volume K Forecast, by Application 2020 & 2033
- Table 75: Global Dental Lab Equipment & Workstations Revenue undefined Forecast, by Types 2020 & 2033
- Table 76: Global Dental Lab Equipment & Workstations Volume K Forecast, by Types 2020 & 2033
- Table 77: Global Dental Lab Equipment & Workstations Revenue undefined Forecast, by Country 2020 & 2033
- Table 78: Global Dental Lab Equipment & Workstations Volume K Forecast, by Country 2020 & 2033
- Table 79: China Dental Lab Equipment & Workstations Revenue (undefined) Forecast, by Application 2020 & 2033
- Table 80: China Dental Lab Equipment & Workstations Volume (K) Forecast, by Application 2020 & 2033
- Table 81: India Dental Lab Equipment & Workstations Revenue (undefined) Forecast, by Application 2020 & 2033
- Table 82: India Dental Lab Equipment & Workstations Volume (K) Forecast, by Application 2020 & 2033
- Table 83: Japan Dental Lab Equipment & Workstations Revenue (undefined) Forecast, by Application 2020 & 2033
- Table 84: Japan Dental Lab Equipment & Workstations Volume (K) Forecast, by Application 2020 & 2033
- Table 85: South Korea Dental Lab Equipment & Workstations Revenue (undefined) Forecast, by Application 2020 & 2033
- Table 86: South Korea Dental Lab Equipment & Workstations Volume (K) Forecast, by Application 2020 & 2033
- Table 87: ASEAN Dental Lab Equipment & Workstations Revenue (undefined) Forecast, by Application 2020 & 2033
- Table 88: ASEAN Dental Lab Equipment & Workstations Volume (K) Forecast, by Application 2020 & 2033
- Table 89: Oceania Dental Lab Equipment & Workstations Revenue (undefined) Forecast, by Application 2020 & 2033
- Table 90: Oceania Dental Lab Equipment & Workstations Volume (K) Forecast, by Application 2020 & 2033
- Table 91: Rest of Asia Pacific Dental Lab Equipment & Workstations Revenue (undefined) Forecast, by Application 2020 & 2033
- Table 92: Rest of Asia Pacific Dental Lab Equipment & Workstations Volume (K) Forecast, by Application 2020 & 2033
Frequently Asked Questions
1. What is the projected Compound Annual Growth Rate (CAGR) of the Dental Lab Equipment & Workstations?
The projected CAGR is approximately 7.3%.
2. Which companies are prominent players in the Dental Lab Equipment & Workstations?
Key companies in the market include DentalEZ Group, LOC Scientific, KaVo Dental, Lista International Corp., Dental Art, SARATOGA, Sinol dental, KPF Dental, REITEL Feinwerktechnik GmbH, ERIO, MULTY-DENT, Iride International, ZILFOR, CATO SRL.
3. What are the main segments of the Dental Lab Equipment & Workstations?
The market segments include Application, Types.
4. Can you provide details about the market size?
The market size is estimated to be USD XXX N/A as of 2022.
5. What are some drivers contributing to market growth?
N/A
6. What are the notable trends driving market growth?
N/A
7. Are there any restraints impacting market growth?
N/A
8. Can you provide examples of recent developments in the market?
N/A
9. What pricing options are available for accessing the report?
Pricing options include single-user, multi-user, and enterprise licenses priced at USD 3950.00, USD 5925.00, and USD 7900.00 respectively.
10. Is the market size provided in terms of value or volume?
The market size is provided in terms of value, measured in N/A and volume, measured in K.
11. Are there any specific market keywords associated with the report?
Yes, the market keyword associated with the report is "Dental Lab Equipment & Workstations," which aids in identifying and referencing the specific market segment covered.
12. How do I determine which pricing option suits my needs best?
The pricing options vary based on user requirements and access needs. Individual users may opt for single-user licenses, while businesses requiring broader access may choose multi-user or enterprise licenses for cost-effective access to the report.
13. Are there any additional resources or data provided in the Dental Lab Equipment & Workstations report?
While the report offers comprehensive insights, it's advisable to review the specific contents or supplementary materials provided to ascertain if additional resources or data are available.
14. How can I stay updated on further developments or reports in the Dental Lab Equipment & Workstations?
To stay informed about further developments, trends, and reports in the Dental Lab Equipment & Workstations, consider subscribing to industry newsletters, following relevant companies and organizations, or regularly checking reputable industry news sources and publications.
Methodology
Step 1 - Identification of Relevant Samples Size from Population Database


Step 2 - Approaches for Defining Global Market Size (Value, Volume* & Price*)

Note*: In applicable scenarios
Step 3 - Data Sources
Primary Research
- Web Analytics
- Survey Reports
- Research Institute
- Latest Research Reports
- Opinion Leaders
Secondary Research
- Annual Reports
- White Paper
- Latest Press Release
- Industry Association
- Paid Database
- Investor Presentations

Step 4 - Data Triangulation
Involves using different sources of information in order to increase the validity of a study
These sources are likely to be stakeholders in a program - participants, other researchers, program staff, other community members, and so on.
Then we put all data in single framework & apply various statistical tools to find out the dynamic on the market.
During the analysis stage, feedback from the stakeholder groups would be compared to determine areas of agreement as well as areas of divergence