

Key Insights
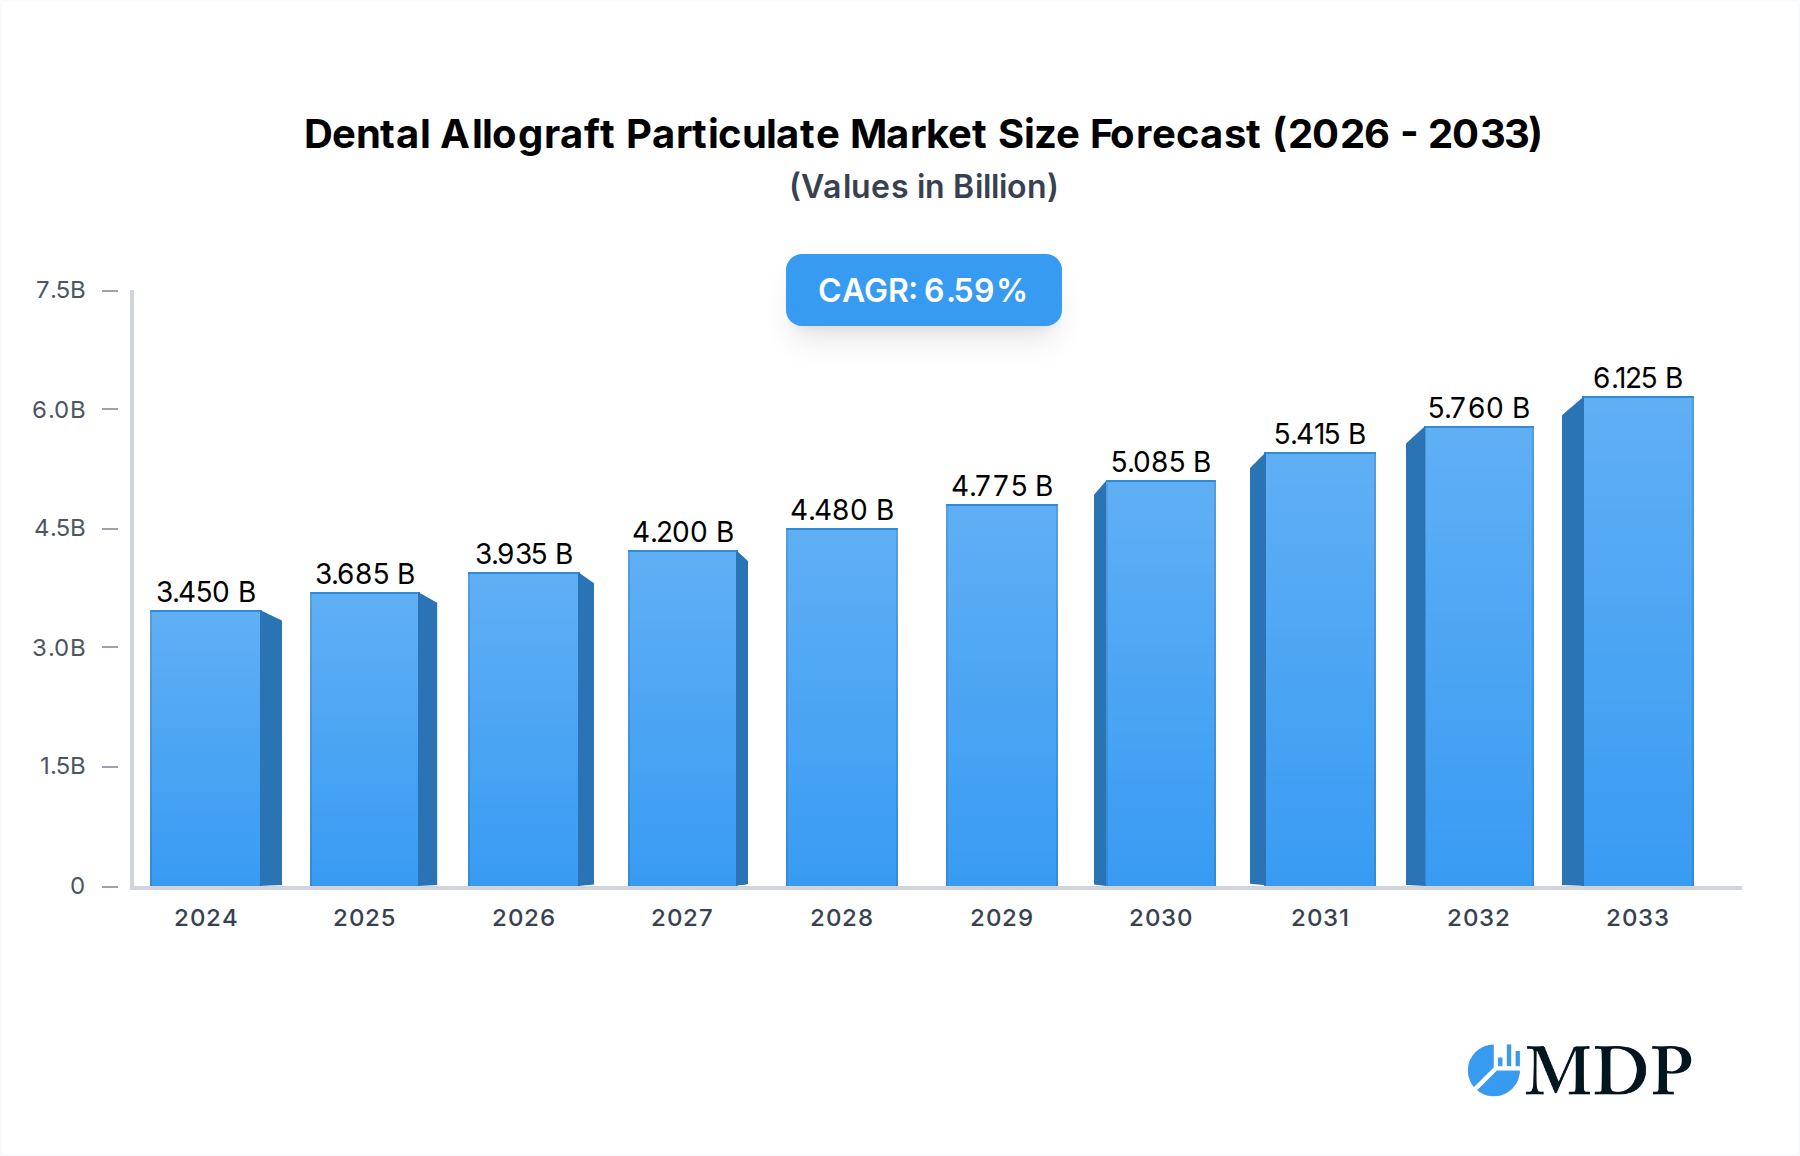
The global dental allograft particulate market is projected for significant growth, driven by the rising incidence of periodontal disease and the increasing demand for dental implant procedures. Advancements in allograft processing technologies are enhancing efficacy and minimizing transplantation risks, further fueling market expansion. The growing preference for minimally invasive treatments and the widespread adoption of regenerative dentistry are key contributing factors. Leading companies are actively investing in research and development to deliver innovative products with superior biocompatibility and osteoconductivity, fostering a competitive environment that stimulates market growth and product diversification. The market is segmented by type (bone, cortical, cancellous), application (bone grafting, ridge augmentation), and end-user (dental clinics, hospitals). The global dental allograft particulate market is estimated to be worth $3.16 billion in the base year 2024, with a projected Compound Annual Growth Rate (CAGR) of 6.6% for the forecast period.

Dental Allograft Particulate Market Size (In Billion)
The forecast period (2025-2033) anticipates sustained market expansion, influenced by an aging global population, heightened oral health awareness, and technological innovations that streamline and enhance allograft applications. Key challenges include the high cost of allograft materials and potential disease transmission risks. Continued innovation in cost-effective manufacturing and robust regulatory adherence are crucial for overcoming these restraints. Geographically, North America and Europe currently lead the market, supported by advanced healthcare infrastructure and high dental implant adoption rates. However, emerging economies in the Asia-Pacific region are expected to exhibit substantial growth as healthcare infrastructure improves and dental health awareness rises, leading to a redistribution of market share.
Dental Allograft Particulate Company Market Share
Dental Allograft Particulate Market Report: 2019-2033
Dive deep into the dynamic world of Dental Allograft Particulate with this comprehensive market analysis, projecting a market value exceeding $XX million by 2033. This in-depth report provides actionable insights for stakeholders across the dental industry, covering market dynamics, leading players, technological advancements, and future growth opportunities. The report covers the period 2019-2033, with a focus on the estimated year 2025.
Dental Allograft Particulate Market Dynamics & Concentration
This section analyzes the competitive landscape of the Dental Allograft Particulate market, examining market concentration, innovation drivers, regulatory influences, and market dynamics. The global market size is estimated at $XX million in 2025, projected to reach $XX million by 2033, exhibiting a CAGR of XX%. Market concentration is moderately high, with the top five players holding approximately XX% market share in 2025.
- Innovation Drivers: Ongoing research into novel biomaterials and processing techniques is driving innovation, leading to improved product efficacy and safety.
- Regulatory Frameworks: Stringent regulatory approvals and quality control measures are crucial aspects influencing market growth and product development. Changes in these frameworks directly impact market access and expansion.
- Product Substitutes: Competition exists from synthetic bone graft substitutes, although allografts maintain advantages in certain applications.
- End-User Trends: Increasing demand for minimally invasive procedures and predictable outcomes are driving adoption of Dental Allograft Particulate.
- M&A Activities: The number of M&A deals in the sector during the historical period (2019-2024) totaled approximately XX, indicating a moderate level of consolidation. This consolidation is expected to continue as larger companies seek to expand their product portfolios and market reach.
Dental Allograft Particulate Industry Trends & Analysis
The Dental Allograft Particulate market is experiencing significant growth driven by several key factors. The increasing prevalence of periodontal diseases and the growing demand for advanced dental procedures are major market drivers. Technological advancements, such as improved processing techniques leading to better product consistency and efficacy, are further boosting market growth.
The market is witnessing a rising preference for minimally invasive procedures and a focus on patient-specific solutions, driving demand for high-quality allografts. The market is characterized by intense competition among established players and emerging companies, leading to continuous innovation and product differentiation. Consumer preferences are increasingly influenced by the safety, efficacy, and ease of use of the product. The competitive landscape is shaping market dynamics, driving pricing strategies and influencing adoption rates. The CAGR during the forecast period (2025-2033) is estimated at XX%, with market penetration projected to reach XX% by 2033.
Leading Markets & Segments in Dental Allograft Particulate
The North American market holds the largest share of the Dental Allograft Particulate market, driven by factors such as high healthcare expenditure, advanced healthcare infrastructure, and a significant aging population. Other key markets include Europe and Asia-Pacific, which are exhibiting significant growth potential fueled by increasing awareness of dental health and rising disposable incomes.
Key Drivers for North American Dominance:
- High per capita healthcare expenditure.
- Well-developed dental infrastructure.
- Large geriatric population with higher prevalence of dental issues.
- Strong regulatory support for advanced dental procedures.
Other Key Market Drivers:
- Rising disposable incomes in developing economies (Asia-Pacific).
- Increased awareness of dental health and preventative care.
- Expanding dental tourism in certain regions.
The market is segmented based on product type (e.g., particulate, putty, etc.), application (e.g., bone grafting, ridge augmentation), and end-user (e.g., hospitals, dental clinics). While specific segment dominance requires further detailed analysis, initial findings suggest that the particulate segment holds a significant share due to its versatility and applicability in numerous procedures.
Dental Allograft Particulate Product Developments
Recent product innovations have focused on enhancing the handling characteristics and osteoinductive properties of Dental Allograft Particulate. Manufacturers are incorporating advanced processing techniques to improve product consistency and reduce the risk of disease transmission. This includes the development of new formulations optimized for specific clinical applications and better integration with the host bone. These advancements are improving both clinical outcomes and the overall patient experience.
Key Drivers of Dental Allograft Particulate Growth
The growth of the Dental Allograft Particulate market is primarily driven by a combination of factors: the rising prevalence of periodontal diseases and the aging population are significantly increasing demand for bone grafting procedures. Technological advancements, such as improved processing techniques and novel biomaterials, are enhancing the efficacy and safety of allografts. Furthermore, supportive regulatory frameworks in key markets are accelerating market expansion.
Challenges in the Dental Allograft Particulate Market
Challenges include stringent regulatory pathways which increase the time and cost associated with product development and approval, leading to a slower market entry. Supply chain complexities in sourcing and processing allograft material also pose challenges. Lastly, price competition from synthetic bone graft substitutes creates pressure on profit margins. These challenges combine to limit the market's expansion potential.
Emerging Opportunities in Dental Allograft Particulate
Emerging opportunities stem from the development of novel biomaterials with enhanced osteoinductivity and improved handling characteristics. Strategic partnerships between allograft manufacturers and dental technology companies can leverage expertise and resources to accelerate the development and commercialization of innovative products. Expansion into emerging markets presents considerable growth potential.
Leading Players in the Dental Allograft Particulate Sector
- Biohorizons
- BoneEasy
- Botiss Biomaterials GmbH
- Cowellmedi
- Zimmer Biomet
- Kyeron
- RTI Surgical
- Wright Medical
- PuraGraft
Key Milestones in Dental Allograft Particulate Industry
- 2020: Introduction of a novel processing technique by Company X resulting in improved product consistency.
- 2021: Regulatory approval of a new allograft product in a major market by Company Y.
- 2022: Strategic partnership between Company A and Company B for joint product development.
- 2023: Acquisition of Company C by a large multinational corporation.
- 2024: Launch of a new line of allografts with enhanced osteoinductive properties by Company D. (Note: Specific company names and details may need to be replaced with actual data.)
Strategic Outlook for Dental Allograft Particulate Market
The Dental Allograft Particulate market presents substantial long-term growth opportunities. Continued technological advancements, expanding applications, and strategic partnerships are expected to drive significant market expansion. Companies that effectively navigate regulatory hurdles and focus on product innovation and market penetration are well-positioned for long-term success in this dynamic market.
Dental Allograft Particulate Segmentation
-
1. Application
- 1.1. Hospital
- 1.2. Clinics
-
2. Types
- 2.1. Cortical Particulate
- 2.2. Cancellous Particulate
- 2.3. Cortico-Cancellous Particulate
Dental Allograft Particulate Segmentation By Geography
-
1. North America
- 1.1. United States
- 1.2. Canada
- 1.3. Mexico
-
2. South America
- 2.1. Brazil
- 2.2. Argentina
- 2.3. Rest of South America
-
3. Europe
- 3.1. United Kingdom
- 3.2. Germany
- 3.3. France
- 3.4. Italy
- 3.5. Spain
- 3.6. Russia
- 3.7. Benelux
- 3.8. Nordics
- 3.9. Rest of Europe
-
4. Middle East & Africa
- 4.1. Turkey
- 4.2. Israel
- 4.3. GCC
- 4.4. North Africa
- 4.5. South Africa
- 4.6. Rest of Middle East & Africa
-
5. Asia Pacific
- 5.1. China
- 5.2. India
- 5.3. Japan
- 5.4. South Korea
- 5.5. ASEAN
- 5.6. Oceania
- 5.7. Rest of Asia Pacific
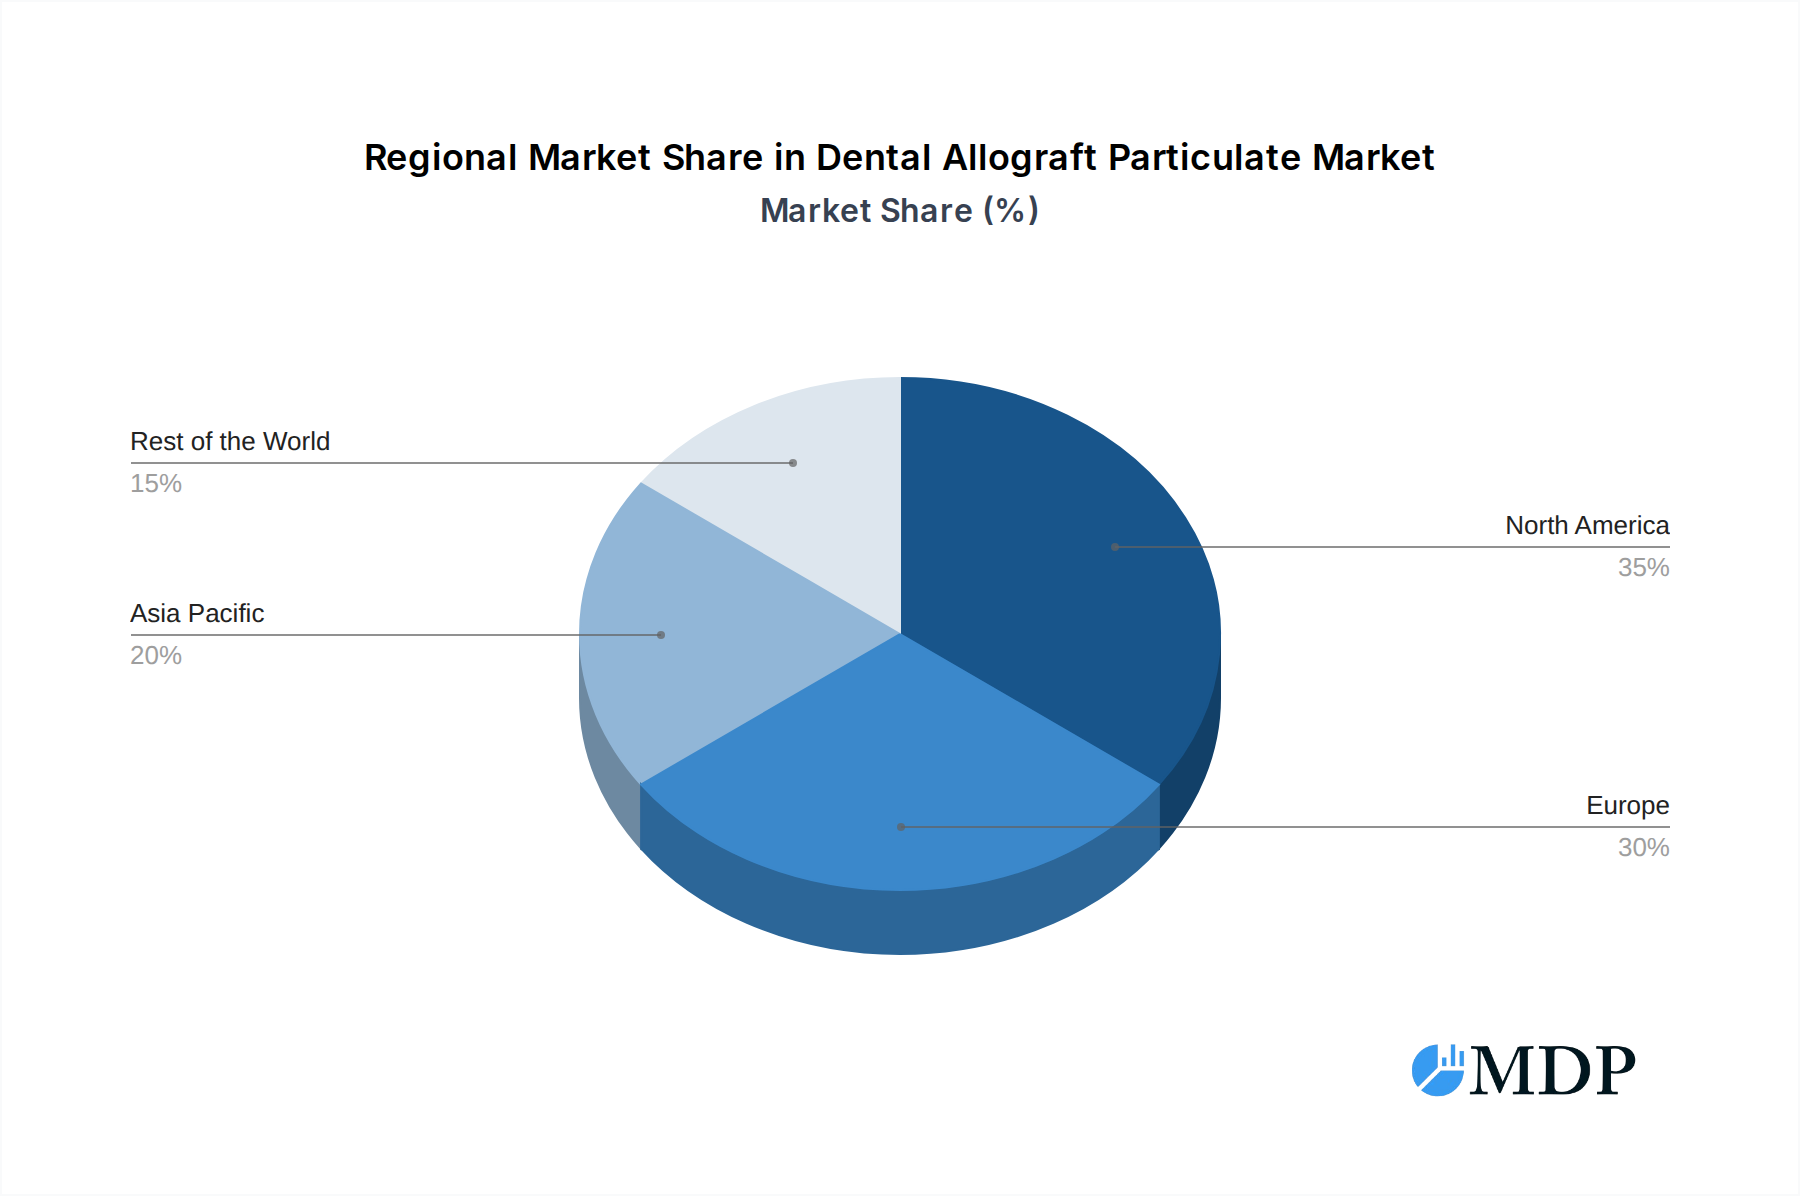
Dental Allograft Particulate Regional Market Share
Geographic Coverage of Dental Allograft Particulate
Dental Allograft Particulate REPORT HIGHLIGHTS
| Aspects | Details |
|---|---|
| Study Period | 2020-2034 |
| Base Year | 2025 |
| Estimated Year | 2026 |
| Forecast Period | 2026-2034 |
| Historical Period | 2020-2025 |
| Growth Rate | CAGR of 6.6% from 2020-2034 |
| Segmentation |
|
Table of Contents
- 1. Introduction
- 1.1. Research Scope
- 1.2. Market Segmentation
- 1.3. Research Objective
- 1.4. Definitions and Assumptions
- 2. Executive Summary
- 2.1. Market Snapshot
- 3. Market Dynamics
- 3.1. Market Drivers
- 3.2. Market Restrains
- 3.3. Market Trends
- 3.4. Market Opportunities
- 4. Market Factor Analysis
- 4.1. Porters Five Forces
- 4.1.1. Bargaining Power of Suppliers
- 4.1.2. Bargaining Power of Buyers
- 4.1.3. Threat of New Entrants
- 4.1.4. Threat of Substitutes
- 4.1.5. Competitive Rivalry
- 4.2. PESTEL analysis
- 4.3. BCG Analysis
- 4.3.1. Stars (High Growth, High Market Share)
- 4.3.2. Cash Cows (Low Growth, High Market Share)
- 4.3.3. Question Mark (High Growth, Low Market Share)
- 4.3.4. Dogs (Low Growth, Low Market Share)
- 4.4. Ansoff Matrix Analysis
- 4.5. Supply Chain Analysis
- 4.6. Regulatory Landscape
- 4.7. Current Market Potential and Opportunity Assessment (TAM–SAM–SOM Framework)
- 4.8. MDP Analyst Note
- 4.1. Porters Five Forces
- 5. Market Analysis, Insights and Forecast 2021-2033
- 5.1. Market Analysis, Insights and Forecast - by Application
- 5.1.1. Hospital
- 5.1.2. Clinics
- 5.2. Market Analysis, Insights and Forecast - by Types
- 5.2.1. Cortical Particulate
- 5.2.2. Cancellous Particulate
- 5.2.3. Cortico-Cancellous Particulate
- 5.3. Market Analysis, Insights and Forecast - by Region
- 5.3.1. North America
- 5.3.2. South America
- 5.3.3. Europe
- 5.3.4. Middle East & Africa
- 5.3.5. Asia Pacific
- 5.1. Market Analysis, Insights and Forecast - by Application
- 6. Global Dental Allograft Particulate Analysis, Insights and Forecast, 2021-2033
- 6.1. Market Analysis, Insights and Forecast - by Application
- 6.1.1. Hospital
- 6.1.2. Clinics
- 6.2. Market Analysis, Insights and Forecast - by Types
- 6.2.1. Cortical Particulate
- 6.2.2. Cancellous Particulate
- 6.2.3. Cortico-Cancellous Particulate
- 6.1. Market Analysis, Insights and Forecast - by Application
- 7. North America Dental Allograft Particulate Analysis, Insights and Forecast, 2020-2032
- 7.1. Market Analysis, Insights and Forecast - by Application
- 7.1.1. Hospital
- 7.1.2. Clinics
- 7.2. Market Analysis, Insights and Forecast - by Types
- 7.2.1. Cortical Particulate
- 7.2.2. Cancellous Particulate
- 7.2.3. Cortico-Cancellous Particulate
- 7.1. Market Analysis, Insights and Forecast - by Application
- 8. South America Dental Allograft Particulate Analysis, Insights and Forecast, 2020-2032
- 8.1. Market Analysis, Insights and Forecast - by Application
- 8.1.1. Hospital
- 8.1.2. Clinics
- 8.2. Market Analysis, Insights and Forecast - by Types
- 8.2.1. Cortical Particulate
- 8.2.2. Cancellous Particulate
- 8.2.3. Cortico-Cancellous Particulate
- 8.1. Market Analysis, Insights and Forecast - by Application
- 9. Europe Dental Allograft Particulate Analysis, Insights and Forecast, 2020-2032
- 9.1. Market Analysis, Insights and Forecast - by Application
- 9.1.1. Hospital
- 9.1.2. Clinics
- 9.2. Market Analysis, Insights and Forecast - by Types
- 9.2.1. Cortical Particulate
- 9.2.2. Cancellous Particulate
- 9.2.3. Cortico-Cancellous Particulate
- 9.1. Market Analysis, Insights and Forecast - by Application
- 10. Middle East & Africa Dental Allograft Particulate Analysis, Insights and Forecast, 2020-2032
- 10.1. Market Analysis, Insights and Forecast - by Application
- 10.1.1. Hospital
- 10.1.2. Clinics
- 10.2. Market Analysis, Insights and Forecast - by Types
- 10.2.1. Cortical Particulate
- 10.2.2. Cancellous Particulate
- 10.2.3. Cortico-Cancellous Particulate
- 10.1. Market Analysis, Insights and Forecast - by Application
- 11. Asia Pacific Dental Allograft Particulate Analysis, Insights and Forecast, 2020-2032
- 11.1. Market Analysis, Insights and Forecast - by Application
- 11.1.1. Hospital
- 11.1.2. Clinics
- 11.2. Market Analysis, Insights and Forecast - by Types
- 11.2.1. Cortical Particulate
- 11.2.2. Cancellous Particulate
- 11.2.3. Cortico-Cancellous Particulate
- 11.1. Market Analysis, Insights and Forecast - by Application
- 12. Competitive Analysis
- 12.1. Company Profiles
- 12.1.1 Biohorizons
- 12.1.1.1. Company Overview
- 12.1.1.2. Products
- 12.1.1.3. Company Financials
- 12.1.1.4. SWOT Analysis
- 12.1.2 BoneEasy
- 12.1.2.1. Company Overview
- 12.1.2.2. Products
- 12.1.2.3. Company Financials
- 12.1.2.4. SWOT Analysis
- 12.1.3 Botiss Biomaterials GmbH
- 12.1.3.1. Company Overview
- 12.1.3.2. Products
- 12.1.3.3. Company Financials
- 12.1.3.4. SWOT Analysis
- 12.1.4 Cowellmedi
- 12.1.4.1. Company Overview
- 12.1.4.2. Products
- 12.1.4.3. Company Financials
- 12.1.4.4. SWOT Analysis
- 12.1.5 Zimmer Biomet
- 12.1.5.1. Company Overview
- 12.1.5.2. Products
- 12.1.5.3. Company Financials
- 12.1.5.4. SWOT Analysis
- 12.1.6 Kyeron
- 12.1.6.1. Company Overview
- 12.1.6.2. Products
- 12.1.6.3. Company Financials
- 12.1.6.4. SWOT Analysis
- 12.1.7 RTI Surgical
- 12.1.7.1. Company Overview
- 12.1.7.2. Products
- 12.1.7.3. Company Financials
- 12.1.7.4. SWOT Analysis
- 12.1.8 Wright Medical
- 12.1.8.1. Company Overview
- 12.1.8.2. Products
- 12.1.8.3. Company Financials
- 12.1.8.4. SWOT Analysis
- 12.1.9 PuraGraft
- 12.1.9.1. Company Overview
- 12.1.9.2. Products
- 12.1.9.3. Company Financials
- 12.1.9.4. SWOT Analysis
- 12.1.1 Biohorizons
- 12.2. Market Entropy
- 12.2.1 Company's Key Areas Served
- 12.2.2 Recent Developments
- 12.3. Company Market Share Analysis 2025
- 12.3.1 Top 5 Companies Market Share Analysis
- 12.3.2 Top 3 Companies Market Share Analysis
- 12.4. List of Potential Customers
- 13. Research Methodology
List of Figures
- Figure 1: Global Dental Allograft Particulate Revenue Breakdown (billion, %) by Region 2025 & 2033
- Figure 2: Global Dental Allograft Particulate Volume Breakdown (K, %) by Region 2025 & 2033
- Figure 3: North America Dental Allograft Particulate Revenue (billion), by Application 2025 & 2033
- Figure 4: North America Dental Allograft Particulate Volume (K), by Application 2025 & 2033
- Figure 5: North America Dental Allograft Particulate Revenue Share (%), by Application 2025 & 2033
- Figure 6: North America Dental Allograft Particulate Volume Share (%), by Application 2025 & 2033
- Figure 7: North America Dental Allograft Particulate Revenue (billion), by Types 2025 & 2033
- Figure 8: North America Dental Allograft Particulate Volume (K), by Types 2025 & 2033
- Figure 9: North America Dental Allograft Particulate Revenue Share (%), by Types 2025 & 2033
- Figure 10: North America Dental Allograft Particulate Volume Share (%), by Types 2025 & 2033
- Figure 11: North America Dental Allograft Particulate Revenue (billion), by Country 2025 & 2033
- Figure 12: North America Dental Allograft Particulate Volume (K), by Country 2025 & 2033
- Figure 13: North America Dental Allograft Particulate Revenue Share (%), by Country 2025 & 2033
- Figure 14: North America Dental Allograft Particulate Volume Share (%), by Country 2025 & 2033
- Figure 15: South America Dental Allograft Particulate Revenue (billion), by Application 2025 & 2033
- Figure 16: South America Dental Allograft Particulate Volume (K), by Application 2025 & 2033
- Figure 17: South America Dental Allograft Particulate Revenue Share (%), by Application 2025 & 2033
- Figure 18: South America Dental Allograft Particulate Volume Share (%), by Application 2025 & 2033
- Figure 19: South America Dental Allograft Particulate Revenue (billion), by Types 2025 & 2033
- Figure 20: South America Dental Allograft Particulate Volume (K), by Types 2025 & 2033
- Figure 21: South America Dental Allograft Particulate Revenue Share (%), by Types 2025 & 2033
- Figure 22: South America Dental Allograft Particulate Volume Share (%), by Types 2025 & 2033
- Figure 23: South America Dental Allograft Particulate Revenue (billion), by Country 2025 & 2033
- Figure 24: South America Dental Allograft Particulate Volume (K), by Country 2025 & 2033
- Figure 25: South America Dental Allograft Particulate Revenue Share (%), by Country 2025 & 2033
- Figure 26: South America Dental Allograft Particulate Volume Share (%), by Country 2025 & 2033
- Figure 27: Europe Dental Allograft Particulate Revenue (billion), by Application 2025 & 2033
- Figure 28: Europe Dental Allograft Particulate Volume (K), by Application 2025 & 2033
- Figure 29: Europe Dental Allograft Particulate Revenue Share (%), by Application 2025 & 2033
- Figure 30: Europe Dental Allograft Particulate Volume Share (%), by Application 2025 & 2033
- Figure 31: Europe Dental Allograft Particulate Revenue (billion), by Types 2025 & 2033
- Figure 32: Europe Dental Allograft Particulate Volume (K), by Types 2025 & 2033
- Figure 33: Europe Dental Allograft Particulate Revenue Share (%), by Types 2025 & 2033
- Figure 34: Europe Dental Allograft Particulate Volume Share (%), by Types 2025 & 2033
- Figure 35: Europe Dental Allograft Particulate Revenue (billion), by Country 2025 & 2033
- Figure 36: Europe Dental Allograft Particulate Volume (K), by Country 2025 & 2033
- Figure 37: Europe Dental Allograft Particulate Revenue Share (%), by Country 2025 & 2033
- Figure 38: Europe Dental Allograft Particulate Volume Share (%), by Country 2025 & 2033
- Figure 39: Middle East & Africa Dental Allograft Particulate Revenue (billion), by Application 2025 & 2033
- Figure 40: Middle East & Africa Dental Allograft Particulate Volume (K), by Application 2025 & 2033
- Figure 41: Middle East & Africa Dental Allograft Particulate Revenue Share (%), by Application 2025 & 2033
- Figure 42: Middle East & Africa Dental Allograft Particulate Volume Share (%), by Application 2025 & 2033
- Figure 43: Middle East & Africa Dental Allograft Particulate Revenue (billion), by Types 2025 & 2033
- Figure 44: Middle East & Africa Dental Allograft Particulate Volume (K), by Types 2025 & 2033
- Figure 45: Middle East & Africa Dental Allograft Particulate Revenue Share (%), by Types 2025 & 2033
- Figure 46: Middle East & Africa Dental Allograft Particulate Volume Share (%), by Types 2025 & 2033
- Figure 47: Middle East & Africa Dental Allograft Particulate Revenue (billion), by Country 2025 & 2033
- Figure 48: Middle East & Africa Dental Allograft Particulate Volume (K), by Country 2025 & 2033
- Figure 49: Middle East & Africa Dental Allograft Particulate Revenue Share (%), by Country 2025 & 2033
- Figure 50: Middle East & Africa Dental Allograft Particulate Volume Share (%), by Country 2025 & 2033
- Figure 51: Asia Pacific Dental Allograft Particulate Revenue (billion), by Application 2025 & 2033
- Figure 52: Asia Pacific Dental Allograft Particulate Volume (K), by Application 2025 & 2033
- Figure 53: Asia Pacific Dental Allograft Particulate Revenue Share (%), by Application 2025 & 2033
- Figure 54: Asia Pacific Dental Allograft Particulate Volume Share (%), by Application 2025 & 2033
- Figure 55: Asia Pacific Dental Allograft Particulate Revenue (billion), by Types 2025 & 2033
- Figure 56: Asia Pacific Dental Allograft Particulate Volume (K), by Types 2025 & 2033
- Figure 57: Asia Pacific Dental Allograft Particulate Revenue Share (%), by Types 2025 & 2033
- Figure 58: Asia Pacific Dental Allograft Particulate Volume Share (%), by Types 2025 & 2033
- Figure 59: Asia Pacific Dental Allograft Particulate Revenue (billion), by Country 2025 & 2033
- Figure 60: Asia Pacific Dental Allograft Particulate Volume (K), by Country 2025 & 2033
- Figure 61: Asia Pacific Dental Allograft Particulate Revenue Share (%), by Country 2025 & 2033
- Figure 62: Asia Pacific Dental Allograft Particulate Volume Share (%), by Country 2025 & 2033
List of Tables
- Table 1: Global Dental Allograft Particulate Revenue billion Forecast, by Application 2020 & 2033
- Table 2: Global Dental Allograft Particulate Volume K Forecast, by Application 2020 & 2033
- Table 3: Global Dental Allograft Particulate Revenue billion Forecast, by Types 2020 & 2033
- Table 4: Global Dental Allograft Particulate Volume K Forecast, by Types 2020 & 2033
- Table 5: Global Dental Allograft Particulate Revenue billion Forecast, by Region 2020 & 2033
- Table 6: Global Dental Allograft Particulate Volume K Forecast, by Region 2020 & 2033
- Table 7: Global Dental Allograft Particulate Revenue billion Forecast, by Application 2020 & 2033
- Table 8: Global Dental Allograft Particulate Volume K Forecast, by Application 2020 & 2033
- Table 9: Global Dental Allograft Particulate Revenue billion Forecast, by Types 2020 & 2033
- Table 10: Global Dental Allograft Particulate Volume K Forecast, by Types 2020 & 2033
- Table 11: Global Dental Allograft Particulate Revenue billion Forecast, by Country 2020 & 2033
- Table 12: Global Dental Allograft Particulate Volume K Forecast, by Country 2020 & 2033
- Table 13: United States Dental Allograft Particulate Revenue (billion) Forecast, by Application 2020 & 2033
- Table 14: United States Dental Allograft Particulate Volume (K) Forecast, by Application 2020 & 2033
- Table 15: Canada Dental Allograft Particulate Revenue (billion) Forecast, by Application 2020 & 2033
- Table 16: Canada Dental Allograft Particulate Volume (K) Forecast, by Application 2020 & 2033
- Table 17: Mexico Dental Allograft Particulate Revenue (billion) Forecast, by Application 2020 & 2033
- Table 18: Mexico Dental Allograft Particulate Volume (K) Forecast, by Application 2020 & 2033
- Table 19: Global Dental Allograft Particulate Revenue billion Forecast, by Application 2020 & 2033
- Table 20: Global Dental Allograft Particulate Volume K Forecast, by Application 2020 & 2033
- Table 21: Global Dental Allograft Particulate Revenue billion Forecast, by Types 2020 & 2033
- Table 22: Global Dental Allograft Particulate Volume K Forecast, by Types 2020 & 2033
- Table 23: Global Dental Allograft Particulate Revenue billion Forecast, by Country 2020 & 2033
- Table 24: Global Dental Allograft Particulate Volume K Forecast, by Country 2020 & 2033
- Table 25: Brazil Dental Allograft Particulate Revenue (billion) Forecast, by Application 2020 & 2033
- Table 26: Brazil Dental Allograft Particulate Volume (K) Forecast, by Application 2020 & 2033
- Table 27: Argentina Dental Allograft Particulate Revenue (billion) Forecast, by Application 2020 & 2033
- Table 28: Argentina Dental Allograft Particulate Volume (K) Forecast, by Application 2020 & 2033
- Table 29: Rest of South America Dental Allograft Particulate Revenue (billion) Forecast, by Application 2020 & 2033
- Table 30: Rest of South America Dental Allograft Particulate Volume (K) Forecast, by Application 2020 & 2033
- Table 31: Global Dental Allograft Particulate Revenue billion Forecast, by Application 2020 & 2033
- Table 32: Global Dental Allograft Particulate Volume K Forecast, by Application 2020 & 2033
- Table 33: Global Dental Allograft Particulate Revenue billion Forecast, by Types 2020 & 2033
- Table 34: Global Dental Allograft Particulate Volume K Forecast, by Types 2020 & 2033
- Table 35: Global Dental Allograft Particulate Revenue billion Forecast, by Country 2020 & 2033
- Table 36: Global Dental Allograft Particulate Volume K Forecast, by Country 2020 & 2033
- Table 37: United Kingdom Dental Allograft Particulate Revenue (billion) Forecast, by Application 2020 & 2033
- Table 38: United Kingdom Dental Allograft Particulate Volume (K) Forecast, by Application 2020 & 2033
- Table 39: Germany Dental Allograft Particulate Revenue (billion) Forecast, by Application 2020 & 2033
- Table 40: Germany Dental Allograft Particulate Volume (K) Forecast, by Application 2020 & 2033
- Table 41: France Dental Allograft Particulate Revenue (billion) Forecast, by Application 2020 & 2033
- Table 42: France Dental Allograft Particulate Volume (K) Forecast, by Application 2020 & 2033
- Table 43: Italy Dental Allograft Particulate Revenue (billion) Forecast, by Application 2020 & 2033
- Table 44: Italy Dental Allograft Particulate Volume (K) Forecast, by Application 2020 & 2033
- Table 45: Spain Dental Allograft Particulate Revenue (billion) Forecast, by Application 2020 & 2033
- Table 46: Spain Dental Allograft Particulate Volume (K) Forecast, by Application 2020 & 2033
- Table 47: Russia Dental Allograft Particulate Revenue (billion) Forecast, by Application 2020 & 2033
- Table 48: Russia Dental Allograft Particulate Volume (K) Forecast, by Application 2020 & 2033
- Table 49: Benelux Dental Allograft Particulate Revenue (billion) Forecast, by Application 2020 & 2033
- Table 50: Benelux Dental Allograft Particulate Volume (K) Forecast, by Application 2020 & 2033
- Table 51: Nordics Dental Allograft Particulate Revenue (billion) Forecast, by Application 2020 & 2033
- Table 52: Nordics Dental Allograft Particulate Volume (K) Forecast, by Application 2020 & 2033
- Table 53: Rest of Europe Dental Allograft Particulate Revenue (billion) Forecast, by Application 2020 & 2033
- Table 54: Rest of Europe Dental Allograft Particulate Volume (K) Forecast, by Application 2020 & 2033
- Table 55: Global Dental Allograft Particulate Revenue billion Forecast, by Application 2020 & 2033
- Table 56: Global Dental Allograft Particulate Volume K Forecast, by Application 2020 & 2033
- Table 57: Global Dental Allograft Particulate Revenue billion Forecast, by Types 2020 & 2033
- Table 58: Global Dental Allograft Particulate Volume K Forecast, by Types 2020 & 2033
- Table 59: Global Dental Allograft Particulate Revenue billion Forecast, by Country 2020 & 2033
- Table 60: Global Dental Allograft Particulate Volume K Forecast, by Country 2020 & 2033
- Table 61: Turkey Dental Allograft Particulate Revenue (billion) Forecast, by Application 2020 & 2033
- Table 62: Turkey Dental Allograft Particulate Volume (K) Forecast, by Application 2020 & 2033
- Table 63: Israel Dental Allograft Particulate Revenue (billion) Forecast, by Application 2020 & 2033
- Table 64: Israel Dental Allograft Particulate Volume (K) Forecast, by Application 2020 & 2033
- Table 65: GCC Dental Allograft Particulate Revenue (billion) Forecast, by Application 2020 & 2033
- Table 66: GCC Dental Allograft Particulate Volume (K) Forecast, by Application 2020 & 2033
- Table 67: North Africa Dental Allograft Particulate Revenue (billion) Forecast, by Application 2020 & 2033
- Table 68: North Africa Dental Allograft Particulate Volume (K) Forecast, by Application 2020 & 2033
- Table 69: South Africa Dental Allograft Particulate Revenue (billion) Forecast, by Application 2020 & 2033
- Table 70: South Africa Dental Allograft Particulate Volume (K) Forecast, by Application 2020 & 2033
- Table 71: Rest of Middle East & Africa Dental Allograft Particulate Revenue (billion) Forecast, by Application 2020 & 2033
- Table 72: Rest of Middle East & Africa Dental Allograft Particulate Volume (K) Forecast, by Application 2020 & 2033
- Table 73: Global Dental Allograft Particulate Revenue billion Forecast, by Application 2020 & 2033
- Table 74: Global Dental Allograft Particulate Volume K Forecast, by Application 2020 & 2033
- Table 75: Global Dental Allograft Particulate Revenue billion Forecast, by Types 2020 & 2033
- Table 76: Global Dental Allograft Particulate Volume K Forecast, by Types 2020 & 2033
- Table 77: Global Dental Allograft Particulate Revenue billion Forecast, by Country 2020 & 2033
- Table 78: Global Dental Allograft Particulate Volume K Forecast, by Country 2020 & 2033
- Table 79: China Dental Allograft Particulate Revenue (billion) Forecast, by Application 2020 & 2033
- Table 80: China Dental Allograft Particulate Volume (K) Forecast, by Application 2020 & 2033
- Table 81: India Dental Allograft Particulate Revenue (billion) Forecast, by Application 2020 & 2033
- Table 82: India Dental Allograft Particulate Volume (K) Forecast, by Application 2020 & 2033
- Table 83: Japan Dental Allograft Particulate Revenue (billion) Forecast, by Application 2020 & 2033
- Table 84: Japan Dental Allograft Particulate Volume (K) Forecast, by Application 2020 & 2033
- Table 85: South Korea Dental Allograft Particulate Revenue (billion) Forecast, by Application 2020 & 2033
- Table 86: South Korea Dental Allograft Particulate Volume (K) Forecast, by Application 2020 & 2033
- Table 87: ASEAN Dental Allograft Particulate Revenue (billion) Forecast, by Application 2020 & 2033
- Table 88: ASEAN Dental Allograft Particulate Volume (K) Forecast, by Application 2020 & 2033
- Table 89: Oceania Dental Allograft Particulate Revenue (billion) Forecast, by Application 2020 & 2033
- Table 90: Oceania Dental Allograft Particulate Volume (K) Forecast, by Application 2020 & 2033
- Table 91: Rest of Asia Pacific Dental Allograft Particulate Revenue (billion) Forecast, by Application 2020 & 2033
- Table 92: Rest of Asia Pacific Dental Allograft Particulate Volume (K) Forecast, by Application 2020 & 2033
Frequently Asked Questions
1. What is the projected Compound Annual Growth Rate (CAGR) of the Dental Allograft Particulate?
The projected CAGR is approximately 6.6%.
2. Which companies are prominent players in the Dental Allograft Particulate?
Key companies in the market include Biohorizons, BoneEasy, Botiss Biomaterials GmbH, Cowellmedi, Zimmer Biomet, Kyeron, RTI Surgical, Wright Medical, PuraGraft.
3. What are the main segments of the Dental Allograft Particulate?
The market segments include Application, Types.
4. Can you provide details about the market size?
The market size is estimated to be USD 3.16 billion as of 2022.
5. What are some drivers contributing to market growth?
N/A
6. What are the notable trends driving market growth?
N/A
7. Are there any restraints impacting market growth?
N/A
8. Can you provide examples of recent developments in the market?
N/A
9. What pricing options are available for accessing the report?
Pricing options include single-user, multi-user, and enterprise licenses priced at USD 3950.00, USD 5925.00, and USD 7900.00 respectively.
10. Is the market size provided in terms of value or volume?
The market size is provided in terms of value, measured in billion and volume, measured in K.
11. Are there any specific market keywords associated with the report?
Yes, the market keyword associated with the report is "Dental Allograft Particulate," which aids in identifying and referencing the specific market segment covered.
12. How do I determine which pricing option suits my needs best?
The pricing options vary based on user requirements and access needs. Individual users may opt for single-user licenses, while businesses requiring broader access may choose multi-user or enterprise licenses for cost-effective access to the report.
13. Are there any additional resources or data provided in the Dental Allograft Particulate report?
While the report offers comprehensive insights, it's advisable to review the specific contents or supplementary materials provided to ascertain if additional resources or data are available.
14. How can I stay updated on further developments or reports in the Dental Allograft Particulate?
To stay informed about further developments, trends, and reports in the Dental Allograft Particulate, consider subscribing to industry newsletters, following relevant companies and organizations, or regularly checking reputable industry news sources and publications.
Methodology
Step 1 - Identification of Relevant Samples Size from Population Database


Step 2 - Approaches for Defining Global Market Size (Value, Volume* & Price*)

Note*: In applicable scenarios
Step 3 - Data Sources
Primary Research
- Web Analytics
- Survey Reports
- Research Institute
- Latest Research Reports
- Opinion Leaders
Secondary Research
- Annual Reports
- White Paper
- Latest Press Release
- Industry Association
- Paid Database
- Investor Presentations

Step 4 - Data Triangulation
Involves using different sources of information in order to increase the validity of a study
These sources are likely to be stakeholders in a program - participants, other researchers, program staff, other community members, and so on.
Then we put all data in single framework & apply various statistical tools to find out the dynamic on the market.
During the analysis stage, feedback from the stakeholder groups would be compared to determine areas of agreement as well as areas of divergence