

Key Insights
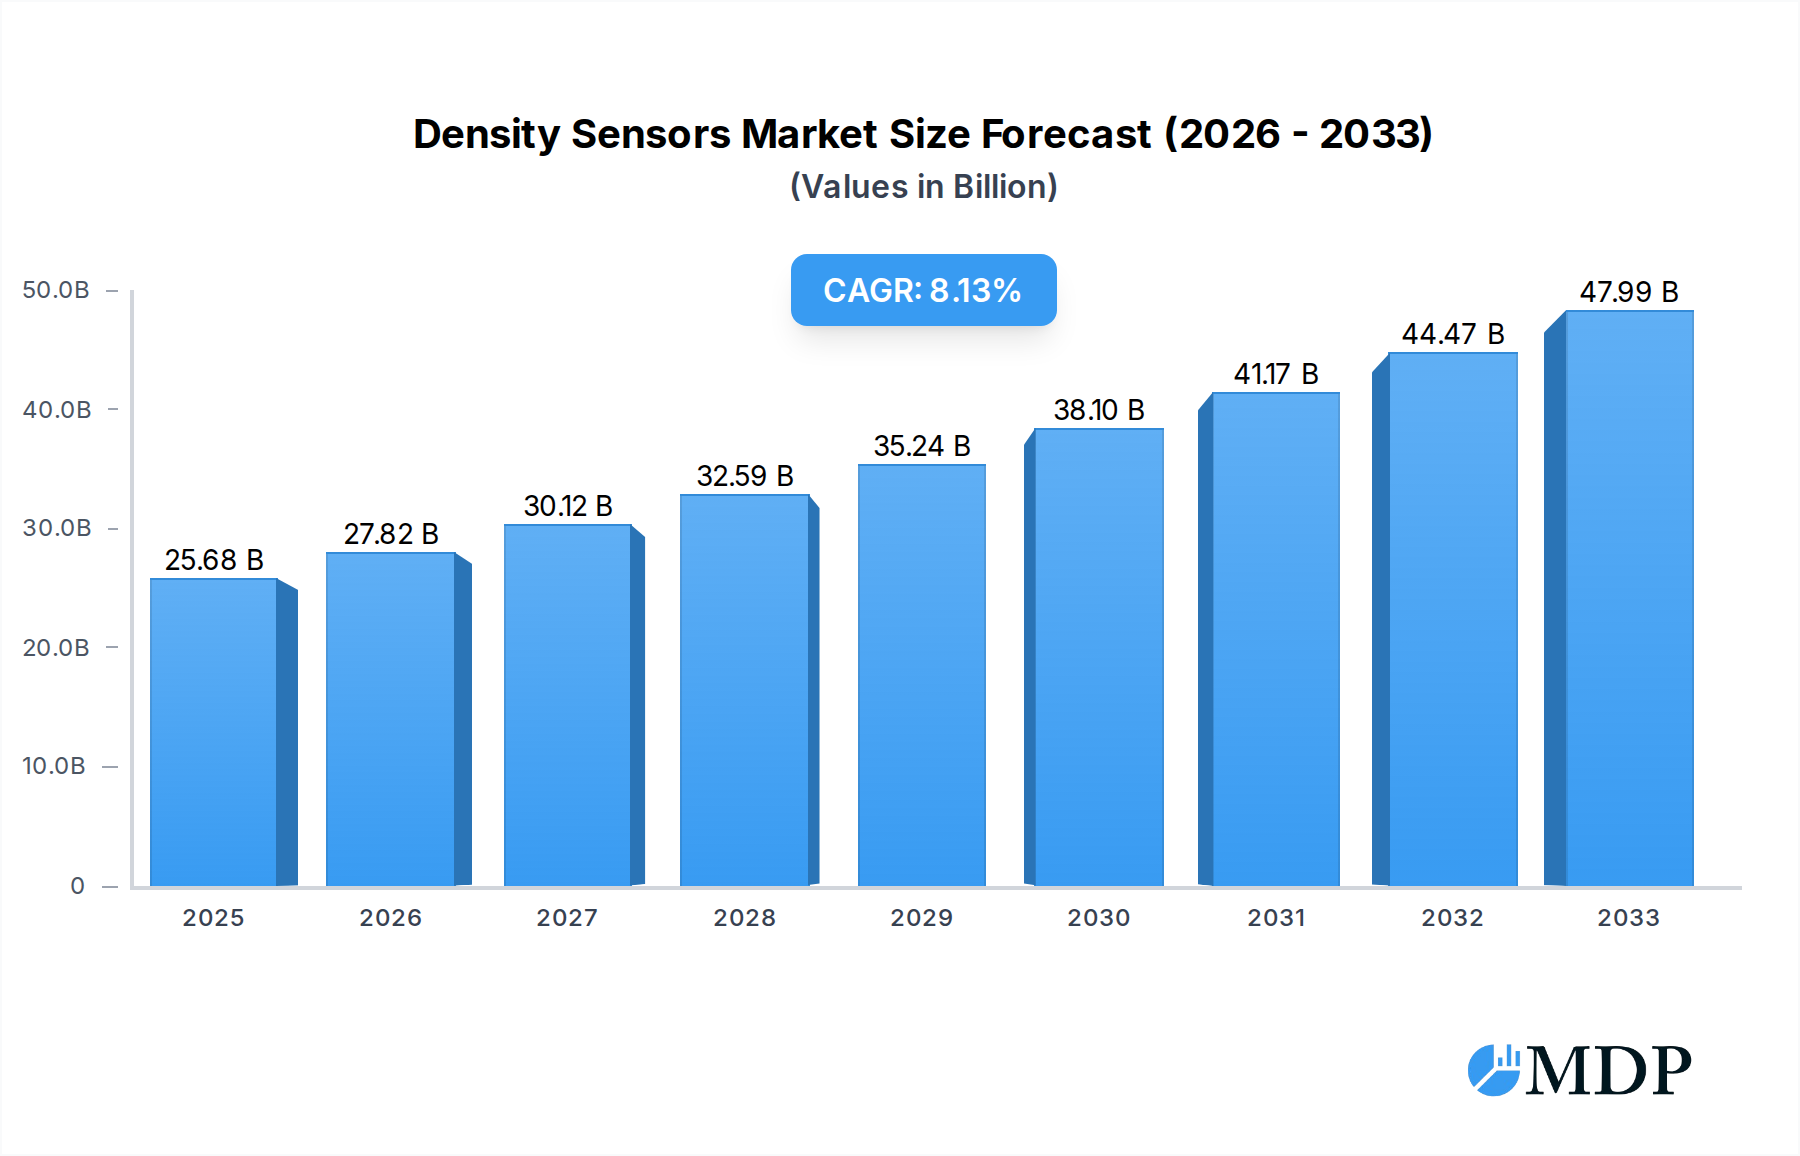
The global Density Sensors market is poised for robust expansion, projected to reach $25.68 billion by 2025, with a compelling Compound Annual Growth Rate (CAGR) of 8.44% through 2033. This significant growth is propelled by increasing demand across diverse industrial applications, particularly in the oil and gas sector for precise fluid monitoring and process optimization. The food and beverage industry is also a key driver, leveraging density sensors for quality control, ingredient verification, and product consistency. Furthermore, the chemical industry relies heavily on these sensors for accurate process management, ensuring safety and efficiency in various chemical reactions and formulations. The expanding application of density sensors in wastewater treatment and general industrial automation further bolsters market demand.

Density Sensors Market Size (In Billion)
Key growth drivers for the density sensors market include the continuous technological advancements leading to more accurate, reliable, and compact sensor designs. The increasing adoption of Industry 4.0 principles and the Internet of Things (IoT) is also fueling the demand for smart, connected density sensors that can provide real-time data for predictive maintenance and enhanced operational insights. While the market exhibits strong growth potential, certain restraints may include the initial high cost of advanced sensor technologies and the need for specialized calibration and maintenance. However, these challenges are expected to be mitigated by the long-term benefits of improved efficiency, reduced waste, and enhanced product quality that density sensors offer. The market segmentation by type, with 'Mounted to top Density Sensors' and 'Mounted to side Density Sensors' leading, reflects the diverse installation requirements across different industrial setups. Leading companies like Endress+Hauser, SICK, and Mettler-Toledo are actively investing in research and development to cater to these evolving market needs and maintain a competitive edge.
Density Sensors Company Market Share
Unlocking Precision: A Comprehensive Report on the Density Sensors Market
This in-depth report provides a panoramic view of the global Density Sensors market, meticulously analyzing its dynamics, trends, and future trajectory from 2019 through 2033. With a base year of 2025, the study offers actionable insights for industry stakeholders, investors, and decision-makers aiming to capitalize on the burgeoning opportunities in this critical sector. The report focuses on high-traffic keywords such as "density measurement," "process instrumentation," "industrial sensors," "liquid density meters," "gas density sensors," and "inline density analyzers" to ensure maximum search visibility.
Density Sensors Market Dynamics & Concentration
The global Density Sensors market is characterized by a moderately concentrated landscape, with major players like Endress+Hauser, SICK, Mettler-Toledo, Siemens, and Hach holding significant market share, estimated to be over 60 billion dollars collectively. Innovation drivers are primarily fueled by the increasing demand for real-time process control, enhanced product quality, and stringent regulatory compliance across various industries. Regulatory frameworks, particularly concerning environmental monitoring and safety standards in the gas & oil and chemical sectors, are playing a pivotal role in shaping market demand. Product substitutes, while present in some niche applications, are largely unable to match the precision and reliability offered by advanced density sensors. End-user trends lean towards miniaturization, enhanced connectivity (IoT integration), and predictive maintenance capabilities. Mergers and acquisitions (M&A) activity has been steady, with approximately 15 billion dollars in deal value observed historically, indicating consolidation and strategic expansion by leading firms seeking to broaden their product portfolios and geographical reach.
- Market Share Dominance: Leading companies collectively control over 60% of the market value.
- Innovation Focus: Real-time monitoring, IoT integration, and predictive analytics.
- Regulatory Impact: Environmental and safety standards driving adoption.
- M&A Activity: Approximately 15 billion dollars in historical deal value, signifying market consolidation.
Density Sensors Industry Trends & Analysis
The Density Sensors industry is poised for significant expansion, projected to witness a Compound Annual Growth Rate (CAGR) of 7.5% between 2025 and 2033, reaching an estimated market size of over 200 billion dollars by the end of the forecast period. This robust growth is underpinned by several key trends. The increasing complexity and automation of industrial processes across sectors like gas & oil production, food & beverage, and chemicals necessitate highly accurate and reliable density measurements for process optimization and quality control. Technological disruptions are at the forefront, with advancements in digital technologies, including AI and machine learning, enabling sophisticated data analysis and predictive capabilities for density sensors. Furthermore, the growing consumer preference for high-quality and safe products in the food and beverage industry directly translates into a higher demand for inline density monitoring to ensure consistency and compliance. Competitive dynamics are intensifying, with established players investing heavily in R&D to develop next-generation sensors offering superior performance, lower maintenance, and greater adaptability to diverse environmental conditions. The market penetration of advanced density sensing technologies is expected to rise as more industries recognize their value in improving efficiency, reducing waste, and ensuring product integrity. The rise of smart manufacturing and Industry 4.0 initiatives further propels the adoption of connected density sensors for seamless integration into broader operational systems.
Leading Markets & Segments in Density Sensors
The gas & oil production sector stands out as the dominant application segment for density sensors, driven by critical needs in exploration, extraction, refining, and transportation processes. The ability of these sensors to accurately measure the density of crude oil, natural gas, and refined products is indispensable for custody transfer, process control, and ensuring product specifications, contributing over 70 billion dollars to the market. Within this segment, geographical dominance is observed in regions with extensive oil and gas reserves and robust refining infrastructure, such as North America and the Middle East.
The chemical industry represents another significant and rapidly growing segment, valued at over 50 billion dollars, where precise density measurement is crucial for chemical composition analysis, reaction monitoring, and quality assurance of various chemical products.
The food & beverage industry, valued at over 40 billion dollars, is experiencing a substantial surge in demand for density sensors. This is primarily due to stringent quality control requirements, the need for consistent product formulations, and the rising consumer emphasis on product safety and traceability. Applications range from monitoring the density of dairy products and beverages to controlling the concentration of ingredients in processed foods.
In terms of sensor type, Mounted to top Density Sensors and Mounted to side Density Sensors are prevalent across various applications. However, the Others category, which encompasses technologies like inline, portable, and specialized density meters, is witnessing rapid innovation and adoption, particularly in process automation and demanding industrial environments.
- Dominant Application: Gas & Oil Production, driven by critical process control and custody transfer needs.
- Key Market Drivers (Gas & Oil): Economic policies supporting energy production, infrastructure development for extraction and refining.
- Growing Application: Chemical industry, essential for composition analysis and quality assurance.
- Rapidly Expanding Application: Food & Beverage, influenced by stringent quality control and consumer safety demands.
- Segmental Trends: Increasing adoption of inline and specialized density sensing technologies beyond traditional mounted types.
Density Sensors Product Developments
Recent product developments in density sensors are characterized by enhanced accuracy, improved durability, and greater connectivity. Innovations include the integration of advanced digital communication protocols (e.g., HART, Foundation Fieldbus) for seamless data transfer and remote diagnostics, alongside the miniaturization of devices for space-constrained applications. Furthermore, the development of sensors with wider operating temperature and pressure ranges, as well as enhanced resistance to corrosive media, expands their applicability in challenging industrial environments. These advancements provide competitive advantages by offering superior performance, reduced maintenance requirements, and optimized process control for end-users.
Key Drivers of Density Sensors Growth
The growth of the density sensors market is propelled by a confluence of technological, economic, and regulatory factors. The escalating demand for precise process control in industries like gas & oil, chemical, and food & beverage is a primary driver, necessitating accurate density measurements for quality assurance and efficiency. The ongoing digital transformation and the adoption of Industry 4.0 principles are accelerating the integration of smart, connected density sensors into industrial automation systems. Furthermore, increasingly stringent environmental regulations and safety standards worldwide mandate robust monitoring solutions, directly boosting the demand for reliable density measurement devices.
- Technological Advancement: Integration of IoT, AI, and advanced digital communication.
- Industrial Automation: Demand for real-time data and process optimization.
- Regulatory Compliance: Stringent environmental and safety standards.
- Industry 4.0 Adoption: Need for connected and intelligent sensor solutions.
Challenges in the Density Sensors Market
Despite the positive growth outlook, the density sensors market faces several challenges. High initial investment costs for advanced sensor technologies can be a barrier for small and medium-sized enterprises. The complexity of some sensing technologies may require specialized training for installation and maintenance, leading to operational hurdles. Fluctuations in raw material prices can impact manufacturing costs, potentially affecting pricing strategies. Moreover, the market experiences intense competition, with numerous players vying for market share, which can put pressure on profit margins.
- High Initial Investment: Cost of advanced sensor technologies.
- Technical Expertise: Need for specialized installation and maintenance.
- Raw Material Price Volatility: Impact on manufacturing costs.
- Intense Competition: Pressure on pricing and profitability.
Emerging Opportunities in Density Sensors
Emerging opportunities in the density sensors market are largely driven by technological breakthroughs and expanding application areas. The development of non-invasive density sensing technologies, which can measure density without requiring direct contact with the process fluid, presents a significant growth avenue, especially in hygienic applications. The increasing focus on sustainability and resource efficiency across industries is also creating demand for sensors that can optimize material usage and reduce waste. Furthermore, the expanding role of the Internet of Things (IoT) in industrial settings opens up opportunities for smart density sensors that provide real-time data analytics and predictive maintenance capabilities, fostering greater operational intelligence and efficiency. Strategic partnerships between sensor manufacturers and end-users are also crucial for co-developing bespoke solutions tailored to specific industry needs.
Leading Players in the Density Sensors Sector
- Endress+Hauser
- SICK
- Mettler-Toledo
- Siemens
- Hach
- Yokogawa Electric
- Emerson Electric
- KROHNE
- Eagle Eye Power Solutions
- BERTHOLD TECHNOLOGIES
- Rhosonics
- Integrated Sensing Systems
- Anton Paar
- LEMIS Process
- RITTER
- VAF Instruments
Key Milestones in Density Sensors Industry
- 2019: Introduction of advanced Coriolis-based density sensors with enhanced accuracy for the oil & gas sector.
- 2020: Significant investments in R&D for IoT-enabled density sensors for smart manufacturing.
- 2021: Launch of non-invasive density sensors for pharmaceutical and food & beverage applications.
- 2022: Increased M&A activity focused on acquiring companies with expertise in digital sensor technology.
- 2023: Development of AI-powered predictive maintenance algorithms for density sensor performance.
- 2024: Growing adoption of wireless communication protocols in density sensing solutions.
Strategic Outlook for Density Sensors Market
The strategic outlook for the density sensors market is highly promising, driven by continuous innovation and expanding applications. The future will see a greater emphasis on smart, connected sensors with advanced analytical capabilities, enabling predictive maintenance and optimized process control. Focus on sustainability and environmental monitoring will further fuel demand. Key growth accelerators include the integration of artificial intelligence for real-time data interpretation, the development of highly specialized sensors for niche industrial requirements, and expansion into emerging economies with growing industrial bases. Strategic partnerships and collaborations will be crucial for co-creating value and addressing complex industry challenges, ensuring sustained market growth.
Density Sensors Segmentation
-
1. Application
- 1.1. gas & oil production
- 1.2. food, beverage
- 1.3. chemical
- 1.4. Others
-
2. Type
- 2.1. Mounted to top Density Sensors
- 2.2. Mounted to side Density Sensors
- 2.3. Others
Density Sensors Segmentation By Geography
-
1. North America
- 1.1. United States
- 1.2. Canada
- 1.3. Mexico
-
2. South America
- 2.1. Brazil
- 2.2. Argentina
- 2.3. Rest of South America
-
3. Europe
- 3.1. United Kingdom
- 3.2. Germany
- 3.3. France
- 3.4. Italy
- 3.5. Spain
- 3.6. Russia
- 3.7. Benelux
- 3.8. Nordics
- 3.9. Rest of Europe
-
4. Middle East & Africa
- 4.1. Turkey
- 4.2. Israel
- 4.3. GCC
- 4.4. North Africa
- 4.5. South Africa
- 4.6. Rest of Middle East & Africa
-
5. Asia Pacific
- 5.1. China
- 5.2. India
- 5.3. Japan
- 5.4. South Korea
- 5.5. ASEAN
- 5.6. Oceania
- 5.7. Rest of Asia Pacific
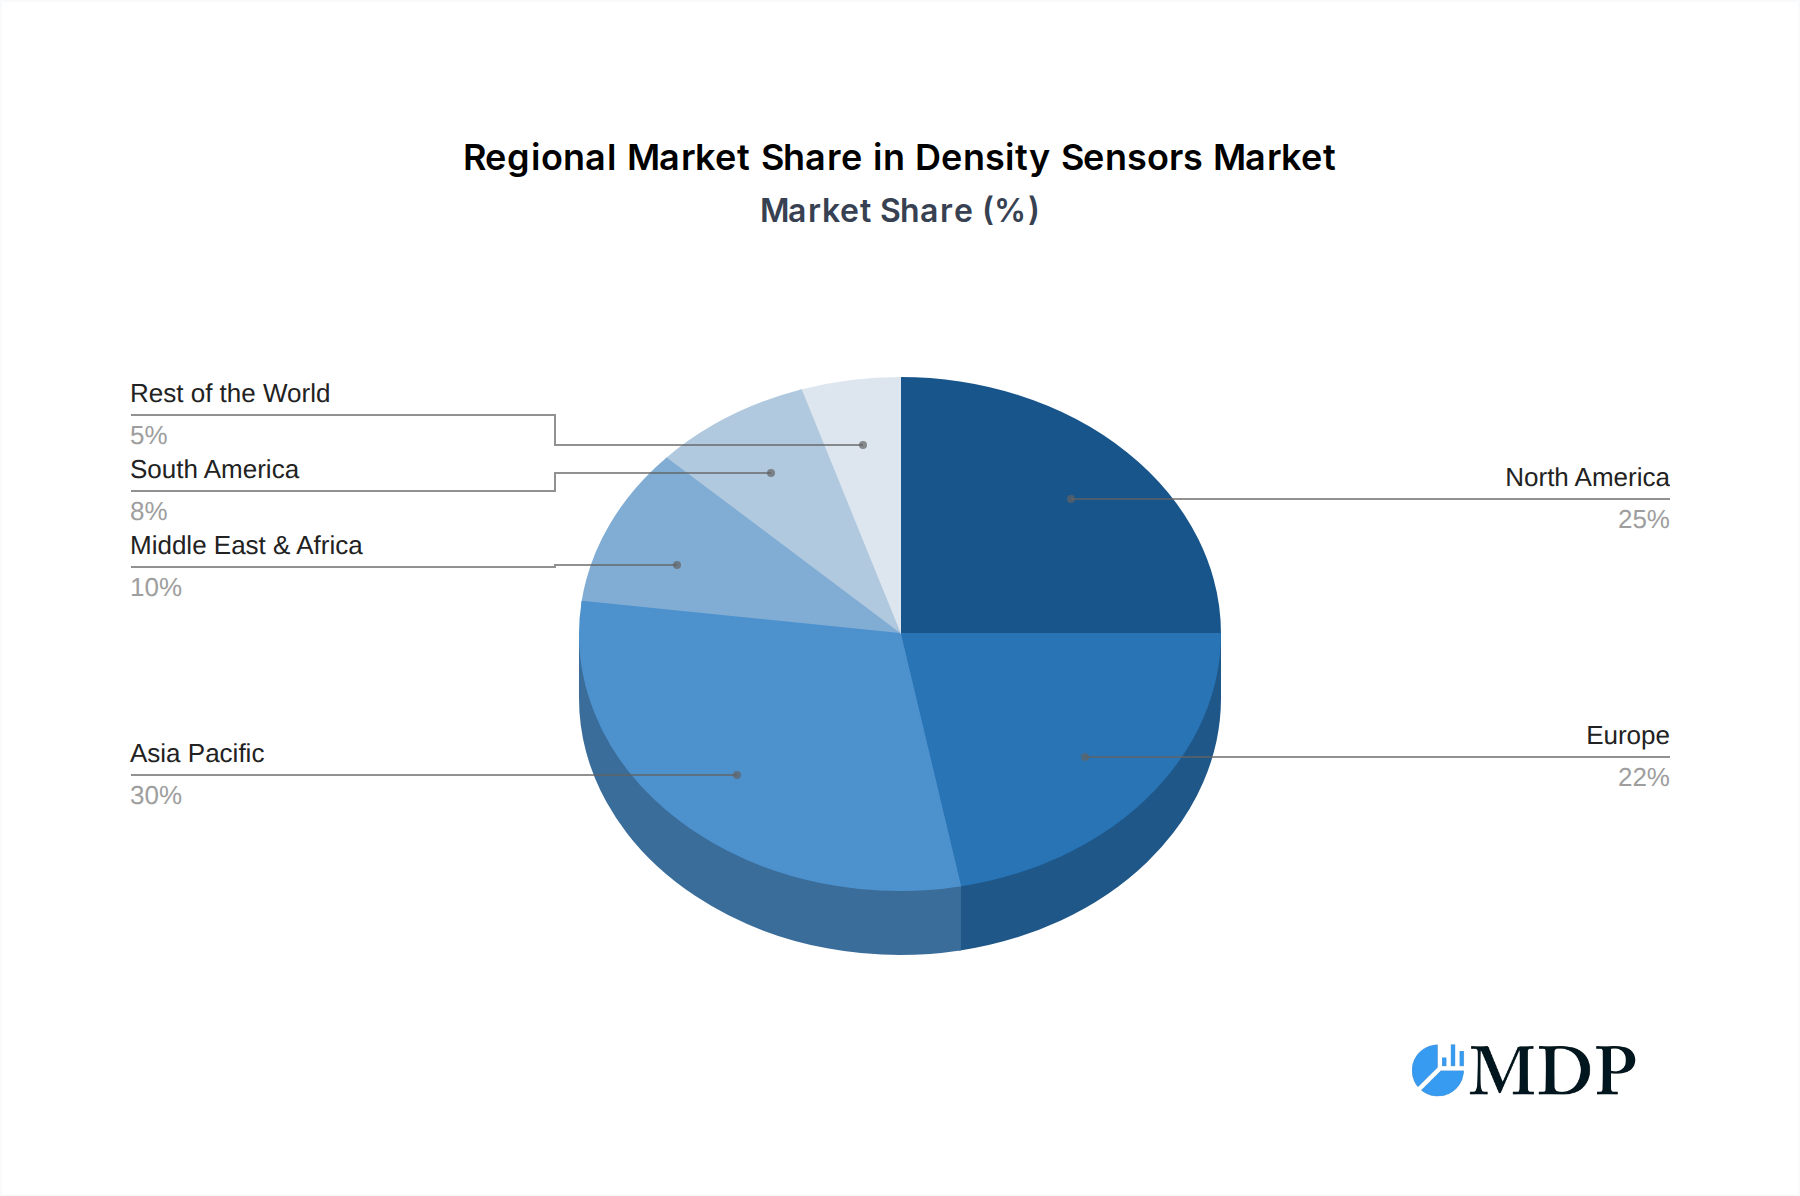
Density Sensors Regional Market Share
Geographic Coverage of Density Sensors
Density Sensors REPORT HIGHLIGHTS
| Aspects | Details |
|---|---|
| Study Period | 2020-2034 |
| Base Year | 2025 |
| Estimated Year | 2026 |
| Forecast Period | 2026-2034 |
| Historical Period | 2020-2025 |
| Growth Rate | CAGR of 8.44% from 2020-2034 |
| Segmentation |
|
Table of Contents
- 1. Introduction
- 1.1. Research Scope
- 1.2. Market Segmentation
- 1.3. Research Methodology
- 1.4. Definitions and Assumptions
- 2. Executive Summary
- 2.1. Introduction
- 3. Market Dynamics
- 3.1. Introduction
- 3.2. Market Drivers
- 3.3. Market Restrains
- 3.4. Market Trends
- 4. Market Factor Analysis
- 4.1. Porters Five Forces
- 4.2. Supply/Value Chain
- 4.3. PESTEL analysis
- 4.4. Market Entropy
- 4.5. Patent/Trademark Analysis
- 5. Global Density Sensors Analysis, Insights and Forecast, 2020-2032
- 5.1. Market Analysis, Insights and Forecast - by Application
- 5.1.1. gas & oil production
- 5.1.2. food, beverage
- 5.1.3. chemical
- 5.1.4. Others
- 5.2. Market Analysis, Insights and Forecast - by Type
- 5.2.1. Mounted to top Density Sensors
- 5.2.2. Mounted to side Density Sensors
- 5.2.3. Others
- 5.3. Market Analysis, Insights and Forecast - by Region
- 5.3.1. North America
- 5.3.2. South America
- 5.3.3. Europe
- 5.3.4. Middle East & Africa
- 5.3.5. Asia Pacific
- 5.1. Market Analysis, Insights and Forecast - by Application
- 6. North America Density Sensors Analysis, Insights and Forecast, 2020-2032
- 6.1. Market Analysis, Insights and Forecast - by Application
- 6.1.1. gas & oil production
- 6.1.2. food, beverage
- 6.1.3. chemical
- 6.1.4. Others
- 6.2. Market Analysis, Insights and Forecast - by Type
- 6.2.1. Mounted to top Density Sensors
- 6.2.2. Mounted to side Density Sensors
- 6.2.3. Others
- 6.1. Market Analysis, Insights and Forecast - by Application
- 7. South America Density Sensors Analysis, Insights and Forecast, 2020-2032
- 7.1. Market Analysis, Insights and Forecast - by Application
- 7.1.1. gas & oil production
- 7.1.2. food, beverage
- 7.1.3. chemical
- 7.1.4. Others
- 7.2. Market Analysis, Insights and Forecast - by Type
- 7.2.1. Mounted to top Density Sensors
- 7.2.2. Mounted to side Density Sensors
- 7.2.3. Others
- 7.1. Market Analysis, Insights and Forecast - by Application
- 8. Europe Density Sensors Analysis, Insights and Forecast, 2020-2032
- 8.1. Market Analysis, Insights and Forecast - by Application
- 8.1.1. gas & oil production
- 8.1.2. food, beverage
- 8.1.3. chemical
- 8.1.4. Others
- 8.2. Market Analysis, Insights and Forecast - by Type
- 8.2.1. Mounted to top Density Sensors
- 8.2.2. Mounted to side Density Sensors
- 8.2.3. Others
- 8.1. Market Analysis, Insights and Forecast - by Application
- 9. Middle East & Africa Density Sensors Analysis, Insights and Forecast, 2020-2032
- 9.1. Market Analysis, Insights and Forecast - by Application
- 9.1.1. gas & oil production
- 9.1.2. food, beverage
- 9.1.3. chemical
- 9.1.4. Others
- 9.2. Market Analysis, Insights and Forecast - by Type
- 9.2.1. Mounted to top Density Sensors
- 9.2.2. Mounted to side Density Sensors
- 9.2.3. Others
- 9.1. Market Analysis, Insights and Forecast - by Application
- 10. Asia Pacific Density Sensors Analysis, Insights and Forecast, 2020-2032
- 10.1. Market Analysis, Insights and Forecast - by Application
- 10.1.1. gas & oil production
- 10.1.2. food, beverage
- 10.1.3. chemical
- 10.1.4. Others
- 10.2. Market Analysis, Insights and Forecast - by Type
- 10.2.1. Mounted to top Density Sensors
- 10.2.2. Mounted to side Density Sensors
- 10.2.3. Others
- 10.1. Market Analysis, Insights and Forecast - by Application
- 11. Competitive Analysis
- 11.1. Global Market Share Analysis 2025
- 11.2. Company Profiles
- 11.2.1 Endress+Hauser
- 11.2.1.1. Overview
- 11.2.1.2. Products
- 11.2.1.3. SWOT Analysis
- 11.2.1.4. Recent Developments
- 11.2.1.5. Financials (Based on Availability)
- 11.2.2 SICK
- 11.2.2.1. Overview
- 11.2.2.2. Products
- 11.2.2.3. SWOT Analysis
- 11.2.2.4. Recent Developments
- 11.2.2.5. Financials (Based on Availability)
- 11.2.3 Mettler-Toledo
- 11.2.3.1. Overview
- 11.2.3.2. Products
- 11.2.3.3. SWOT Analysis
- 11.2.3.4. Recent Developments
- 11.2.3.5. Financials (Based on Availability)
- 11.2.4 Siemens
- 11.2.4.1. Overview
- 11.2.4.2. Products
- 11.2.4.3. SWOT Analysis
- 11.2.4.4. Recent Developments
- 11.2.4.5. Financials (Based on Availability)
- 11.2.5 Hach
- 11.2.5.1. Overview
- 11.2.5.2. Products
- 11.2.5.3. SWOT Analysis
- 11.2.5.4. Recent Developments
- 11.2.5.5. Financials (Based on Availability)
- 11.2.6 Yokogawa Electric
- 11.2.6.1. Overview
- 11.2.6.2. Products
- 11.2.6.3. SWOT Analysis
- 11.2.6.4. Recent Developments
- 11.2.6.5. Financials (Based on Availability)
- 11.2.7 Emerson Electric
- 11.2.7.1. Overview
- 11.2.7.2. Products
- 11.2.7.3. SWOT Analysis
- 11.2.7.4. Recent Developments
- 11.2.7.5. Financials (Based on Availability)
- 11.2.8 KROHNE
- 11.2.8.1. Overview
- 11.2.8.2. Products
- 11.2.8.3. SWOT Analysis
- 11.2.8.4. Recent Developments
- 11.2.8.5. Financials (Based on Availability)
- 11.2.9 Eagle Eye Power Solutions
- 11.2.9.1. Overview
- 11.2.9.2. Products
- 11.2.9.3. SWOT Analysis
- 11.2.9.4. Recent Developments
- 11.2.9.5. Financials (Based on Availability)
- 11.2.10 BERTHOLD TECHNOLOGIES
- 11.2.10.1. Overview
- 11.2.10.2. Products
- 11.2.10.3. SWOT Analysis
- 11.2.10.4. Recent Developments
- 11.2.10.5. Financials (Based on Availability)
- 11.2.11 Rhosonics
- 11.2.11.1. Overview
- 11.2.11.2. Products
- 11.2.11.3. SWOT Analysis
- 11.2.11.4. Recent Developments
- 11.2.11.5. Financials (Based on Availability)
- 11.2.12 Integrated Sensing Systems
- 11.2.12.1. Overview
- 11.2.12.2. Products
- 11.2.12.3. SWOT Analysis
- 11.2.12.4. Recent Developments
- 11.2.12.5. Financials (Based on Availability)
- 11.2.13 Anton Paar
- 11.2.13.1. Overview
- 11.2.13.2. Products
- 11.2.13.3. SWOT Analysis
- 11.2.13.4. Recent Developments
- 11.2.13.5. Financials (Based on Availability)
- 11.2.14 Integrated Sensing Systems
- 11.2.14.1. Overview
- 11.2.14.2. Products
- 11.2.14.3. SWOT Analysis
- 11.2.14.4. Recent Developments
- 11.2.14.5. Financials (Based on Availability)
- 11.2.15 LEMIS Process
- 11.2.15.1. Overview
- 11.2.15.2. Products
- 11.2.15.3. SWOT Analysis
- 11.2.15.4. Recent Developments
- 11.2.15.5. Financials (Based on Availability)
- 11.2.16 RITTER
- 11.2.16.1. Overview
- 11.2.16.2. Products
- 11.2.16.3. SWOT Analysis
- 11.2.16.4. Recent Developments
- 11.2.16.5. Financials (Based on Availability)
- 11.2.17 VAF Instruments
- 11.2.17.1. Overview
- 11.2.17.2. Products
- 11.2.17.3. SWOT Analysis
- 11.2.17.4. Recent Developments
- 11.2.17.5. Financials (Based on Availability)
- 11.2.1 Endress+Hauser
List of Figures
- Figure 1: Global Density Sensors Revenue Breakdown (undefined, %) by Region 2025 & 2033
- Figure 2: North America Density Sensors Revenue (undefined), by Application 2025 & 2033
- Figure 3: North America Density Sensors Revenue Share (%), by Application 2025 & 2033
- Figure 4: North America Density Sensors Revenue (undefined), by Type 2025 & 2033
- Figure 5: North America Density Sensors Revenue Share (%), by Type 2025 & 2033
- Figure 6: North America Density Sensors Revenue (undefined), by Country 2025 & 2033
- Figure 7: North America Density Sensors Revenue Share (%), by Country 2025 & 2033
- Figure 8: South America Density Sensors Revenue (undefined), by Application 2025 & 2033
- Figure 9: South America Density Sensors Revenue Share (%), by Application 2025 & 2033
- Figure 10: South America Density Sensors Revenue (undefined), by Type 2025 & 2033
- Figure 11: South America Density Sensors Revenue Share (%), by Type 2025 & 2033
- Figure 12: South America Density Sensors Revenue (undefined), by Country 2025 & 2033
- Figure 13: South America Density Sensors Revenue Share (%), by Country 2025 & 2033
- Figure 14: Europe Density Sensors Revenue (undefined), by Application 2025 & 2033
- Figure 15: Europe Density Sensors Revenue Share (%), by Application 2025 & 2033
- Figure 16: Europe Density Sensors Revenue (undefined), by Type 2025 & 2033
- Figure 17: Europe Density Sensors Revenue Share (%), by Type 2025 & 2033
- Figure 18: Europe Density Sensors Revenue (undefined), by Country 2025 & 2033
- Figure 19: Europe Density Sensors Revenue Share (%), by Country 2025 & 2033
- Figure 20: Middle East & Africa Density Sensors Revenue (undefined), by Application 2025 & 2033
- Figure 21: Middle East & Africa Density Sensors Revenue Share (%), by Application 2025 & 2033
- Figure 22: Middle East & Africa Density Sensors Revenue (undefined), by Type 2025 & 2033
- Figure 23: Middle East & Africa Density Sensors Revenue Share (%), by Type 2025 & 2033
- Figure 24: Middle East & Africa Density Sensors Revenue (undefined), by Country 2025 & 2033
- Figure 25: Middle East & Africa Density Sensors Revenue Share (%), by Country 2025 & 2033
- Figure 26: Asia Pacific Density Sensors Revenue (undefined), by Application 2025 & 2033
- Figure 27: Asia Pacific Density Sensors Revenue Share (%), by Application 2025 & 2033
- Figure 28: Asia Pacific Density Sensors Revenue (undefined), by Type 2025 & 2033
- Figure 29: Asia Pacific Density Sensors Revenue Share (%), by Type 2025 & 2033
- Figure 30: Asia Pacific Density Sensors Revenue (undefined), by Country 2025 & 2033
- Figure 31: Asia Pacific Density Sensors Revenue Share (%), by Country 2025 & 2033
List of Tables
- Table 1: Global Density Sensors Revenue undefined Forecast, by Application 2020 & 2033
- Table 2: Global Density Sensors Revenue undefined Forecast, by Type 2020 & 2033
- Table 3: Global Density Sensors Revenue undefined Forecast, by Region 2020 & 2033
- Table 4: Global Density Sensors Revenue undefined Forecast, by Application 2020 & 2033
- Table 5: Global Density Sensors Revenue undefined Forecast, by Type 2020 & 2033
- Table 6: Global Density Sensors Revenue undefined Forecast, by Country 2020 & 2033
- Table 7: United States Density Sensors Revenue (undefined) Forecast, by Application 2020 & 2033
- Table 8: Canada Density Sensors Revenue (undefined) Forecast, by Application 2020 & 2033
- Table 9: Mexico Density Sensors Revenue (undefined) Forecast, by Application 2020 & 2033
- Table 10: Global Density Sensors Revenue undefined Forecast, by Application 2020 & 2033
- Table 11: Global Density Sensors Revenue undefined Forecast, by Type 2020 & 2033
- Table 12: Global Density Sensors Revenue undefined Forecast, by Country 2020 & 2033
- Table 13: Brazil Density Sensors Revenue (undefined) Forecast, by Application 2020 & 2033
- Table 14: Argentina Density Sensors Revenue (undefined) Forecast, by Application 2020 & 2033
- Table 15: Rest of South America Density Sensors Revenue (undefined) Forecast, by Application 2020 & 2033
- Table 16: Global Density Sensors Revenue undefined Forecast, by Application 2020 & 2033
- Table 17: Global Density Sensors Revenue undefined Forecast, by Type 2020 & 2033
- Table 18: Global Density Sensors Revenue undefined Forecast, by Country 2020 & 2033
- Table 19: United Kingdom Density Sensors Revenue (undefined) Forecast, by Application 2020 & 2033
- Table 20: Germany Density Sensors Revenue (undefined) Forecast, by Application 2020 & 2033
- Table 21: France Density Sensors Revenue (undefined) Forecast, by Application 2020 & 2033
- Table 22: Italy Density Sensors Revenue (undefined) Forecast, by Application 2020 & 2033
- Table 23: Spain Density Sensors Revenue (undefined) Forecast, by Application 2020 & 2033
- Table 24: Russia Density Sensors Revenue (undefined) Forecast, by Application 2020 & 2033
- Table 25: Benelux Density Sensors Revenue (undefined) Forecast, by Application 2020 & 2033
- Table 26: Nordics Density Sensors Revenue (undefined) Forecast, by Application 2020 & 2033
- Table 27: Rest of Europe Density Sensors Revenue (undefined) Forecast, by Application 2020 & 2033
- Table 28: Global Density Sensors Revenue undefined Forecast, by Application 2020 & 2033
- Table 29: Global Density Sensors Revenue undefined Forecast, by Type 2020 & 2033
- Table 30: Global Density Sensors Revenue undefined Forecast, by Country 2020 & 2033
- Table 31: Turkey Density Sensors Revenue (undefined) Forecast, by Application 2020 & 2033
- Table 32: Israel Density Sensors Revenue (undefined) Forecast, by Application 2020 & 2033
- Table 33: GCC Density Sensors Revenue (undefined) Forecast, by Application 2020 & 2033
- Table 34: North Africa Density Sensors Revenue (undefined) Forecast, by Application 2020 & 2033
- Table 35: South Africa Density Sensors Revenue (undefined) Forecast, by Application 2020 & 2033
- Table 36: Rest of Middle East & Africa Density Sensors Revenue (undefined) Forecast, by Application 2020 & 2033
- Table 37: Global Density Sensors Revenue undefined Forecast, by Application 2020 & 2033
- Table 38: Global Density Sensors Revenue undefined Forecast, by Type 2020 & 2033
- Table 39: Global Density Sensors Revenue undefined Forecast, by Country 2020 & 2033
- Table 40: China Density Sensors Revenue (undefined) Forecast, by Application 2020 & 2033
- Table 41: India Density Sensors Revenue (undefined) Forecast, by Application 2020 & 2033
- Table 42: Japan Density Sensors Revenue (undefined) Forecast, by Application 2020 & 2033
- Table 43: South Korea Density Sensors Revenue (undefined) Forecast, by Application 2020 & 2033
- Table 44: ASEAN Density Sensors Revenue (undefined) Forecast, by Application 2020 & 2033
- Table 45: Oceania Density Sensors Revenue (undefined) Forecast, by Application 2020 & 2033
- Table 46: Rest of Asia Pacific Density Sensors Revenue (undefined) Forecast, by Application 2020 & 2033
Frequently Asked Questions
1. What is the projected Compound Annual Growth Rate (CAGR) of the Density Sensors?
The projected CAGR is approximately 8.44%.
2. Which companies are prominent players in the Density Sensors?
Key companies in the market include Endress+Hauser, SICK, Mettler-Toledo, Siemens, Hach, Yokogawa Electric, Emerson Electric, KROHNE, Eagle Eye Power Solutions, BERTHOLD TECHNOLOGIES, Rhosonics, Integrated Sensing Systems, Anton Paar, Integrated Sensing Systems, LEMIS Process, RITTER, VAF Instruments.
3. What are the main segments of the Density Sensors?
The market segments include Application, Type.
4. Can you provide details about the market size?
The market size is estimated to be USD XXX N/A as of 2022.
5. What are some drivers contributing to market growth?
N/A
6. What are the notable trends driving market growth?
N/A
7. Are there any restraints impacting market growth?
N/A
8. Can you provide examples of recent developments in the market?
N/A
9. What pricing options are available for accessing the report?
Pricing options include single-user, multi-user, and enterprise licenses priced at USD 4250.00, USD 6375.00, and USD 8500.00 respectively.
10. Is the market size provided in terms of value or volume?
The market size is provided in terms of value, measured in N/A.
11. Are there any specific market keywords associated with the report?
Yes, the market keyword associated with the report is "Density Sensors," which aids in identifying and referencing the specific market segment covered.
12. How do I determine which pricing option suits my needs best?
The pricing options vary based on user requirements and access needs. Individual users may opt for single-user licenses, while businesses requiring broader access may choose multi-user or enterprise licenses for cost-effective access to the report.
13. Are there any additional resources or data provided in the Density Sensors report?
While the report offers comprehensive insights, it's advisable to review the specific contents or supplementary materials provided to ascertain if additional resources or data are available.
14. How can I stay updated on further developments or reports in the Density Sensors?
To stay informed about further developments, trends, and reports in the Density Sensors, consider subscribing to industry newsletters, following relevant companies and organizations, or regularly checking reputable industry news sources and publications.
Methodology
Step 1 - Identification of Relevant Samples Size from Population Database


Step 2 - Approaches for Defining Global Market Size (Value, Volume* & Price*)

Note*: In applicable scenarios
Step 3 - Data Sources
Primary Research
- Web Analytics
- Survey Reports
- Research Institute
- Latest Research Reports
- Opinion Leaders
Secondary Research
- Annual Reports
- White Paper
- Latest Press Release
- Industry Association
- Paid Database
- Investor Presentations

Step 4 - Data Triangulation
Involves using different sources of information in order to increase the validity of a study
These sources are likely to be stakeholders in a program - participants, other researchers, program staff, other community members, and so on.
Then we put all data in single framework & apply various statistical tools to find out the dynamic on the market.
During the analysis stage, feedback from the stakeholder groups would be compared to determine areas of agreement as well as areas of divergence