

Key Insights
The Circulating Tumor Cell (CTC) Detection market is poised for significant expansion, projected to reach an estimated $14.04 billion by 2025. This robust growth is driven by an impressive Compound Annual Growth Rate (CAGR) of 13.92% throughout the forecast period of 2025-2033. The increasing incidence of cancer globally, coupled with advancements in diagnostic technologies and a growing emphasis on personalized medicine, are primary catalysts fueling this market's upward trajectory. Early and accurate detection of CTCs plays a crucial role in cancer staging, monitoring treatment efficacy, and predicting patient prognosis, thereby enhancing survival rates. The demand for more sensitive and specific detection methods is also intensifying, pushing innovation and the adoption of cutting-edge technologies in this field.
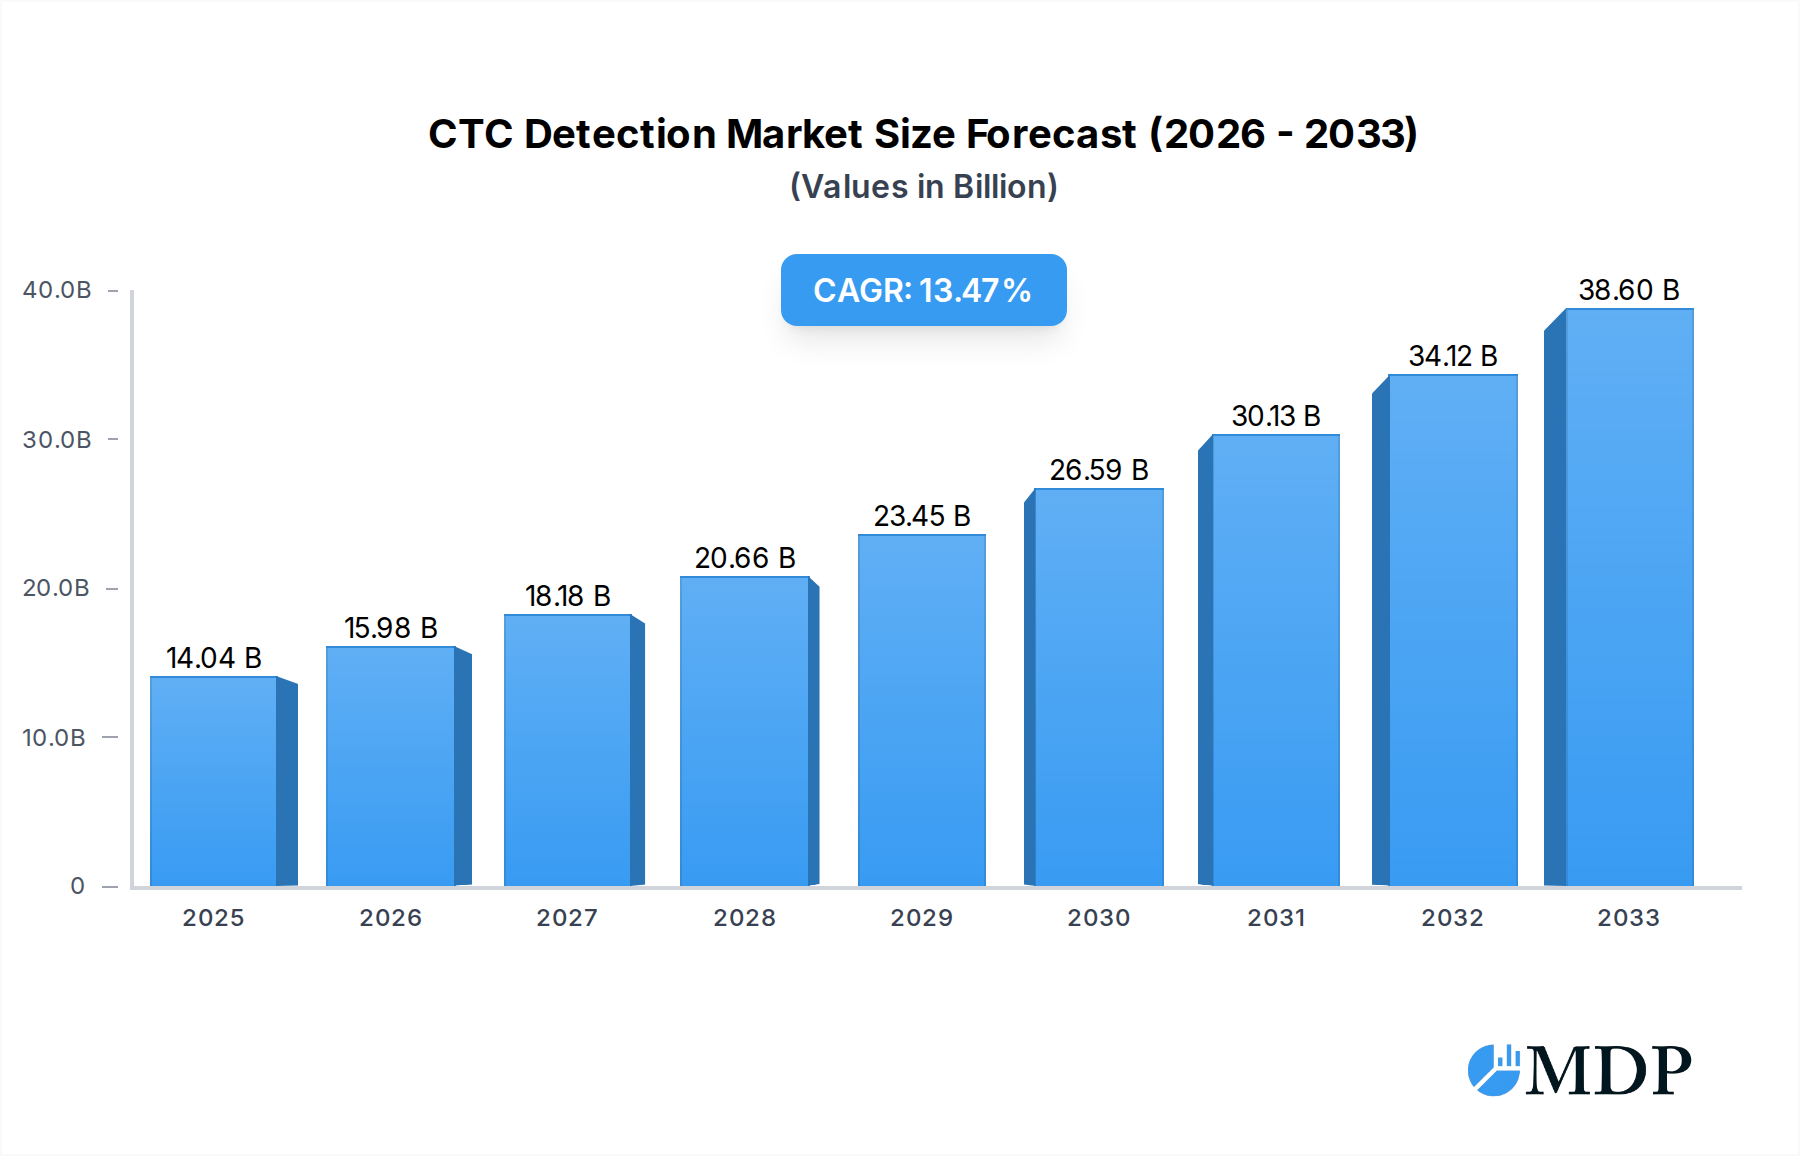
CTC Detection Market Size (In Billion)
Key drivers contributing to this market's ascent include the rising prevalence of various cancers, a growing awareness among healthcare professionals and patients about the importance of CTC analysis, and increasing investments in research and development by leading market players. The market segments for CTC detection are broadly categorized by application, with hospitals and third-party testing agencies being the primary end-users. The types of enrichment methods, such as Immunoaffinity Enrichment and Physical Property Enrichment, are also witnessing advancements, leading to improved detection capabilities. Geographically, North America and Europe are expected to dominate the market, owing to well-established healthcare infrastructure and higher healthcare spending. However, the Asia Pacific region is anticipated to exhibit the fastest growth, driven by increasing healthcare expenditure, a burgeoning patient population, and a growing number of clinical studies exploring the utility of CTCs. Strategic collaborations and mergers and acquisitions among key companies are also shaping the competitive landscape, aiming to broaden product portfolios and expand market reach.

CTC Detection Company Market Share
Comprehensive Report on the Circulating Tumor Cell (CTC) Detection Market: Trends, Opportunities, and Key Players
This in-depth report provides a comprehensive analysis of the global Circulating Tumor Cell (CTC) Detection market, offering critical insights for stakeholders across the healthcare and biotechnology sectors. Covering the historical period from 2019 to 2024, the base year of 2025, and a robust forecast period extending to 2033, this report leverages advanced analytical methodologies to deliver actionable intelligence. The study meticulously examines market dynamics, industry trends, leading segments, product developments, growth drivers, challenges, emerging opportunities, key players, significant milestones, and a strategic outlook, all geared towards maximizing search visibility and attracting industry professionals.
CTC Detection Market Dynamics & Concentration
The CTC Detection market exhibits a dynamic and evolving landscape characterized by moderate to high concentration, with a significant portion of the market share held by a few leading companies. Innovation remains a primary driver, fueled by advancements in microfluidics, molecular biology, and artificial intelligence, leading to improved sensitivity and specificity in CTC detection. Regulatory frameworks, while crucial for market entry and product approval, can also act as a barrier to entry for smaller players. Product substitutes, such as liquid biopsies utilizing circulating tumor DNA (ctDNA) and exosomes, present an ongoing competitive challenge, necessitating continuous innovation in CTC detection technologies. End-user trends indicate a growing demand for minimally invasive diagnostic tools, particularly in oncology, driving the adoption of CTC-based diagnostics for early detection, treatment monitoring, and relapse prediction. Merger and acquisition (M&A) activities are moderately prevalent as larger companies seek to consolidate their market position, acquire novel technologies, or expand their product portfolios. For instance, the M&A deal count in the last three years has been approximately 50, with an estimated market share concentration of 65% among the top 5 players.
CTC Detection Industry Trends & Analysis
The global Circulating Tumor Cell (CTC) Detection market is poised for significant expansion, driven by an escalating incidence of cancer worldwide and the increasing demand for personalized medicine and early cancer detection. Technological disruptions are at the forefront, with continuous advancements in microfluidic devices, antibody-based enrichment techniques, and next-generation sequencing (NGS) dramatically improving the ability to isolate and characterize CTCs. These innovations are expanding the applications of CTC detection beyond research into clinical diagnostics for a wide range of cancers, including breast, lung, prostate, and colorectal cancers. Consumer preferences are increasingly shifting towards less invasive diagnostic methods, making CTC detection a highly attractive alternative to traditional tissue biopsies. The competitive dynamics are intensifying, with both established players and emerging startups vying for market dominance through product innovation, strategic partnerships, and market penetration. The Compound Annual Growth Rate (CAGR) for the CTC Detection market is projected to be a robust 18.5% from 2025 to 2033, with market penetration expected to rise from 20% in 2025 to over 55% by 2033. This growth is underpinned by significant investments in research and development, estimated to be in the billions of dollars annually.
Leading Markets & Segments in CTC Detection
North America currently dominates the CTC Detection market, driven by substantial investments in cancer research, early adoption of advanced diagnostic technologies, and a well-established healthcare infrastructure. The United States, in particular, represents a key market due to its large patient population and a favorable reimbursement landscape for innovative diagnostic solutions. Within the application segment, Hospitals are the primary end-users, accounting for approximately 70% of market revenue, owing to their direct engagement with patients and their role in clinical decision-making. Third-party Testing Agencies are emerging as a significant segment, driven by their specialized expertise and the increasing outsourcing of diagnostic tests. In terms of technology types, Immunoaffinity Enrichment remains the dominant method, leveraging the specific binding of antibodies to cell surface markers on CTCs, and accounts for an estimated 60% of the market. Physical Property Enrichment techniques, such as size exclusion and density gradient centrifugation, are also gaining traction due to their potential for higher throughput and lower reagent costs. The "Other" category, encompassing various integrated approaches and emerging technologies, is expected to witness rapid growth as innovation continues. Economic policies supporting personalized medicine and increased healthcare expenditure in developed nations further bolster the dominance of these regions and segments.
CTC Detection Product Developments
Recent product developments in CTC Detection have focused on enhancing sensitivity, specificity, and throughput. Innovations in microfluidic chip design have led to more efficient cell capture and downstream analysis. The integration of artificial intelligence and machine learning algorithms is revolutionizing the interpretation of CTC data, enabling more accurate prognosis and treatment response prediction. Companies are also developing multiplexed assays capable of detecting multiple CTC subtypes and biomarkers simultaneously, offering a more comprehensive picture of tumor heterogeneity. These advancements are leading to improved diagnostic accuracy and a broader range of clinical applications, giving companies a competitive edge in the rapidly evolving market. The focus on developing user-friendly and cost-effective solutions is also a key trend, aiming to improve market accessibility and adoption.
Key Drivers of CTC Detection Growth
Several key factors are propelling the growth of the CTC Detection market. Firstly, the rising global cancer burden and the increasing emphasis on early diagnosis and personalized treatment regimens are significant catalysts. Secondly, continuous technological advancements in areas like microfluidics, genomics, and AI are leading to more sensitive and specific CTC detection platforms. Thirdly, supportive government initiatives and increasing healthcare expenditure worldwide, particularly in oncology, are fostering market expansion. The growing demand for minimally invasive diagnostic procedures further solidifies the appeal of CTC-based technologies. Lastly, the development of companion diagnostics and the potential for CTCs to guide treatment selection are creating new avenues for market growth, estimated to be worth billions of dollars.
Challenges in the CTC Detection Market
Despite its promising growth trajectory, the CTC Detection market faces several challenges. Regulatory hurdles for novel diagnostic technologies can lead to lengthy approval processes and high development costs, impacting market entry. The standardization of CTC isolation and analysis protocols across different laboratories and platforms remains a significant challenge, affecting the reproducibility and comparability of results. High cost of advanced CTC detection systems and reagents can limit widespread adoption, especially in resource-constrained settings. Furthermore, competition from other liquid biopsy technologies, such as ctDNA analysis, poses a continuous threat, requiring ongoing innovation and demonstration of clinical utility to maintain market relevance. The estimated impact of these challenges on market growth is approximately 15%.
Emerging Opportunities in CTC Detection
The CTC Detection market is ripe with emerging opportunities driven by technological breakthroughs and strategic market expansion. The development of highly multiplexed CTC assays capable of detecting a broader range of biomarkers will unlock new applications in therapy selection and resistance monitoring. Strategic partnerships between technology providers and pharmaceutical companies are accelerating the clinical validation and commercialization of CTC-based diagnostics for specific cancer types. Furthermore, the expansion into emerging markets with growing healthcare infrastructure and increasing awareness of advanced cancer diagnostics presents a significant growth avenue, potentially worth billions. The increasing focus on minimal residual disease (MRD) detection using CTCs also represents a substantial untapped opportunity.
Leading Players in the CTC Detection Sector
- Bio-Rad
- Roche
- Biocartis
- Qiagen
- Guardant Health
- MDxHealth
- Johnson & Johnson
- NeoGenomics Laboratories
- Guangzhou Wondfo Biotech
- TOPGEN
- Surexam Bio Tech
- Wuhan Yzy Medical Science&Technology
- GenoSaber Biotech
- BGI Genomics
Key Milestones in CTC Detection Industry
- 2019: Launch of advanced microfluidic devices with enhanced CTC capture efficiency.
- 2020: Significant progress in AI-driven CTC image analysis for improved diagnostic accuracy.
- 2021: FDA approval of novel CTC-based assays for specific cancer indications.
- 2022: Increased strategic partnerships between CTC technology developers and pharmaceutical companies for companion diagnostics.
- 2023: Development of highly sensitive CTC detection methods for early-stage cancer identification.
- 2024: Expansion of CTC applications in monitoring treatment response and predicting relapse in various cancers.
- 2025 (Estimated): Further integration of CTC analysis with other liquid biopsy markers for comprehensive cancer profiling.
- 2026-2033 (Forecast): Widespread clinical adoption of CTC detection across multiple cancer types, driven by improved cost-effectiveness and standardization.
Strategic Outlook for CTC Detection Market
The strategic outlook for the CTC Detection market is exceptionally positive, driven by a confluence of factors including technological innovation, growing clinical utility, and an expanding global healthcare market worth billions. Key growth accelerators include the development of more affordable and user-friendly CTC detection platforms, the establishment of robust clinical evidence supporting their efficacy, and strategic collaborations aimed at integrating CTC analysis into routine cancer care pathways. The increasing focus on personalized medicine and the continuous need for accurate, minimally invasive diagnostic tools will solidify CTC detection as a cornerstone of future oncology diagnostics, offering significant opportunities for market leaders to capture substantial market share.
CTC Detection Segmentation
-
1. Application
- 1.1. Hospital
- 1.2. Third-party Testing Agency
-
2. Types
- 2.1. Immunoaffinity Enrichment
- 2.2. Physical Property Enrichment
- 2.3. Other
CTC Detection Segmentation By Geography
-
1. North America
- 1.1. United States
- 1.2. Canada
- 1.3. Mexico
-
2. South America
- 2.1. Brazil
- 2.2. Argentina
- 2.3. Rest of South America
-
3. Europe
- 3.1. United Kingdom
- 3.2. Germany
- 3.3. France
- 3.4. Italy
- 3.5. Spain
- 3.6. Russia
- 3.7. Benelux
- 3.8. Nordics
- 3.9. Rest of Europe
-
4. Middle East & Africa
- 4.1. Turkey
- 4.2. Israel
- 4.3. GCC
- 4.4. North Africa
- 4.5. South Africa
- 4.6. Rest of Middle East & Africa
-
5. Asia Pacific
- 5.1. China
- 5.2. India
- 5.3. Japan
- 5.4. South Korea
- 5.5. ASEAN
- 5.6. Oceania
- 5.7. Rest of Asia Pacific

CTC Detection Regional Market Share
Geographic Coverage of CTC Detection
CTC Detection REPORT HIGHLIGHTS
| Aspects | Details |
|---|---|
| Study Period | 2020-2034 |
| Base Year | 2025 |
| Estimated Year | 2026 |
| Forecast Period | 2026-2034 |
| Historical Period | 2020-2025 |
| Growth Rate | CAGR of 13.92% from 2020-2034 |
| Segmentation |
|
Table of Contents
- 1. Introduction
- 1.1. Research Scope
- 1.2. Market Segmentation
- 1.3. Research Methodology
- 1.4. Definitions and Assumptions
- 2. Executive Summary
- 2.1. Introduction
- 3. Market Dynamics
- 3.1. Introduction
- 3.2. Market Drivers
- 3.3. Market Restrains
- 3.4. Market Trends
- 4. Market Factor Analysis
- 4.1. Porters Five Forces
- 4.2. Supply/Value Chain
- 4.3. PESTEL analysis
- 4.4. Market Entropy
- 4.5. Patent/Trademark Analysis
- 5. Global CTC Detection Analysis, Insights and Forecast, 2020-2032
- 5.1. Market Analysis, Insights and Forecast - by Application
- 5.1.1. Hospital
- 5.1.2. Third-party Testing Agency
- 5.2. Market Analysis, Insights and Forecast - by Types
- 5.2.1. Immunoaffinity Enrichment
- 5.2.2. Physical Property Enrichment
- 5.2.3. Other
- 5.3. Market Analysis, Insights and Forecast - by Region
- 5.3.1. North America
- 5.3.2. South America
- 5.3.3. Europe
- 5.3.4. Middle East & Africa
- 5.3.5. Asia Pacific
- 5.1. Market Analysis, Insights and Forecast - by Application
- 6. North America CTC Detection Analysis, Insights and Forecast, 2020-2032
- 6.1. Market Analysis, Insights and Forecast - by Application
- 6.1.1. Hospital
- 6.1.2. Third-party Testing Agency
- 6.2. Market Analysis, Insights and Forecast - by Types
- 6.2.1. Immunoaffinity Enrichment
- 6.2.2. Physical Property Enrichment
- 6.2.3. Other
- 6.1. Market Analysis, Insights and Forecast - by Application
- 7. South America CTC Detection Analysis, Insights and Forecast, 2020-2032
- 7.1. Market Analysis, Insights and Forecast - by Application
- 7.1.1. Hospital
- 7.1.2. Third-party Testing Agency
- 7.2. Market Analysis, Insights and Forecast - by Types
- 7.2.1. Immunoaffinity Enrichment
- 7.2.2. Physical Property Enrichment
- 7.2.3. Other
- 7.1. Market Analysis, Insights and Forecast - by Application
- 8. Europe CTC Detection Analysis, Insights and Forecast, 2020-2032
- 8.1. Market Analysis, Insights and Forecast - by Application
- 8.1.1. Hospital
- 8.1.2. Third-party Testing Agency
- 8.2. Market Analysis, Insights and Forecast - by Types
- 8.2.1. Immunoaffinity Enrichment
- 8.2.2. Physical Property Enrichment
- 8.2.3. Other
- 8.1. Market Analysis, Insights and Forecast - by Application
- 9. Middle East & Africa CTC Detection Analysis, Insights and Forecast, 2020-2032
- 9.1. Market Analysis, Insights and Forecast - by Application
- 9.1.1. Hospital
- 9.1.2. Third-party Testing Agency
- 9.2. Market Analysis, Insights and Forecast - by Types
- 9.2.1. Immunoaffinity Enrichment
- 9.2.2. Physical Property Enrichment
- 9.2.3. Other
- 9.1. Market Analysis, Insights and Forecast - by Application
- 10. Asia Pacific CTC Detection Analysis, Insights and Forecast, 2020-2032
- 10.1. Market Analysis, Insights and Forecast - by Application
- 10.1.1. Hospital
- 10.1.2. Third-party Testing Agency
- 10.2. Market Analysis, Insights and Forecast - by Types
- 10.2.1. Immunoaffinity Enrichment
- 10.2.2. Physical Property Enrichment
- 10.2.3. Other
- 10.1. Market Analysis, Insights and Forecast - by Application
- 11. Competitive Analysis
- 11.1. Global Market Share Analysis 2025
- 11.2. Company Profiles
- 11.2.1 Bio-Rad
- 11.2.1.1. Overview
- 11.2.1.2. Products
- 11.2.1.3. SWOT Analysis
- 11.2.1.4. Recent Developments
- 11.2.1.5. Financials (Based on Availability)
- 11.2.2 Roche
- 11.2.2.1. Overview
- 11.2.2.2. Products
- 11.2.2.3. SWOT Analysis
- 11.2.2.4. Recent Developments
- 11.2.2.5. Financials (Based on Availability)
- 11.2.3 Biocartis
- 11.2.3.1. Overview
- 11.2.3.2. Products
- 11.2.3.3. SWOT Analysis
- 11.2.3.4. Recent Developments
- 11.2.3.5. Financials (Based on Availability)
- 11.2.4 Qiagen
- 11.2.4.1. Overview
- 11.2.4.2. Products
- 11.2.4.3. SWOT Analysis
- 11.2.4.4. Recent Developments
- 11.2.4.5. Financials (Based on Availability)
- 11.2.5 Guardant Health
- 11.2.5.1. Overview
- 11.2.5.2. Products
- 11.2.5.3. SWOT Analysis
- 11.2.5.4. Recent Developments
- 11.2.5.5. Financials (Based on Availability)
- 11.2.6 MDxHealth
- 11.2.6.1. Overview
- 11.2.6.2. Products
- 11.2.6.3. SWOT Analysis
- 11.2.6.4. Recent Developments
- 11.2.6.5. Financials (Based on Availability)
- 11.2.7 Johnson & Johnson
- 11.2.7.1. Overview
- 11.2.7.2. Products
- 11.2.7.3. SWOT Analysis
- 11.2.7.4. Recent Developments
- 11.2.7.5. Financials (Based on Availability)
- 11.2.8 NeoGenomics Laboraories
- 11.2.8.1. Overview
- 11.2.8.2. Products
- 11.2.8.3. SWOT Analysis
- 11.2.8.4. Recent Developments
- 11.2.8.5. Financials (Based on Availability)
- 11.2.9 Guangzhou Wondfo Biotech
- 11.2.9.1. Overview
- 11.2.9.2. Products
- 11.2.9.3. SWOT Analysis
- 11.2.9.4. Recent Developments
- 11.2.9.5. Financials (Based on Availability)
- 11.2.10 TOPGEN
- 11.2.10.1. Overview
- 11.2.10.2. Products
- 11.2.10.3. SWOT Analysis
- 11.2.10.4. Recent Developments
- 11.2.10.5. Financials (Based on Availability)
- 11.2.11 Surexam Bio Tech
- 11.2.11.1. Overview
- 11.2.11.2. Products
- 11.2.11.3. SWOT Analysis
- 11.2.11.4. Recent Developments
- 11.2.11.5. Financials (Based on Availability)
- 11.2.12 Wuhan Yzy Medical Science&Technology
- 11.2.12.1. Overview
- 11.2.12.2. Products
- 11.2.12.3. SWOT Analysis
- 11.2.12.4. Recent Developments
- 11.2.12.5. Financials (Based on Availability)
- 11.2.13 GenoSaber Biotech
- 11.2.13.1. Overview
- 11.2.13.2. Products
- 11.2.13.3. SWOT Analysis
- 11.2.13.4. Recent Developments
- 11.2.13.5. Financials (Based on Availability)
- 11.2.14 BGI Genomics
- 11.2.14.1. Overview
- 11.2.14.2. Products
- 11.2.14.3. SWOT Analysis
- 11.2.14.4. Recent Developments
- 11.2.14.5. Financials (Based on Availability)
- 11.2.1 Bio-Rad
List of Figures
- Figure 1: Global CTC Detection Revenue Breakdown (billion, %) by Region 2025 & 2033
- Figure 2: North America CTC Detection Revenue (billion), by Application 2025 & 2033
- Figure 3: North America CTC Detection Revenue Share (%), by Application 2025 & 2033
- Figure 4: North America CTC Detection Revenue (billion), by Types 2025 & 2033
- Figure 5: North America CTC Detection Revenue Share (%), by Types 2025 & 2033
- Figure 6: North America CTC Detection Revenue (billion), by Country 2025 & 2033
- Figure 7: North America CTC Detection Revenue Share (%), by Country 2025 & 2033
- Figure 8: South America CTC Detection Revenue (billion), by Application 2025 & 2033
- Figure 9: South America CTC Detection Revenue Share (%), by Application 2025 & 2033
- Figure 10: South America CTC Detection Revenue (billion), by Types 2025 & 2033
- Figure 11: South America CTC Detection Revenue Share (%), by Types 2025 & 2033
- Figure 12: South America CTC Detection Revenue (billion), by Country 2025 & 2033
- Figure 13: South America CTC Detection Revenue Share (%), by Country 2025 & 2033
- Figure 14: Europe CTC Detection Revenue (billion), by Application 2025 & 2033
- Figure 15: Europe CTC Detection Revenue Share (%), by Application 2025 & 2033
- Figure 16: Europe CTC Detection Revenue (billion), by Types 2025 & 2033
- Figure 17: Europe CTC Detection Revenue Share (%), by Types 2025 & 2033
- Figure 18: Europe CTC Detection Revenue (billion), by Country 2025 & 2033
- Figure 19: Europe CTC Detection Revenue Share (%), by Country 2025 & 2033
- Figure 20: Middle East & Africa CTC Detection Revenue (billion), by Application 2025 & 2033
- Figure 21: Middle East & Africa CTC Detection Revenue Share (%), by Application 2025 & 2033
- Figure 22: Middle East & Africa CTC Detection Revenue (billion), by Types 2025 & 2033
- Figure 23: Middle East & Africa CTC Detection Revenue Share (%), by Types 2025 & 2033
- Figure 24: Middle East & Africa CTC Detection Revenue (billion), by Country 2025 & 2033
- Figure 25: Middle East & Africa CTC Detection Revenue Share (%), by Country 2025 & 2033
- Figure 26: Asia Pacific CTC Detection Revenue (billion), by Application 2025 & 2033
- Figure 27: Asia Pacific CTC Detection Revenue Share (%), by Application 2025 & 2033
- Figure 28: Asia Pacific CTC Detection Revenue (billion), by Types 2025 & 2033
- Figure 29: Asia Pacific CTC Detection Revenue Share (%), by Types 2025 & 2033
- Figure 30: Asia Pacific CTC Detection Revenue (billion), by Country 2025 & 2033
- Figure 31: Asia Pacific CTC Detection Revenue Share (%), by Country 2025 & 2033
List of Tables
- Table 1: Global CTC Detection Revenue billion Forecast, by Application 2020 & 2033
- Table 2: Global CTC Detection Revenue billion Forecast, by Types 2020 & 2033
- Table 3: Global CTC Detection Revenue billion Forecast, by Region 2020 & 2033
- Table 4: Global CTC Detection Revenue billion Forecast, by Application 2020 & 2033
- Table 5: Global CTC Detection Revenue billion Forecast, by Types 2020 & 2033
- Table 6: Global CTC Detection Revenue billion Forecast, by Country 2020 & 2033
- Table 7: United States CTC Detection Revenue (billion) Forecast, by Application 2020 & 2033
- Table 8: Canada CTC Detection Revenue (billion) Forecast, by Application 2020 & 2033
- Table 9: Mexico CTC Detection Revenue (billion) Forecast, by Application 2020 & 2033
- Table 10: Global CTC Detection Revenue billion Forecast, by Application 2020 & 2033
- Table 11: Global CTC Detection Revenue billion Forecast, by Types 2020 & 2033
- Table 12: Global CTC Detection Revenue billion Forecast, by Country 2020 & 2033
- Table 13: Brazil CTC Detection Revenue (billion) Forecast, by Application 2020 & 2033
- Table 14: Argentina CTC Detection Revenue (billion) Forecast, by Application 2020 & 2033
- Table 15: Rest of South America CTC Detection Revenue (billion) Forecast, by Application 2020 & 2033
- Table 16: Global CTC Detection Revenue billion Forecast, by Application 2020 & 2033
- Table 17: Global CTC Detection Revenue billion Forecast, by Types 2020 & 2033
- Table 18: Global CTC Detection Revenue billion Forecast, by Country 2020 & 2033
- Table 19: United Kingdom CTC Detection Revenue (billion) Forecast, by Application 2020 & 2033
- Table 20: Germany CTC Detection Revenue (billion) Forecast, by Application 2020 & 2033
- Table 21: France CTC Detection Revenue (billion) Forecast, by Application 2020 & 2033
- Table 22: Italy CTC Detection Revenue (billion) Forecast, by Application 2020 & 2033
- Table 23: Spain CTC Detection Revenue (billion) Forecast, by Application 2020 & 2033
- Table 24: Russia CTC Detection Revenue (billion) Forecast, by Application 2020 & 2033
- Table 25: Benelux CTC Detection Revenue (billion) Forecast, by Application 2020 & 2033
- Table 26: Nordics CTC Detection Revenue (billion) Forecast, by Application 2020 & 2033
- Table 27: Rest of Europe CTC Detection Revenue (billion) Forecast, by Application 2020 & 2033
- Table 28: Global CTC Detection Revenue billion Forecast, by Application 2020 & 2033
- Table 29: Global CTC Detection Revenue billion Forecast, by Types 2020 & 2033
- Table 30: Global CTC Detection Revenue billion Forecast, by Country 2020 & 2033
- Table 31: Turkey CTC Detection Revenue (billion) Forecast, by Application 2020 & 2033
- Table 32: Israel CTC Detection Revenue (billion) Forecast, by Application 2020 & 2033
- Table 33: GCC CTC Detection Revenue (billion) Forecast, by Application 2020 & 2033
- Table 34: North Africa CTC Detection Revenue (billion) Forecast, by Application 2020 & 2033
- Table 35: South Africa CTC Detection Revenue (billion) Forecast, by Application 2020 & 2033
- Table 36: Rest of Middle East & Africa CTC Detection Revenue (billion) Forecast, by Application 2020 & 2033
- Table 37: Global CTC Detection Revenue billion Forecast, by Application 2020 & 2033
- Table 38: Global CTC Detection Revenue billion Forecast, by Types 2020 & 2033
- Table 39: Global CTC Detection Revenue billion Forecast, by Country 2020 & 2033
- Table 40: China CTC Detection Revenue (billion) Forecast, by Application 2020 & 2033
- Table 41: India CTC Detection Revenue (billion) Forecast, by Application 2020 & 2033
- Table 42: Japan CTC Detection Revenue (billion) Forecast, by Application 2020 & 2033
- Table 43: South Korea CTC Detection Revenue (billion) Forecast, by Application 2020 & 2033
- Table 44: ASEAN CTC Detection Revenue (billion) Forecast, by Application 2020 & 2033
- Table 45: Oceania CTC Detection Revenue (billion) Forecast, by Application 2020 & 2033
- Table 46: Rest of Asia Pacific CTC Detection Revenue (billion) Forecast, by Application 2020 & 2033
Frequently Asked Questions
1. What is the projected Compound Annual Growth Rate (CAGR) of the CTC Detection?
The projected CAGR is approximately 13.92%.
2. Which companies are prominent players in the CTC Detection?
Key companies in the market include Bio-Rad, Roche, Biocartis, Qiagen, Guardant Health, MDxHealth, Johnson & Johnson, NeoGenomics Laboraories, Guangzhou Wondfo Biotech, TOPGEN, Surexam Bio Tech, Wuhan Yzy Medical Science&Technology, GenoSaber Biotech, BGI Genomics.
3. What are the main segments of the CTC Detection?
The market segments include Application, Types.
4. Can you provide details about the market size?
The market size is estimated to be USD 14.04 billion as of 2022.
5. What are some drivers contributing to market growth?
N/A
6. What are the notable trends driving market growth?
N/A
7. Are there any restraints impacting market growth?
N/A
8. Can you provide examples of recent developments in the market?
N/A
9. What pricing options are available for accessing the report?
Pricing options include single-user, multi-user, and enterprise licenses priced at USD 2900.00, USD 4350.00, and USD 5800.00 respectively.
10. Is the market size provided in terms of value or volume?
The market size is provided in terms of value, measured in billion.
11. Are there any specific market keywords associated with the report?
Yes, the market keyword associated with the report is "CTC Detection," which aids in identifying and referencing the specific market segment covered.
12. How do I determine which pricing option suits my needs best?
The pricing options vary based on user requirements and access needs. Individual users may opt for single-user licenses, while businesses requiring broader access may choose multi-user or enterprise licenses for cost-effective access to the report.
13. Are there any additional resources or data provided in the CTC Detection report?
While the report offers comprehensive insights, it's advisable to review the specific contents or supplementary materials provided to ascertain if additional resources or data are available.
14. How can I stay updated on further developments or reports in the CTC Detection?
To stay informed about further developments, trends, and reports in the CTC Detection, consider subscribing to industry newsletters, following relevant companies and organizations, or regularly checking reputable industry news sources and publications.
Methodology
Step 1 - Identification of Relevant Samples Size from Population Database


Step 2 - Approaches for Defining Global Market Size (Value, Volume* & Price*)

Note*: In applicable scenarios
Step 3 - Data Sources
Primary Research
- Web Analytics
- Survey Reports
- Research Institute
- Latest Research Reports
- Opinion Leaders
Secondary Research
- Annual Reports
- White Paper
- Latest Press Release
- Industry Association
- Paid Database
- Investor Presentations

Step 4 - Data Triangulation
Involves using different sources of information in order to increase the validity of a study
These sources are likely to be stakeholders in a program - participants, other researchers, program staff, other community members, and so on.
Then we put all data in single framework & apply various statistical tools to find out the dynamic on the market.
During the analysis stage, feedback from the stakeholder groups would be compared to determine areas of agreement as well as areas of divergence