

Key Insights
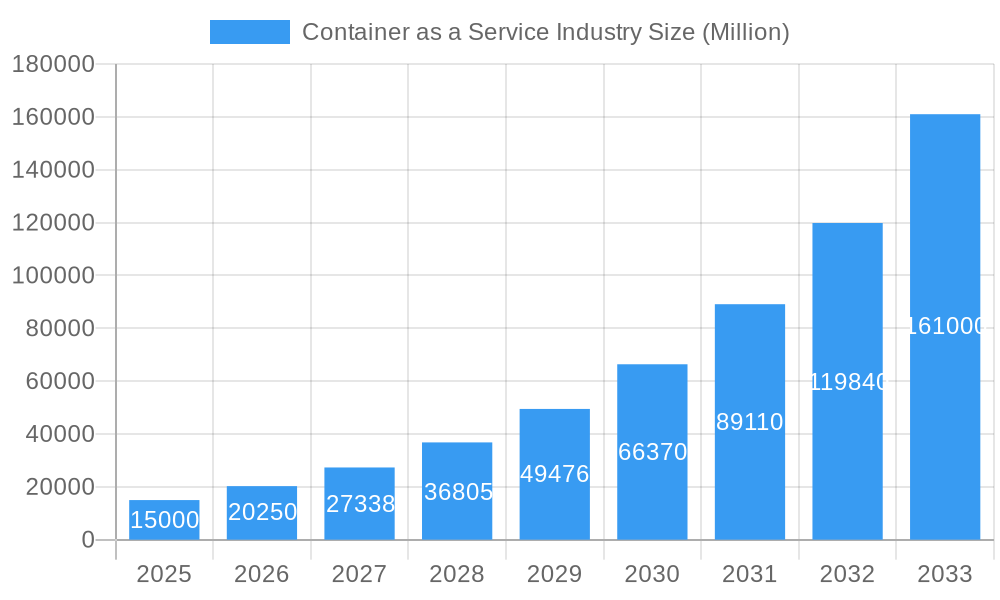
The Container as a Service (CaaS) market is projected for significant expansion, driven by the escalating adoption of cloud-native applications and microservices architectures. Expected to achieve a Compound Annual Growth Rate (CAGR) of 32.1% from 2025 to 2033, the market size is forecast to reach $4.09 billion. Key growth drivers include the demand for enhanced application agility and scalability, efficient resource utilization, and simplified management of complex modern applications. The transition to cloud-based deployments, offering superior flexibility and cost-effectiveness, is a primary catalyst. Further acceleration is attributed to the widespread adoption of DevOps practices and container orchestration platforms like Kubernetes. Large enterprises are spearheading adoption, with small and medium-sized businesses increasingly recognizing CaaS benefits. Prominent end-user segments include BFSI, Retail, and IT & Telecommunications.
Container as a Service Industry Market Size (In Billion)
Despite robust growth potential, challenges persist, including security concerns in containerized environments and the complexity of cross-platform management. A skills gap in managing containerized infrastructure also presents a hurdle. However, continuous innovation by vendors in security, user-friendly management tools, and enhanced integration capabilities are actively mitigating these issues. The competitive landscape features major cloud providers such as Amazon Web Services, Microsoft Azure, and Google Cloud, alongside established IT firms and specialized CaaS providers, fostering innovation and competitive pricing. Geographically, North America and Asia Pacific are leading growth, with Europe and other regions also demonstrating promising expansion.
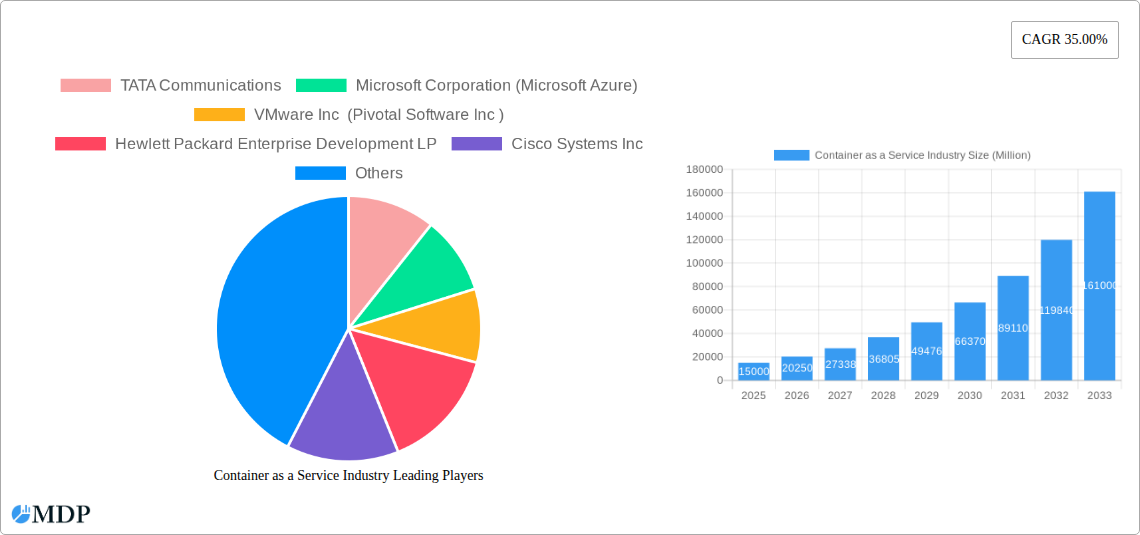
Container as a Service Industry Company Market Share
Container as a Service (CaaS) Industry Market Report: 2019-2033
This comprehensive report provides a detailed analysis of the Container as a Service (CaaS) industry, offering invaluable insights for stakeholders seeking to navigate this rapidly evolving market. The report covers the period 2019-2033, with a focus on the estimated year 2025, and incorporates key market trends, competitive landscapes, and future growth projections. The market is valued at $XX Million in 2025 and is projected to reach $XX Million by 2033, exhibiting a CAGR of XX%.
Container as a Service Industry Market Dynamics & Concentration
The CaaS market is characterized by a dynamic interplay of factors influencing its growth and concentration. The industry exhibits moderate concentration, with key players holding significant market share, but also witnessing considerable competition from emerging players. The market share of the top 5 players is estimated to be around XX% in 2025.
Market Concentration: The top 10 players, including TATA Communications, Microsoft Azure, VMware, Hewlett Packard Enterprise, Cisco Systems, Rancher Labs, IBM (Red Hat), Amazon Web Services, Google Cloud, Oracle Corporation, and SUSE, collectively control a substantial portion of the market. However, the landscape is becoming increasingly fragmented with the entry of new players and niche providers.
Innovation Drivers: Continuous advancements in container orchestration technologies (e.g., Kubernetes), improved security features, and the increasing adoption of microservices architecture are driving market growth.
Regulatory Frameworks: While largely unregulated, evolving data privacy and security regulations influence CaaS adoption, particularly in sensitive sectors like BFSI.
Product Substitutes: Virtual machines (VMs) remain a viable alternative, but the advantages of CaaS in terms of agility, scalability, and resource efficiency are fueling market shift.
End-User Trends: The increasing adoption of cloud-native applications and the need for faster application deployment cycles are key drivers of CaaS demand across various industries.
M&A Activities: The CaaS market has witnessed several mergers and acquisitions in recent years, with an estimated XX M&A deals in the historical period (2019-2024). These activities are consolidating the market and enhancing the capabilities of leading players.
Container as a Service Industry Industry Trends & Analysis
The CaaS market is experiencing robust growth, driven by several key trends. The market's expansion is fueled by the growing adoption of cloud-native applications, the increasing demand for scalability and agility in IT infrastructure, and the rising adoption of DevOps practices. The shift towards microservices architecture, where applications are broken down into smaller, independently deployable units, further fuels the demand for CaaS.
The market's CAGR during the forecast period (2025-2033) is projected to be XX%, indicating substantial growth potential. Market penetration is increasing across various sectors, with significant adoption in IT & Telecommunications, BFSI, and Retail, contributing to the overall growth. Technological disruptions like serverless computing and edge computing are creating new opportunities and influencing CaaS adoption patterns. Consumer preference for faster application deployments, improved security, and reduced operational costs is driving the market toward CaaS solutions. Competitive dynamics are characterized by ongoing innovation, strategic partnerships, and intense competition among established players and emerging startups. The market is expected to witness increased consolidation through mergers and acquisitions in the coming years.
Leading Markets & Segments in Container as a Service Industry
The global CaaS market is witnessing significant growth across various regions and segments.
Dominant Region: North America currently holds the largest market share, driven by high cloud adoption rates and robust IT spending. However, Asia-Pacific is projected to experience the highest CAGR during the forecast period.
By Deployment: The cloud deployment model dominates the CaaS market, primarily due to the scalability, flexibility, and cost-effectiveness it offers. However, on-premise deployment remains relevant for enterprises with stringent security or regulatory compliance requirements.
By Service Type: Managed services are the leading segment, owing to the ease of use and reduced operational burden they provide to end-users. Professional services, including consulting and implementation, play a crucial role in successful CaaS adoption.
By Size of Enterprise: Large enterprises are currently the dominant segment due to their higher IT budgets and greater need for scalability and flexibility. However, SMEs are increasingly adopting CaaS, driven by its cost-effectiveness and ease of use.
By End-user Application: IT & Telecommunications, BFSI, and Retail sectors are leading adopters of CaaS, driven by their need for rapid application development and deployment. Manufacturing and other end-user applications are also showing significant growth potential.
Key Drivers (by segment):
- North America: Strong technological infrastructure, high IT spending, and early adoption of cloud technologies.
- Asia-Pacific: Rapid digital transformation, growing IT infrastructure investments, and increasing adoption of cloud services.
- Cloud Deployment: Scalability, flexibility, cost-effectiveness, and ease of management.
- Managed Services: Reduced operational burden, ease of use, and optimized performance.
- Large Enterprises: High IT budgets, complex application landscapes, and need for scalability.
Container as a Service Industry Product Developments
Recent product innovations focus on enhancing security, improving performance, and simplifying management. New features include improved container orchestration, enhanced security measures, and seamless integration with other cloud services. These advancements are improving the market fit by addressing critical user needs and driving wider adoption across various sectors. Technological trends like serverless computing and edge computing are influencing product development, creating new opportunities for CaaS providers.
Key Drivers of Container as a Service Industry Growth
Several factors are driving the growth of the CaaS market:
Technological Advancements: Innovations in containerization technologies, orchestration platforms (like Kubernetes), and microservices architecture are significantly boosting market growth.
Economic Factors: The cost-effectiveness and scalability of CaaS solutions make them attractive to businesses of all sizes.
Regulatory Changes: While not heavily regulated, evolving data privacy and security regulations are influencing the development of secure and compliant CaaS solutions.
Challenges in the Container as a Service Industry Market
Despite its growth potential, the CaaS market faces certain challenges:
Security Concerns: Ensuring the security and integrity of containerized applications remains a major concern. Breaches could lead to significant financial losses, estimated to cost companies an average of $XX Million per incident.
Complexity: Managing and deploying containerized applications can be complex, especially for organizations lacking the necessary expertise. This complexity can lead to increased implementation costs and delays, potentially impacting project timelines by XX%.
Integration Challenges: Integrating CaaS solutions with existing IT infrastructure can be challenging, requiring significant effort and expertise.
Emerging Opportunities in Container as a Service Industry
The CaaS market presents several exciting opportunities:
Serverless Computing Integration: Integrating CaaS with serverless computing platforms is creating new avenues for growth by enabling even greater scalability and efficiency.
Edge Computing Adoption: The expansion of edge computing creates opportunities for deploying containerized applications closer to the data source, improving performance and reducing latency.
Strategic Partnerships: Collaborations between CaaS providers and other technology vendors will expand the reach and capabilities of CaaS solutions.
Leading Players in the Container as a Service Industry Sector
- TATA Communications
- Microsoft Corporation (Microsoft Azure)
- VMware Inc (Pivotal Software Inc)
- Hewlett Packard Enterprise Development LP
- Cisco Systems Inc
- Rancher Labs
- IBM Corporation (Red Hat Inc)
- Amazon Web Services Inc
- Google LLC (Google Cloud)
- Oracle Corporation
- SUSE
- Rackspace Inc
Key Milestones in Container as a Service Industry Industry
October 2022: Nokia partners with Kinetic by Windstream, marking a significant adoption of containerized applications in the telecommunications sector. This deployment on 300,000 Nokia Beacon 6 devices showcases CaaS scalability within large-scale deployments.
November 2022: Sylabs' Singularity container runtime suite gains support within the Nimbix Federated supercomputing suite, expanding CaaS applications into high-performance computing, potentially opening new revenue streams for HPC centers and research institutions.
Strategic Outlook for Container as a Service Industry Market
The CaaS market is poised for significant growth in the coming years, driven by continued technological advancements, expanding cloud adoption, and the increasing demand for agile and scalable IT infrastructure. Strategic opportunities lie in developing innovative solutions, fostering strategic partnerships, and expanding into emerging markets. The focus on enhanced security, simplified management, and integration with other cloud services will be crucial for success in this competitive landscape.
Container as a Service Industry Segmentation
-
1. Deployment
- 1.1. On-Premise
- 1.2. Cloud
-
2. Service Type
- 2.1. Professional Services
- 2.2. Managed Services
-
3. Size of the Enterprise
- 3.1. Small and Medium Enterprises
- 3.2. Large Enterprises
-
4. End-user Application
- 4.1. BFSI
- 4.2. Retail
- 4.3. IT & Telecommunications
- 4.4. Manufacturing
- 4.5. Other End-user Applications
Container as a Service Industry Segmentation By Geography
-
1. North America
- 1.1. United States
- 1.2. Canada
-
2. Europe
- 2.1. United Kingdom
- 2.2. Germany
- 2.3. France
- 2.4. Rest of Europe
-
3. Asia Pacific
- 3.1. China
- 3.2. Australia
- 3.3. Japan
- 3.4. Rest of Asia Pacific
-
4. Latin America
- 4.1. Mexico
- 4.2. Brazil
- 4.3. Rest of Latin America
- 5. Middle East
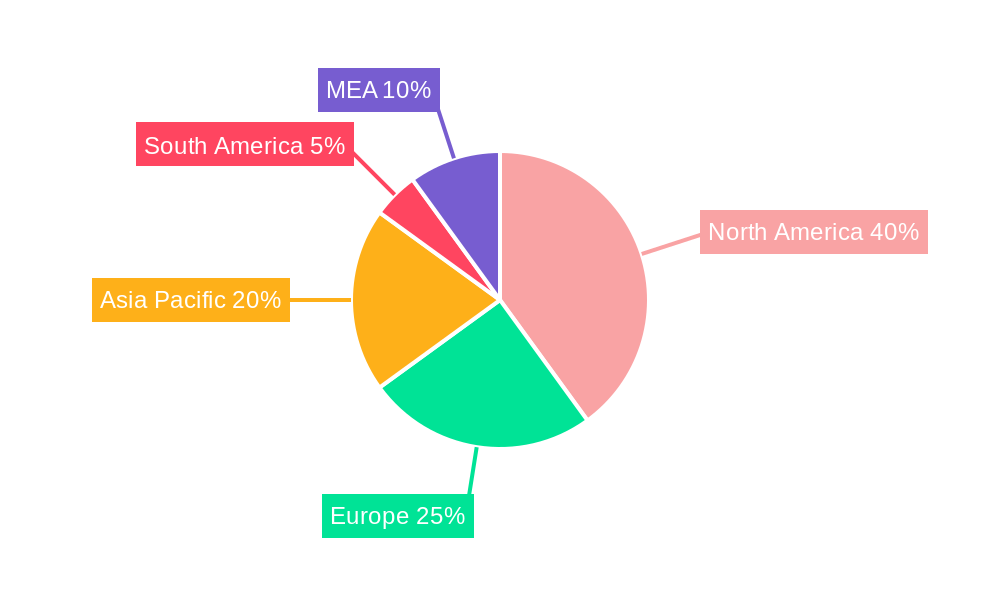
Container as a Service Industry Regional Market Share
Geographic Coverage of Container as a Service Industry
Container as a Service Industry REPORT HIGHLIGHTS
| Aspects | Details |
|---|---|
| Study Period | 2020-2034 |
| Base Year | 2025 |
| Estimated Year | 2026 |
| Forecast Period | 2026-2034 |
| Historical Period | 2020-2025 |
| Growth Rate | CAGR of 32.1% from 2020-2034 |
| Segmentation |
|
Table of Contents
- 1. Introduction
- 1.1. Research Scope
- 1.2. Market Segmentation
- 1.3. Research Methodology
- 1.4. Definitions and Assumptions
- 2. Executive Summary
- 2.1. Introduction
- 3. Market Dynamics
- 3.1. Introduction
- 3.2. Market Drivers
- 3.2.1. Benefits of Cost Effectiveness and Increased Productivity; Greater Flexibility Than On-Premises Containers; Increasing Popularity of Microservices
- 3.3. Market Restrains
- 3.3.1. Difficulty in Achieving Security and Compliance
- 3.4. Market Trends
- 3.4.1. BFSI Sector Expected to Have Maximum Application
- 4. Market Factor Analysis
- 4.1. Porters Five Forces
- 4.2. Supply/Value Chain
- 4.3. PESTEL analysis
- 4.4. Market Entropy
- 4.5. Patent/Trademark Analysis
- 5. Global Container as a Service Industry Analysis, Insights and Forecast, 2020-2032
- 5.1. Market Analysis, Insights and Forecast - by Deployment
- 5.1.1. On-Premise
- 5.1.2. Cloud
- 5.2. Market Analysis, Insights and Forecast - by Service Type
- 5.2.1. Professional Services
- 5.2.2. Managed Services
- 5.3. Market Analysis, Insights and Forecast - by Size of the Enterprise
- 5.3.1. Small and Medium Enterprises
- 5.3.2. Large Enterprises
- 5.4. Market Analysis, Insights and Forecast - by End-user Application
- 5.4.1. BFSI
- 5.4.2. Retail
- 5.4.3. IT & Telecommunications
- 5.4.4. Manufacturing
- 5.4.5. Other End-user Applications
- 5.5. Market Analysis, Insights and Forecast - by Region
- 5.5.1. North America
- 5.5.2. Europe
- 5.5.3. Asia Pacific
- 5.5.4. Latin America
- 5.5.5. Middle East
- 5.1. Market Analysis, Insights and Forecast - by Deployment
- 6. North America Container as a Service Industry Analysis, Insights and Forecast, 2020-2032
- 6.1. Market Analysis, Insights and Forecast - by Deployment
- 6.1.1. On-Premise
- 6.1.2. Cloud
- 6.2. Market Analysis, Insights and Forecast - by Service Type
- 6.2.1. Professional Services
- 6.2.2. Managed Services
- 6.3. Market Analysis, Insights and Forecast - by Size of the Enterprise
- 6.3.1. Small and Medium Enterprises
- 6.3.2. Large Enterprises
- 6.4. Market Analysis, Insights and Forecast - by End-user Application
- 6.4.1. BFSI
- 6.4.2. Retail
- 6.4.3. IT & Telecommunications
- 6.4.4. Manufacturing
- 6.4.5. Other End-user Applications
- 6.1. Market Analysis, Insights and Forecast - by Deployment
- 7. Europe Container as a Service Industry Analysis, Insights and Forecast, 2020-2032
- 7.1. Market Analysis, Insights and Forecast - by Deployment
- 7.1.1. On-Premise
- 7.1.2. Cloud
- 7.2. Market Analysis, Insights and Forecast - by Service Type
- 7.2.1. Professional Services
- 7.2.2. Managed Services
- 7.3. Market Analysis, Insights and Forecast - by Size of the Enterprise
- 7.3.1. Small and Medium Enterprises
- 7.3.2. Large Enterprises
- 7.4. Market Analysis, Insights and Forecast - by End-user Application
- 7.4.1. BFSI
- 7.4.2. Retail
- 7.4.3. IT & Telecommunications
- 7.4.4. Manufacturing
- 7.4.5. Other End-user Applications
- 7.1. Market Analysis, Insights and Forecast - by Deployment
- 8. Asia Pacific Container as a Service Industry Analysis, Insights and Forecast, 2020-2032
- 8.1. Market Analysis, Insights and Forecast - by Deployment
- 8.1.1. On-Premise
- 8.1.2. Cloud
- 8.2. Market Analysis, Insights and Forecast - by Service Type
- 8.2.1. Professional Services
- 8.2.2. Managed Services
- 8.3. Market Analysis, Insights and Forecast - by Size of the Enterprise
- 8.3.1. Small and Medium Enterprises
- 8.3.2. Large Enterprises
- 8.4. Market Analysis, Insights and Forecast - by End-user Application
- 8.4.1. BFSI
- 8.4.2. Retail
- 8.4.3. IT & Telecommunications
- 8.4.4. Manufacturing
- 8.4.5. Other End-user Applications
- 8.1. Market Analysis, Insights and Forecast - by Deployment
- 9. Latin America Container as a Service Industry Analysis, Insights and Forecast, 2020-2032
- 9.1. Market Analysis, Insights and Forecast - by Deployment
- 9.1.1. On-Premise
- 9.1.2. Cloud
- 9.2. Market Analysis, Insights and Forecast - by Service Type
- 9.2.1. Professional Services
- 9.2.2. Managed Services
- 9.3. Market Analysis, Insights and Forecast - by Size of the Enterprise
- 9.3.1. Small and Medium Enterprises
- 9.3.2. Large Enterprises
- 9.4. Market Analysis, Insights and Forecast - by End-user Application
- 9.4.1. BFSI
- 9.4.2. Retail
- 9.4.3. IT & Telecommunications
- 9.4.4. Manufacturing
- 9.4.5. Other End-user Applications
- 9.1. Market Analysis, Insights and Forecast - by Deployment
- 10. Middle East Container as a Service Industry Analysis, Insights and Forecast, 2020-2032
- 10.1. Market Analysis, Insights and Forecast - by Deployment
- 10.1.1. On-Premise
- 10.1.2. Cloud
- 10.2. Market Analysis, Insights and Forecast - by Service Type
- 10.2.1. Professional Services
- 10.2.2. Managed Services
- 10.3. Market Analysis, Insights and Forecast - by Size of the Enterprise
- 10.3.1. Small and Medium Enterprises
- 10.3.2. Large Enterprises
- 10.4. Market Analysis, Insights and Forecast - by End-user Application
- 10.4.1. BFSI
- 10.4.2. Retail
- 10.4.3. IT & Telecommunications
- 10.4.4. Manufacturing
- 10.4.5. Other End-user Applications
- 10.1. Market Analysis, Insights and Forecast - by Deployment
- 11. Competitive Analysis
- 11.1. Global Market Share Analysis 2025
- 11.2. Company Profiles
- 11.2.1 TATA Communications
- 11.2.1.1. Overview
- 11.2.1.2. Products
- 11.2.1.3. SWOT Analysis
- 11.2.1.4. Recent Developments
- 11.2.1.5. Financials (Based on Availability)
- 11.2.2 Microsoft Corporation (Microsoft Azure)
- 11.2.2.1. Overview
- 11.2.2.2. Products
- 11.2.2.3. SWOT Analysis
- 11.2.2.4. Recent Developments
- 11.2.2.5. Financials (Based on Availability)
- 11.2.3 VMware Inc (Pivotal Software Inc )
- 11.2.3.1. Overview
- 11.2.3.2. Products
- 11.2.3.3. SWOT Analysis
- 11.2.3.4. Recent Developments
- 11.2.3.5. Financials (Based on Availability)
- 11.2.4 Hewlett Packard Enterprise Development LP
- 11.2.4.1. Overview
- 11.2.4.2. Products
- 11.2.4.3. SWOT Analysis
- 11.2.4.4. Recent Developments
- 11.2.4.5. Financials (Based on Availability)
- 11.2.5 Cisco Systems Inc
- 11.2.5.1. Overview
- 11.2.5.2. Products
- 11.2.5.3. SWOT Analysis
- 11.2.5.4. Recent Developments
- 11.2.5.5. Financials (Based on Availability)
- 11.2.6 Rancher Labs
- 11.2.6.1. Overview
- 11.2.6.2. Products
- 11.2.6.3. SWOT Analysis
- 11.2.6.4. Recent Developments
- 11.2.6.5. Financials (Based on Availability)
- 11.2.7 IBM Corporation (Red Hat Inc )
- 11.2.7.1. Overview
- 11.2.7.2. Products
- 11.2.7.3. SWOT Analysis
- 11.2.7.4. Recent Developments
- 11.2.7.5. Financials (Based on Availability)
- 11.2.8 Amazon Web Services Inc
- 11.2.8.1. Overview
- 11.2.8.2. Products
- 11.2.8.3. SWOT Analysis
- 11.2.8.4. Recent Developments
- 11.2.8.5. Financials (Based on Availability)
- 11.2.9 Google LLC (Google Cloud)
- 11.2.9.1. Overview
- 11.2.9.2. Products
- 11.2.9.3. SWOT Analysis
- 11.2.9.4. Recent Developments
- 11.2.9.5. Financials (Based on Availability)
- 11.2.10 Oracle Corporation
- 11.2.10.1. Overview
- 11.2.10.2. Products
- 11.2.10.3. SWOT Analysis
- 11.2.10.4. Recent Developments
- 11.2.10.5. Financials (Based on Availability)
- 11.2.11 SUSE
- 11.2.11.1. Overview
- 11.2.11.2. Products
- 11.2.11.3. SWOT Analysis
- 11.2.11.4. Recent Developments
- 11.2.11.5. Financials (Based on Availability)
- 11.2.12 Rackspace Inc
- 11.2.12.1. Overview
- 11.2.12.2. Products
- 11.2.12.3. SWOT Analysis
- 11.2.12.4. Recent Developments
- 11.2.12.5. Financials (Based on Availability)
- 11.2.1 TATA Communications
List of Figures
- Figure 1: Global Container as a Service Industry Revenue Breakdown (billion, %) by Region 2025 & 2033
- Figure 2: Global Container as a Service Industry Volume Breakdown (K Unit, %) by Region 2025 & 2033
- Figure 3: North America Container as a Service Industry Revenue (billion), by Deployment 2025 & 2033
- Figure 4: North America Container as a Service Industry Volume (K Unit), by Deployment 2025 & 2033
- Figure 5: North America Container as a Service Industry Revenue Share (%), by Deployment 2025 & 2033
- Figure 6: North America Container as a Service Industry Volume Share (%), by Deployment 2025 & 2033
- Figure 7: North America Container as a Service Industry Revenue (billion), by Service Type 2025 & 2033
- Figure 8: North America Container as a Service Industry Volume (K Unit), by Service Type 2025 & 2033
- Figure 9: North America Container as a Service Industry Revenue Share (%), by Service Type 2025 & 2033
- Figure 10: North America Container as a Service Industry Volume Share (%), by Service Type 2025 & 2033
- Figure 11: North America Container as a Service Industry Revenue (billion), by Size of the Enterprise 2025 & 2033
- Figure 12: North America Container as a Service Industry Volume (K Unit), by Size of the Enterprise 2025 & 2033
- Figure 13: North America Container as a Service Industry Revenue Share (%), by Size of the Enterprise 2025 & 2033
- Figure 14: North America Container as a Service Industry Volume Share (%), by Size of the Enterprise 2025 & 2033
- Figure 15: North America Container as a Service Industry Revenue (billion), by End-user Application 2025 & 2033
- Figure 16: North America Container as a Service Industry Volume (K Unit), by End-user Application 2025 & 2033
- Figure 17: North America Container as a Service Industry Revenue Share (%), by End-user Application 2025 & 2033
- Figure 18: North America Container as a Service Industry Volume Share (%), by End-user Application 2025 & 2033
- Figure 19: North America Container as a Service Industry Revenue (billion), by Country 2025 & 2033
- Figure 20: North America Container as a Service Industry Volume (K Unit), by Country 2025 & 2033
- Figure 21: North America Container as a Service Industry Revenue Share (%), by Country 2025 & 2033
- Figure 22: North America Container as a Service Industry Volume Share (%), by Country 2025 & 2033
- Figure 23: Europe Container as a Service Industry Revenue (billion), by Deployment 2025 & 2033
- Figure 24: Europe Container as a Service Industry Volume (K Unit), by Deployment 2025 & 2033
- Figure 25: Europe Container as a Service Industry Revenue Share (%), by Deployment 2025 & 2033
- Figure 26: Europe Container as a Service Industry Volume Share (%), by Deployment 2025 & 2033
- Figure 27: Europe Container as a Service Industry Revenue (billion), by Service Type 2025 & 2033
- Figure 28: Europe Container as a Service Industry Volume (K Unit), by Service Type 2025 & 2033
- Figure 29: Europe Container as a Service Industry Revenue Share (%), by Service Type 2025 & 2033
- Figure 30: Europe Container as a Service Industry Volume Share (%), by Service Type 2025 & 2033
- Figure 31: Europe Container as a Service Industry Revenue (billion), by Size of the Enterprise 2025 & 2033
- Figure 32: Europe Container as a Service Industry Volume (K Unit), by Size of the Enterprise 2025 & 2033
- Figure 33: Europe Container as a Service Industry Revenue Share (%), by Size of the Enterprise 2025 & 2033
- Figure 34: Europe Container as a Service Industry Volume Share (%), by Size of the Enterprise 2025 & 2033
- Figure 35: Europe Container as a Service Industry Revenue (billion), by End-user Application 2025 & 2033
- Figure 36: Europe Container as a Service Industry Volume (K Unit), by End-user Application 2025 & 2033
- Figure 37: Europe Container as a Service Industry Revenue Share (%), by End-user Application 2025 & 2033
- Figure 38: Europe Container as a Service Industry Volume Share (%), by End-user Application 2025 & 2033
- Figure 39: Europe Container as a Service Industry Revenue (billion), by Country 2025 & 2033
- Figure 40: Europe Container as a Service Industry Volume (K Unit), by Country 2025 & 2033
- Figure 41: Europe Container as a Service Industry Revenue Share (%), by Country 2025 & 2033
- Figure 42: Europe Container as a Service Industry Volume Share (%), by Country 2025 & 2033
- Figure 43: Asia Pacific Container as a Service Industry Revenue (billion), by Deployment 2025 & 2033
- Figure 44: Asia Pacific Container as a Service Industry Volume (K Unit), by Deployment 2025 & 2033
- Figure 45: Asia Pacific Container as a Service Industry Revenue Share (%), by Deployment 2025 & 2033
- Figure 46: Asia Pacific Container as a Service Industry Volume Share (%), by Deployment 2025 & 2033
- Figure 47: Asia Pacific Container as a Service Industry Revenue (billion), by Service Type 2025 & 2033
- Figure 48: Asia Pacific Container as a Service Industry Volume (K Unit), by Service Type 2025 & 2033
- Figure 49: Asia Pacific Container as a Service Industry Revenue Share (%), by Service Type 2025 & 2033
- Figure 50: Asia Pacific Container as a Service Industry Volume Share (%), by Service Type 2025 & 2033
- Figure 51: Asia Pacific Container as a Service Industry Revenue (billion), by Size of the Enterprise 2025 & 2033
- Figure 52: Asia Pacific Container as a Service Industry Volume (K Unit), by Size of the Enterprise 2025 & 2033
- Figure 53: Asia Pacific Container as a Service Industry Revenue Share (%), by Size of the Enterprise 2025 & 2033
- Figure 54: Asia Pacific Container as a Service Industry Volume Share (%), by Size of the Enterprise 2025 & 2033
- Figure 55: Asia Pacific Container as a Service Industry Revenue (billion), by End-user Application 2025 & 2033
- Figure 56: Asia Pacific Container as a Service Industry Volume (K Unit), by End-user Application 2025 & 2033
- Figure 57: Asia Pacific Container as a Service Industry Revenue Share (%), by End-user Application 2025 & 2033
- Figure 58: Asia Pacific Container as a Service Industry Volume Share (%), by End-user Application 2025 & 2033
- Figure 59: Asia Pacific Container as a Service Industry Revenue (billion), by Country 2025 & 2033
- Figure 60: Asia Pacific Container as a Service Industry Volume (K Unit), by Country 2025 & 2033
- Figure 61: Asia Pacific Container as a Service Industry Revenue Share (%), by Country 2025 & 2033
- Figure 62: Asia Pacific Container as a Service Industry Volume Share (%), by Country 2025 & 2033
- Figure 63: Latin America Container as a Service Industry Revenue (billion), by Deployment 2025 & 2033
- Figure 64: Latin America Container as a Service Industry Volume (K Unit), by Deployment 2025 & 2033
- Figure 65: Latin America Container as a Service Industry Revenue Share (%), by Deployment 2025 & 2033
- Figure 66: Latin America Container as a Service Industry Volume Share (%), by Deployment 2025 & 2033
- Figure 67: Latin America Container as a Service Industry Revenue (billion), by Service Type 2025 & 2033
- Figure 68: Latin America Container as a Service Industry Volume (K Unit), by Service Type 2025 & 2033
- Figure 69: Latin America Container as a Service Industry Revenue Share (%), by Service Type 2025 & 2033
- Figure 70: Latin America Container as a Service Industry Volume Share (%), by Service Type 2025 & 2033
- Figure 71: Latin America Container as a Service Industry Revenue (billion), by Size of the Enterprise 2025 & 2033
- Figure 72: Latin America Container as a Service Industry Volume (K Unit), by Size of the Enterprise 2025 & 2033
- Figure 73: Latin America Container as a Service Industry Revenue Share (%), by Size of the Enterprise 2025 & 2033
- Figure 74: Latin America Container as a Service Industry Volume Share (%), by Size of the Enterprise 2025 & 2033
- Figure 75: Latin America Container as a Service Industry Revenue (billion), by End-user Application 2025 & 2033
- Figure 76: Latin America Container as a Service Industry Volume (K Unit), by End-user Application 2025 & 2033
- Figure 77: Latin America Container as a Service Industry Revenue Share (%), by End-user Application 2025 & 2033
- Figure 78: Latin America Container as a Service Industry Volume Share (%), by End-user Application 2025 & 2033
- Figure 79: Latin America Container as a Service Industry Revenue (billion), by Country 2025 & 2033
- Figure 80: Latin America Container as a Service Industry Volume (K Unit), by Country 2025 & 2033
- Figure 81: Latin America Container as a Service Industry Revenue Share (%), by Country 2025 & 2033
- Figure 82: Latin America Container as a Service Industry Volume Share (%), by Country 2025 & 2033
- Figure 83: Middle East Container as a Service Industry Revenue (billion), by Deployment 2025 & 2033
- Figure 84: Middle East Container as a Service Industry Volume (K Unit), by Deployment 2025 & 2033
- Figure 85: Middle East Container as a Service Industry Revenue Share (%), by Deployment 2025 & 2033
- Figure 86: Middle East Container as a Service Industry Volume Share (%), by Deployment 2025 & 2033
- Figure 87: Middle East Container as a Service Industry Revenue (billion), by Service Type 2025 & 2033
- Figure 88: Middle East Container as a Service Industry Volume (K Unit), by Service Type 2025 & 2033
- Figure 89: Middle East Container as a Service Industry Revenue Share (%), by Service Type 2025 & 2033
- Figure 90: Middle East Container as a Service Industry Volume Share (%), by Service Type 2025 & 2033
- Figure 91: Middle East Container as a Service Industry Revenue (billion), by Size of the Enterprise 2025 & 2033
- Figure 92: Middle East Container as a Service Industry Volume (K Unit), by Size of the Enterprise 2025 & 2033
- Figure 93: Middle East Container as a Service Industry Revenue Share (%), by Size of the Enterprise 2025 & 2033
- Figure 94: Middle East Container as a Service Industry Volume Share (%), by Size of the Enterprise 2025 & 2033
- Figure 95: Middle East Container as a Service Industry Revenue (billion), by End-user Application 2025 & 2033
- Figure 96: Middle East Container as a Service Industry Volume (K Unit), by End-user Application 2025 & 2033
- Figure 97: Middle East Container as a Service Industry Revenue Share (%), by End-user Application 2025 & 2033
- Figure 98: Middle East Container as a Service Industry Volume Share (%), by End-user Application 2025 & 2033
- Figure 99: Middle East Container as a Service Industry Revenue (billion), by Country 2025 & 2033
- Figure 100: Middle East Container as a Service Industry Volume (K Unit), by Country 2025 & 2033
- Figure 101: Middle East Container as a Service Industry Revenue Share (%), by Country 2025 & 2033
- Figure 102: Middle East Container as a Service Industry Volume Share (%), by Country 2025 & 2033
List of Tables
- Table 1: Global Container as a Service Industry Revenue billion Forecast, by Deployment 2020 & 2033
- Table 2: Global Container as a Service Industry Volume K Unit Forecast, by Deployment 2020 & 2033
- Table 3: Global Container as a Service Industry Revenue billion Forecast, by Service Type 2020 & 2033
- Table 4: Global Container as a Service Industry Volume K Unit Forecast, by Service Type 2020 & 2033
- Table 5: Global Container as a Service Industry Revenue billion Forecast, by Size of the Enterprise 2020 & 2033
- Table 6: Global Container as a Service Industry Volume K Unit Forecast, by Size of the Enterprise 2020 & 2033
- Table 7: Global Container as a Service Industry Revenue billion Forecast, by End-user Application 2020 & 2033
- Table 8: Global Container as a Service Industry Volume K Unit Forecast, by End-user Application 2020 & 2033
- Table 9: Global Container as a Service Industry Revenue billion Forecast, by Region 2020 & 2033
- Table 10: Global Container as a Service Industry Volume K Unit Forecast, by Region 2020 & 2033
- Table 11: Global Container as a Service Industry Revenue billion Forecast, by Deployment 2020 & 2033
- Table 12: Global Container as a Service Industry Volume K Unit Forecast, by Deployment 2020 & 2033
- Table 13: Global Container as a Service Industry Revenue billion Forecast, by Service Type 2020 & 2033
- Table 14: Global Container as a Service Industry Volume K Unit Forecast, by Service Type 2020 & 2033
- Table 15: Global Container as a Service Industry Revenue billion Forecast, by Size of the Enterprise 2020 & 2033
- Table 16: Global Container as a Service Industry Volume K Unit Forecast, by Size of the Enterprise 2020 & 2033
- Table 17: Global Container as a Service Industry Revenue billion Forecast, by End-user Application 2020 & 2033
- Table 18: Global Container as a Service Industry Volume K Unit Forecast, by End-user Application 2020 & 2033
- Table 19: Global Container as a Service Industry Revenue billion Forecast, by Country 2020 & 2033
- Table 20: Global Container as a Service Industry Volume K Unit Forecast, by Country 2020 & 2033
- Table 21: United States Container as a Service Industry Revenue (billion) Forecast, by Application 2020 & 2033
- Table 22: United States Container as a Service Industry Volume (K Unit) Forecast, by Application 2020 & 2033
- Table 23: Canada Container as a Service Industry Revenue (billion) Forecast, by Application 2020 & 2033
- Table 24: Canada Container as a Service Industry Volume (K Unit) Forecast, by Application 2020 & 2033
- Table 25: Global Container as a Service Industry Revenue billion Forecast, by Deployment 2020 & 2033
- Table 26: Global Container as a Service Industry Volume K Unit Forecast, by Deployment 2020 & 2033
- Table 27: Global Container as a Service Industry Revenue billion Forecast, by Service Type 2020 & 2033
- Table 28: Global Container as a Service Industry Volume K Unit Forecast, by Service Type 2020 & 2033
- Table 29: Global Container as a Service Industry Revenue billion Forecast, by Size of the Enterprise 2020 & 2033
- Table 30: Global Container as a Service Industry Volume K Unit Forecast, by Size of the Enterprise 2020 & 2033
- Table 31: Global Container as a Service Industry Revenue billion Forecast, by End-user Application 2020 & 2033
- Table 32: Global Container as a Service Industry Volume K Unit Forecast, by End-user Application 2020 & 2033
- Table 33: Global Container as a Service Industry Revenue billion Forecast, by Country 2020 & 2033
- Table 34: Global Container as a Service Industry Volume K Unit Forecast, by Country 2020 & 2033
- Table 35: United Kingdom Container as a Service Industry Revenue (billion) Forecast, by Application 2020 & 2033
- Table 36: United Kingdom Container as a Service Industry Volume (K Unit) Forecast, by Application 2020 & 2033
- Table 37: Germany Container as a Service Industry Revenue (billion) Forecast, by Application 2020 & 2033
- Table 38: Germany Container as a Service Industry Volume (K Unit) Forecast, by Application 2020 & 2033
- Table 39: France Container as a Service Industry Revenue (billion) Forecast, by Application 2020 & 2033
- Table 40: France Container as a Service Industry Volume (K Unit) Forecast, by Application 2020 & 2033
- Table 41: Rest of Europe Container as a Service Industry Revenue (billion) Forecast, by Application 2020 & 2033
- Table 42: Rest of Europe Container as a Service Industry Volume (K Unit) Forecast, by Application 2020 & 2033
- Table 43: Global Container as a Service Industry Revenue billion Forecast, by Deployment 2020 & 2033
- Table 44: Global Container as a Service Industry Volume K Unit Forecast, by Deployment 2020 & 2033
- Table 45: Global Container as a Service Industry Revenue billion Forecast, by Service Type 2020 & 2033
- Table 46: Global Container as a Service Industry Volume K Unit Forecast, by Service Type 2020 & 2033
- Table 47: Global Container as a Service Industry Revenue billion Forecast, by Size of the Enterprise 2020 & 2033
- Table 48: Global Container as a Service Industry Volume K Unit Forecast, by Size of the Enterprise 2020 & 2033
- Table 49: Global Container as a Service Industry Revenue billion Forecast, by End-user Application 2020 & 2033
- Table 50: Global Container as a Service Industry Volume K Unit Forecast, by End-user Application 2020 & 2033
- Table 51: Global Container as a Service Industry Revenue billion Forecast, by Country 2020 & 2033
- Table 52: Global Container as a Service Industry Volume K Unit Forecast, by Country 2020 & 2033
- Table 53: China Container as a Service Industry Revenue (billion) Forecast, by Application 2020 & 2033
- Table 54: China Container as a Service Industry Volume (K Unit) Forecast, by Application 2020 & 2033
- Table 55: Australia Container as a Service Industry Revenue (billion) Forecast, by Application 2020 & 2033
- Table 56: Australia Container as a Service Industry Volume (K Unit) Forecast, by Application 2020 & 2033
- Table 57: Japan Container as a Service Industry Revenue (billion) Forecast, by Application 2020 & 2033
- Table 58: Japan Container as a Service Industry Volume (K Unit) Forecast, by Application 2020 & 2033
- Table 59: Rest of Asia Pacific Container as a Service Industry Revenue (billion) Forecast, by Application 2020 & 2033
- Table 60: Rest of Asia Pacific Container as a Service Industry Volume (K Unit) Forecast, by Application 2020 & 2033
- Table 61: Global Container as a Service Industry Revenue billion Forecast, by Deployment 2020 & 2033
- Table 62: Global Container as a Service Industry Volume K Unit Forecast, by Deployment 2020 & 2033
- Table 63: Global Container as a Service Industry Revenue billion Forecast, by Service Type 2020 & 2033
- Table 64: Global Container as a Service Industry Volume K Unit Forecast, by Service Type 2020 & 2033
- Table 65: Global Container as a Service Industry Revenue billion Forecast, by Size of the Enterprise 2020 & 2033
- Table 66: Global Container as a Service Industry Volume K Unit Forecast, by Size of the Enterprise 2020 & 2033
- Table 67: Global Container as a Service Industry Revenue billion Forecast, by End-user Application 2020 & 2033
- Table 68: Global Container as a Service Industry Volume K Unit Forecast, by End-user Application 2020 & 2033
- Table 69: Global Container as a Service Industry Revenue billion Forecast, by Country 2020 & 2033
- Table 70: Global Container as a Service Industry Volume K Unit Forecast, by Country 2020 & 2033
- Table 71: Mexico Container as a Service Industry Revenue (billion) Forecast, by Application 2020 & 2033
- Table 72: Mexico Container as a Service Industry Volume (K Unit) Forecast, by Application 2020 & 2033
- Table 73: Brazil Container as a Service Industry Revenue (billion) Forecast, by Application 2020 & 2033
- Table 74: Brazil Container as a Service Industry Volume (K Unit) Forecast, by Application 2020 & 2033
- Table 75: Rest of Latin America Container as a Service Industry Revenue (billion) Forecast, by Application 2020 & 2033
- Table 76: Rest of Latin America Container as a Service Industry Volume (K Unit) Forecast, by Application 2020 & 2033
- Table 77: Global Container as a Service Industry Revenue billion Forecast, by Deployment 2020 & 2033
- Table 78: Global Container as a Service Industry Volume K Unit Forecast, by Deployment 2020 & 2033
- Table 79: Global Container as a Service Industry Revenue billion Forecast, by Service Type 2020 & 2033
- Table 80: Global Container as a Service Industry Volume K Unit Forecast, by Service Type 2020 & 2033
- Table 81: Global Container as a Service Industry Revenue billion Forecast, by Size of the Enterprise 2020 & 2033
- Table 82: Global Container as a Service Industry Volume K Unit Forecast, by Size of the Enterprise 2020 & 2033
- Table 83: Global Container as a Service Industry Revenue billion Forecast, by End-user Application 2020 & 2033
- Table 84: Global Container as a Service Industry Volume K Unit Forecast, by End-user Application 2020 & 2033
- Table 85: Global Container as a Service Industry Revenue billion Forecast, by Country 2020 & 2033
- Table 86: Global Container as a Service Industry Volume K Unit Forecast, by Country 2020 & 2033
Frequently Asked Questions
1. What is the projected Compound Annual Growth Rate (CAGR) of the Container as a Service Industry?
The projected CAGR is approximately 32.1%.
2. Which companies are prominent players in the Container as a Service Industry?
Key companies in the market include TATA Communications, Microsoft Corporation (Microsoft Azure), VMware Inc (Pivotal Software Inc ), Hewlett Packard Enterprise Development LP, Cisco Systems Inc, Rancher Labs, IBM Corporation (Red Hat Inc ), Amazon Web Services Inc, Google LLC (Google Cloud), Oracle Corporation, SUSE, Rackspace Inc.
3. What are the main segments of the Container as a Service Industry?
The market segments include Deployment, Service Type, Size of the Enterprise, End-user Application.
4. Can you provide details about the market size?
The market size is estimated to be USD 4.09 billion as of 2022.
5. What are some drivers contributing to market growth?
Benefits of Cost Effectiveness and Increased Productivity; Greater Flexibility Than On-Premises Containers; Increasing Popularity of Microservices.
6. What are the notable trends driving market growth?
BFSI Sector Expected to Have Maximum Application.
7. Are there any restraints impacting market growth?
Difficulty in Achieving Security and Compliance.
8. Can you provide examples of recent developments in the market?
November 2022: Sylabs, a provider of container technology and services for performance-intensive workloads, declared that the Singularity container runtime suite, including SingularityCE and SingularityPRO, is being supported in the Nimbix Federated supercomputing suite, a set of flexible and secure high-performance computing (HPC) solutions that mainly deliver customers with added agility for their compute-intensive workloads. Users of the Nimbix Supercomputing Suite would be able to use the Singularity containerization features. This would give containerization a wide range of uses, allow for more consumption models, and help research institutes and high-performance computing (HPC) centers make more money from their spare cluster capacity.
9. What pricing options are available for accessing the report?
Pricing options include single-user, multi-user, and enterprise licenses priced at USD 4750, USD 5250, and USD 8750 respectively.
10. Is the market size provided in terms of value or volume?
The market size is provided in terms of value, measured in billion and volume, measured in K Unit.
11. Are there any specific market keywords associated with the report?
Yes, the market keyword associated with the report is "Container as a Service Industry," which aids in identifying and referencing the specific market segment covered.
12. How do I determine which pricing option suits my needs best?
The pricing options vary based on user requirements and access needs. Individual users may opt for single-user licenses, while businesses requiring broader access may choose multi-user or enterprise licenses for cost-effective access to the report.
13. Are there any additional resources or data provided in the Container as a Service Industry report?
While the report offers comprehensive insights, it's advisable to review the specific contents or supplementary materials provided to ascertain if additional resources or data are available.
14. How can I stay updated on further developments or reports in the Container as a Service Industry?
To stay informed about further developments, trends, and reports in the Container as a Service Industry, consider subscribing to industry newsletters, following relevant companies and organizations, or regularly checking reputable industry news sources and publications.
Methodology
Step 1 - Identification of Relevant Samples Size from Population Database


Step 2 - Approaches for Defining Global Market Size (Value, Volume* & Price*)

Note*: In applicable scenarios
Step 3 - Data Sources
Primary Research
- Web Analytics
- Survey Reports
- Research Institute
- Latest Research Reports
- Opinion Leaders
Secondary Research
- Annual Reports
- White Paper
- Latest Press Release
- Industry Association
- Paid Database
- Investor Presentations

Step 4 - Data Triangulation
Involves using different sources of information in order to increase the validity of a study
These sources are likely to be stakeholders in a program - participants, other researchers, program staff, other community members, and so on.
Then we put all data in single framework & apply various statistical tools to find out the dynamic on the market.
During the analysis stage, feedback from the stakeholder groups would be compared to determine areas of agreement as well as areas of divergence