

Key Insights
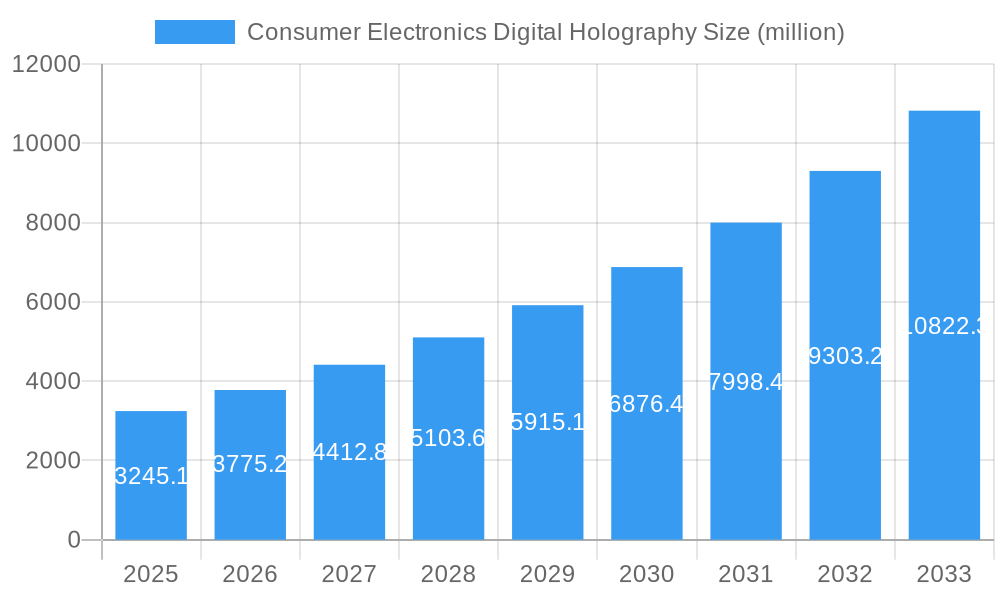
The global consumer electronics digital holography market is experiencing robust growth, projected to reach \$3245.1 million in 2025 and maintain a Compound Annual Growth Rate (CAGR) of 16.5% from 2025 to 2033. This expansion is driven by several key factors. The increasing demand for advanced display technologies in wearable devices and flat panel displays fuels market growth. Consumers are seeking more immersive and interactive experiences, driving adoption of digital holographic displays for entertainment, gaming, and communication. Furthermore, advancements in digital holographic microscopy are creating new opportunities in medical imaging and diagnostics, contributing to market expansion. The integration of digital holography into telepresence systems is another significant driver, enabling realistic and remote collaboration across geographical distances. While manufacturing complexities and high initial investment costs might pose some challenges, the overall market outlook remains overwhelmingly positive, fueled by continuous technological advancements and increasing consumer demand for innovative electronics.
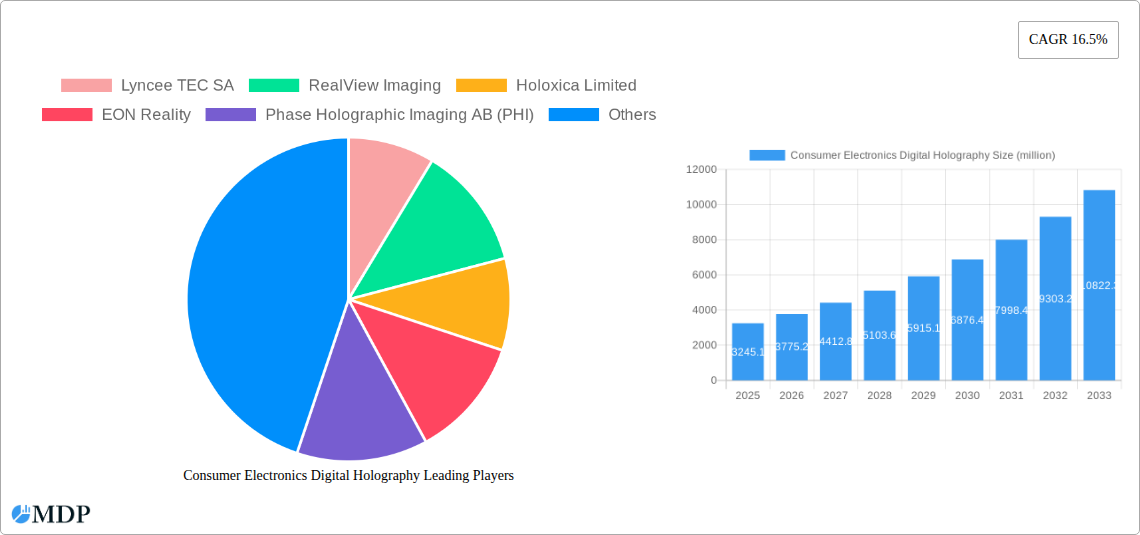
Consumer Electronics Digital Holography Market Size (In Billion)
The market segmentation reveals significant opportunities across various application areas. Wearable devices, such as smartwatches and augmented reality glasses, are expected to witness substantial growth due to their rising popularity and the integration of advanced holographic projections. The flat panel display segment will also continue to expand as digital holography enhances screen resolution and depth perception, offering immersive visual experiences. The ‘Other’ application segment encompasses various emerging uses, such as holographic security features and advanced microscopy applications in the medical field, further broadening the market's potential. Geographically, North America and Europe are anticipated to hold significant market shares due to early adoption of advanced technologies and a strong presence of key players. However, the Asia-Pacific region is expected to showcase the fastest growth rate due to increasing disposable incomes and technological advancements. Companies like Lyncee TEC SA, RealView Imaging, and Holoxica Limited are major players, continuously innovating to meet the increasing market demands.
Consumer Electronics Digital Holography Company Market Share
Consumer Electronics Digital Holography Market Report: 2019-2033
This comprehensive report provides a detailed analysis of the Consumer Electronics Digital Holography market, projecting a market value exceeding $XX million by 2033. It covers market dynamics, industry trends, leading players, and future opportunities, offering invaluable insights for stakeholders across the digital holography ecosystem. The report utilizes data from the historical period (2019-2024), base year (2025), and estimated year (2025) to forecast market trends through 2033. This in-depth analysis is crucial for strategic decision-making in this rapidly evolving sector.
Consumer Electronics Digital Holography Market Dynamics & Concentration
The Consumer Electronics Digital Holography market, valued at $XX million in 2025, is characterized by moderate concentration with several key players vying for market share. Lyncee TEC SA, RealView Imaging, and Holoxica Limited currently hold significant positions, but the market is witnessing increased activity from emerging players like Leia Inc. and ovizio imaging systems. Innovation is a key driver, with companies focusing on enhancing resolution, reducing cost, and expanding applications.
- Market Concentration: The Herfindahl-Hirschman Index (HHI) is estimated to be XX in 2025, indicating a moderately concentrated market.
- Innovation Drivers: Advancements in digital micromirror devices (DMDs), spatial light modulators (SLMs), and high-speed image sensors are fueling innovation.
- Regulatory Frameworks: While relatively nascent, regulatory bodies are increasingly focusing on data privacy and security related to holographic data storage and transmission.
- Product Substitutes: Traditional 2D displays and augmented reality (AR) technologies present competitive challenges.
- End-User Trends: Growing demand for immersive experiences and improved visualization tools across various consumer electronics segments is boosting market growth.
- M&A Activities: The number of mergers and acquisitions within the sector has been relatively low (XX deals in the past five years), suggesting potential for increased consolidation in the coming years.
Consumer Electronics Digital Holography Industry Trends & Analysis
The Consumer Electronics Digital Holography market is projected to experience a Compound Annual Growth Rate (CAGR) of XX% from 2025 to 2033, driven by several key factors. The increasing adoption of holographic displays in smartphones and wearable devices is a primary growth driver. Technological advancements, such as improved algorithms and reduced manufacturing costs, are also contributing to market expansion. Furthermore, consumer preference for innovative and immersive visual experiences is fueling demand. However, competitive pressures from established players in related markets and challenges related to scaling production are potential headwinds. Market penetration is currently estimated at XX% and is expected to significantly increase by 2033.
Leading Markets & Segments in Consumer Electronics Digital Holography
The North American market currently holds the leading position in the consumer electronics digital holography sector, driven by strong consumer demand and high technological adoption rates. Within the application segments, the flat display segment is currently dominating, with significant growth potential expected from the wearable device segment in the coming years.
Key Drivers:
- North America: Strong consumer electronics market, high disposable income, and early adoption of advanced technologies.
- Flat Display Segment: High demand for immersive and high-resolution displays in consumer electronics.
- Wearable Device Segment: Growing popularity of smartwatches and other wearables equipped with advanced display technologies.
Dominance Analysis:
North America’s dominance stems from a confluence of factors including strong R&D investments, well-established consumer electronics manufacturing bases, and early adoption of novel technologies. The flat display segment's dominance is primarily due to its established market size and the relatively easier integration of digital holographic technology into existing production lines. The wearable device segment is poised for significant growth due to evolving technological capabilities and increasing demand for more interactive and engaging wearables.
Consumer Electronics Digital Holography Product Developments
Recent product innovations focus on miniaturization, increased resolution, and improved color accuracy in digital holographic displays. Companies are developing compact SLMs and DMDs for integration into various consumer electronics devices. These advancements are improving the market fit by offering more realistic and engaging holographic experiences, broadening the range of potential applications.
Key Drivers of Consumer Electronics Digital Holography Growth
Several factors are propelling the growth of the Consumer Electronics Digital Holography market. Technological advancements like the development of more efficient and cost-effective SLMs are critical. The growing consumer demand for immersive and interactive entertainment experiences is also fueling growth. Furthermore, supportive government policies and funding initiatives focused on AR/VR technologies contribute to the market's expansion.
Challenges in the Consumer Electronics Digital Holography Market
Despite significant potential, the market faces challenges. High manufacturing costs and complex integration processes hinder mass adoption. Supply chain constraints related to specialized components can lead to production delays and increased costs. Intense competition from established players in related markets also poses a significant challenge. The overall impact of these challenges is estimated to reduce the market's projected growth by approximately XX% by 2033.
Emerging Opportunities in Consumer Electronics Digital Holography
The integration of digital holography into other technologies, such as augmented reality (AR) and virtual reality (VR), offers significant opportunities. Strategic partnerships between digital holography companies and major consumer electronics brands can accelerate market penetration. Furthermore, expansion into new application areas like 3D holographic medical imaging presents exciting long-term growth prospects.
Leading Players in the Consumer Electronics Digital Holography Sector
- Lyncee TEC SA
- RealView Imaging
- Holoxica Limited
- EON Reality
- Phase Holographic Imaging AB (PHI)
- Holotech Switzerland AG
- Holmarc Opto-Mechatronics
- Geola Digital Uab
- Leia Inc.
- ovizio imaging systems
Key Milestones in Consumer Electronics Digital Holography Industry
- 2020: Leia Inc. launched its first holographic display for smartphones.
- 2022: Lyncee TEC SA secured a significant investment to expand its R&D efforts.
- 2023: A major merger between two smaller digital holography companies was announced.
- 2024: Several new holographic display prototypes were showcased at major consumer electronics trade shows. (Specific details unavailable for the moment – xx)
Strategic Outlook for Consumer Electronics Digital Holography Market
The Consumer Electronics Digital Holography market is poised for substantial growth in the coming years. Strategic partnerships, technological breakthroughs, and expansion into new application areas will be key drivers of future market potential. Companies that successfully navigate the challenges of cost reduction, mass production, and integration will be best positioned to capitalize on this rapidly evolving market.
Consumer Electronics Digital Holography Segmentation
-
1. Application
- 1.1. Flat
- 1.2. Wearable Device
- 1.3. Other
-
2. Types
- 2.1. Digital Holographic Microscopy
- 2.2. Digital Holographic Display
- 2.3. Holographic Telepresence
Consumer Electronics Digital Holography Segmentation By Geography
-
1. North America
- 1.1. United States
- 1.2. Canada
- 1.3. Mexico
-
2. South America
- 2.1. Brazil
- 2.2. Argentina
- 2.3. Rest of South America
-
3. Europe
- 3.1. United Kingdom
- 3.2. Germany
- 3.3. France
- 3.4. Italy
- 3.5. Spain
- 3.6. Russia
- 3.7. Benelux
- 3.8. Nordics
- 3.9. Rest of Europe
-
4. Middle East & Africa
- 4.1. Turkey
- 4.2. Israel
- 4.3. GCC
- 4.4. North Africa
- 4.5. South Africa
- 4.6. Rest of Middle East & Africa
-
5. Asia Pacific
- 5.1. China
- 5.2. India
- 5.3. Japan
- 5.4. South Korea
- 5.5. ASEAN
- 5.6. Oceania
- 5.7. Rest of Asia Pacific

Consumer Electronics Digital Holography Regional Market Share
Geographic Coverage of Consumer Electronics Digital Holography
Consumer Electronics Digital Holography REPORT HIGHLIGHTS
| Aspects | Details |
|---|---|
| Study Period | 2020-2034 |
| Base Year | 2025 |
| Estimated Year | 2026 |
| Forecast Period | 2026-2034 |
| Historical Period | 2020-2025 |
| Growth Rate | CAGR of 16.5% from 2020-2034 |
| Segmentation |
|
Table of Contents
- 1. Introduction
- 1.1. Research Scope
- 1.2. Market Segmentation
- 1.3. Research Methodology
- 1.4. Definitions and Assumptions
- 2. Executive Summary
- 2.1. Introduction
- 3. Market Dynamics
- 3.1. Introduction
- 3.2. Market Drivers
- 3.3. Market Restrains
- 3.4. Market Trends
- 4. Market Factor Analysis
- 4.1. Porters Five Forces
- 4.2. Supply/Value Chain
- 4.3. PESTEL analysis
- 4.4. Market Entropy
- 4.5. Patent/Trademark Analysis
- 5. Global Consumer Electronics Digital Holography Analysis, Insights and Forecast, 2020-2032
- 5.1. Market Analysis, Insights and Forecast - by Application
- 5.1.1. Flat
- 5.1.2. Wearable Device
- 5.1.3. Other
- 5.2. Market Analysis, Insights and Forecast - by Types
- 5.2.1. Digital Holographic Microscopy
- 5.2.2. Digital Holographic Display
- 5.2.3. Holographic Telepresence
- 5.3. Market Analysis, Insights and Forecast - by Region
- 5.3.1. North America
- 5.3.2. South America
- 5.3.3. Europe
- 5.3.4. Middle East & Africa
- 5.3.5. Asia Pacific
- 5.1. Market Analysis, Insights and Forecast - by Application
- 6. North America Consumer Electronics Digital Holography Analysis, Insights and Forecast, 2020-2032
- 6.1. Market Analysis, Insights and Forecast - by Application
- 6.1.1. Flat
- 6.1.2. Wearable Device
- 6.1.3. Other
- 6.2. Market Analysis, Insights and Forecast - by Types
- 6.2.1. Digital Holographic Microscopy
- 6.2.2. Digital Holographic Display
- 6.2.3. Holographic Telepresence
- 6.1. Market Analysis, Insights and Forecast - by Application
- 7. South America Consumer Electronics Digital Holography Analysis, Insights and Forecast, 2020-2032
- 7.1. Market Analysis, Insights and Forecast - by Application
- 7.1.1. Flat
- 7.1.2. Wearable Device
- 7.1.3. Other
- 7.2. Market Analysis, Insights and Forecast - by Types
- 7.2.1. Digital Holographic Microscopy
- 7.2.2. Digital Holographic Display
- 7.2.3. Holographic Telepresence
- 7.1. Market Analysis, Insights and Forecast - by Application
- 8. Europe Consumer Electronics Digital Holography Analysis, Insights and Forecast, 2020-2032
- 8.1. Market Analysis, Insights and Forecast - by Application
- 8.1.1. Flat
- 8.1.2. Wearable Device
- 8.1.3. Other
- 8.2. Market Analysis, Insights and Forecast - by Types
- 8.2.1. Digital Holographic Microscopy
- 8.2.2. Digital Holographic Display
- 8.2.3. Holographic Telepresence
- 8.1. Market Analysis, Insights and Forecast - by Application
- 9. Middle East & Africa Consumer Electronics Digital Holography Analysis, Insights and Forecast, 2020-2032
- 9.1. Market Analysis, Insights and Forecast - by Application
- 9.1.1. Flat
- 9.1.2. Wearable Device
- 9.1.3. Other
- 9.2. Market Analysis, Insights and Forecast - by Types
- 9.2.1. Digital Holographic Microscopy
- 9.2.2. Digital Holographic Display
- 9.2.3. Holographic Telepresence
- 9.1. Market Analysis, Insights and Forecast - by Application
- 10. Asia Pacific Consumer Electronics Digital Holography Analysis, Insights and Forecast, 2020-2032
- 10.1. Market Analysis, Insights and Forecast - by Application
- 10.1.1. Flat
- 10.1.2. Wearable Device
- 10.1.3. Other
- 10.2. Market Analysis, Insights and Forecast - by Types
- 10.2.1. Digital Holographic Microscopy
- 10.2.2. Digital Holographic Display
- 10.2.3. Holographic Telepresence
- 10.1. Market Analysis, Insights and Forecast - by Application
- 11. Competitive Analysis
- 11.1. Global Market Share Analysis 2025
- 11.2. Company Profiles
- 11.2.1 Lyncee TEC SA
- 11.2.1.1. Overview
- 11.2.1.2. Products
- 11.2.1.3. SWOT Analysis
- 11.2.1.4. Recent Developments
- 11.2.1.5. Financials (Based on Availability)
- 11.2.2 RealView Imaging
- 11.2.2.1. Overview
- 11.2.2.2. Products
- 11.2.2.3. SWOT Analysis
- 11.2.2.4. Recent Developments
- 11.2.2.5. Financials (Based on Availability)
- 11.2.3 Holoxica Limited
- 11.2.3.1. Overview
- 11.2.3.2. Products
- 11.2.3.3. SWOT Analysis
- 11.2.3.4. Recent Developments
- 11.2.3.5. Financials (Based on Availability)
- 11.2.4 EON Reality
- 11.2.4.1. Overview
- 11.2.4.2. Products
- 11.2.4.3. SWOT Analysis
- 11.2.4.4. Recent Developments
- 11.2.4.5. Financials (Based on Availability)
- 11.2.5 Phase Holographic Imaging AB (PHI)
- 11.2.5.1. Overview
- 11.2.5.2. Products
- 11.2.5.3. SWOT Analysis
- 11.2.5.4. Recent Developments
- 11.2.5.5. Financials (Based on Availability)
- 11.2.6 Holotech Switzerland AG
- 11.2.6.1. Overview
- 11.2.6.2. Products
- 11.2.6.3. SWOT Analysis
- 11.2.6.4. Recent Developments
- 11.2.6.5. Financials (Based on Availability)
- 11.2.7 Holmarc Opto-Mechatronics
- 11.2.7.1. Overview
- 11.2.7.2. Products
- 11.2.7.3. SWOT Analysis
- 11.2.7.4. Recent Developments
- 11.2.7.5. Financials (Based on Availability)
- 11.2.8 Geola Digital Uab
- 11.2.8.1. Overview
- 11.2.8.2. Products
- 11.2.8.3. SWOT Analysis
- 11.2.8.4. Recent Developments
- 11.2.8.5. Financials (Based on Availability)
- 11.2.9 Leia Inc.
- 11.2.9.1. Overview
- 11.2.9.2. Products
- 11.2.9.3. SWOT Analysis
- 11.2.9.4. Recent Developments
- 11.2.9.5. Financials (Based on Availability)
- 11.2.10 ovizio imaging systems
- 11.2.10.1. Overview
- 11.2.10.2. Products
- 11.2.10.3. SWOT Analysis
- 11.2.10.4. Recent Developments
- 11.2.10.5. Financials (Based on Availability)
- 11.2.1 Lyncee TEC SA
List of Figures
- Figure 1: Global Consumer Electronics Digital Holography Revenue Breakdown (million, %) by Region 2025 & 2033
- Figure 2: North America Consumer Electronics Digital Holography Revenue (million), by Application 2025 & 2033
- Figure 3: North America Consumer Electronics Digital Holography Revenue Share (%), by Application 2025 & 2033
- Figure 4: North America Consumer Electronics Digital Holography Revenue (million), by Types 2025 & 2033
- Figure 5: North America Consumer Electronics Digital Holography Revenue Share (%), by Types 2025 & 2033
- Figure 6: North America Consumer Electronics Digital Holography Revenue (million), by Country 2025 & 2033
- Figure 7: North America Consumer Electronics Digital Holography Revenue Share (%), by Country 2025 & 2033
- Figure 8: South America Consumer Electronics Digital Holography Revenue (million), by Application 2025 & 2033
- Figure 9: South America Consumer Electronics Digital Holography Revenue Share (%), by Application 2025 & 2033
- Figure 10: South America Consumer Electronics Digital Holography Revenue (million), by Types 2025 & 2033
- Figure 11: South America Consumer Electronics Digital Holography Revenue Share (%), by Types 2025 & 2033
- Figure 12: South America Consumer Electronics Digital Holography Revenue (million), by Country 2025 & 2033
- Figure 13: South America Consumer Electronics Digital Holography Revenue Share (%), by Country 2025 & 2033
- Figure 14: Europe Consumer Electronics Digital Holography Revenue (million), by Application 2025 & 2033
- Figure 15: Europe Consumer Electronics Digital Holography Revenue Share (%), by Application 2025 & 2033
- Figure 16: Europe Consumer Electronics Digital Holography Revenue (million), by Types 2025 & 2033
- Figure 17: Europe Consumer Electronics Digital Holography Revenue Share (%), by Types 2025 & 2033
- Figure 18: Europe Consumer Electronics Digital Holography Revenue (million), by Country 2025 & 2033
- Figure 19: Europe Consumer Electronics Digital Holography Revenue Share (%), by Country 2025 & 2033
- Figure 20: Middle East & Africa Consumer Electronics Digital Holography Revenue (million), by Application 2025 & 2033
- Figure 21: Middle East & Africa Consumer Electronics Digital Holography Revenue Share (%), by Application 2025 & 2033
- Figure 22: Middle East & Africa Consumer Electronics Digital Holography Revenue (million), by Types 2025 & 2033
- Figure 23: Middle East & Africa Consumer Electronics Digital Holography Revenue Share (%), by Types 2025 & 2033
- Figure 24: Middle East & Africa Consumer Electronics Digital Holography Revenue (million), by Country 2025 & 2033
- Figure 25: Middle East & Africa Consumer Electronics Digital Holography Revenue Share (%), by Country 2025 & 2033
- Figure 26: Asia Pacific Consumer Electronics Digital Holography Revenue (million), by Application 2025 & 2033
- Figure 27: Asia Pacific Consumer Electronics Digital Holography Revenue Share (%), by Application 2025 & 2033
- Figure 28: Asia Pacific Consumer Electronics Digital Holography Revenue (million), by Types 2025 & 2033
- Figure 29: Asia Pacific Consumer Electronics Digital Holography Revenue Share (%), by Types 2025 & 2033
- Figure 30: Asia Pacific Consumer Electronics Digital Holography Revenue (million), by Country 2025 & 2033
- Figure 31: Asia Pacific Consumer Electronics Digital Holography Revenue Share (%), by Country 2025 & 2033
List of Tables
- Table 1: Global Consumer Electronics Digital Holography Revenue million Forecast, by Application 2020 & 2033
- Table 2: Global Consumer Electronics Digital Holography Revenue million Forecast, by Types 2020 & 2033
- Table 3: Global Consumer Electronics Digital Holography Revenue million Forecast, by Region 2020 & 2033
- Table 4: Global Consumer Electronics Digital Holography Revenue million Forecast, by Application 2020 & 2033
- Table 5: Global Consumer Electronics Digital Holography Revenue million Forecast, by Types 2020 & 2033
- Table 6: Global Consumer Electronics Digital Holography Revenue million Forecast, by Country 2020 & 2033
- Table 7: United States Consumer Electronics Digital Holography Revenue (million) Forecast, by Application 2020 & 2033
- Table 8: Canada Consumer Electronics Digital Holography Revenue (million) Forecast, by Application 2020 & 2033
- Table 9: Mexico Consumer Electronics Digital Holography Revenue (million) Forecast, by Application 2020 & 2033
- Table 10: Global Consumer Electronics Digital Holography Revenue million Forecast, by Application 2020 & 2033
- Table 11: Global Consumer Electronics Digital Holography Revenue million Forecast, by Types 2020 & 2033
- Table 12: Global Consumer Electronics Digital Holography Revenue million Forecast, by Country 2020 & 2033
- Table 13: Brazil Consumer Electronics Digital Holography Revenue (million) Forecast, by Application 2020 & 2033
- Table 14: Argentina Consumer Electronics Digital Holography Revenue (million) Forecast, by Application 2020 & 2033
- Table 15: Rest of South America Consumer Electronics Digital Holography Revenue (million) Forecast, by Application 2020 & 2033
- Table 16: Global Consumer Electronics Digital Holography Revenue million Forecast, by Application 2020 & 2033
- Table 17: Global Consumer Electronics Digital Holography Revenue million Forecast, by Types 2020 & 2033
- Table 18: Global Consumer Electronics Digital Holography Revenue million Forecast, by Country 2020 & 2033
- Table 19: United Kingdom Consumer Electronics Digital Holography Revenue (million) Forecast, by Application 2020 & 2033
- Table 20: Germany Consumer Electronics Digital Holography Revenue (million) Forecast, by Application 2020 & 2033
- Table 21: France Consumer Electronics Digital Holography Revenue (million) Forecast, by Application 2020 & 2033
- Table 22: Italy Consumer Electronics Digital Holography Revenue (million) Forecast, by Application 2020 & 2033
- Table 23: Spain Consumer Electronics Digital Holography Revenue (million) Forecast, by Application 2020 & 2033
- Table 24: Russia Consumer Electronics Digital Holography Revenue (million) Forecast, by Application 2020 & 2033
- Table 25: Benelux Consumer Electronics Digital Holography Revenue (million) Forecast, by Application 2020 & 2033
- Table 26: Nordics Consumer Electronics Digital Holography Revenue (million) Forecast, by Application 2020 & 2033
- Table 27: Rest of Europe Consumer Electronics Digital Holography Revenue (million) Forecast, by Application 2020 & 2033
- Table 28: Global Consumer Electronics Digital Holography Revenue million Forecast, by Application 2020 & 2033
- Table 29: Global Consumer Electronics Digital Holography Revenue million Forecast, by Types 2020 & 2033
- Table 30: Global Consumer Electronics Digital Holography Revenue million Forecast, by Country 2020 & 2033
- Table 31: Turkey Consumer Electronics Digital Holography Revenue (million) Forecast, by Application 2020 & 2033
- Table 32: Israel Consumer Electronics Digital Holography Revenue (million) Forecast, by Application 2020 & 2033
- Table 33: GCC Consumer Electronics Digital Holography Revenue (million) Forecast, by Application 2020 & 2033
- Table 34: North Africa Consumer Electronics Digital Holography Revenue (million) Forecast, by Application 2020 & 2033
- Table 35: South Africa Consumer Electronics Digital Holography Revenue (million) Forecast, by Application 2020 & 2033
- Table 36: Rest of Middle East & Africa Consumer Electronics Digital Holography Revenue (million) Forecast, by Application 2020 & 2033
- Table 37: Global Consumer Electronics Digital Holography Revenue million Forecast, by Application 2020 & 2033
- Table 38: Global Consumer Electronics Digital Holography Revenue million Forecast, by Types 2020 & 2033
- Table 39: Global Consumer Electronics Digital Holography Revenue million Forecast, by Country 2020 & 2033
- Table 40: China Consumer Electronics Digital Holography Revenue (million) Forecast, by Application 2020 & 2033
- Table 41: India Consumer Electronics Digital Holography Revenue (million) Forecast, by Application 2020 & 2033
- Table 42: Japan Consumer Electronics Digital Holography Revenue (million) Forecast, by Application 2020 & 2033
- Table 43: South Korea Consumer Electronics Digital Holography Revenue (million) Forecast, by Application 2020 & 2033
- Table 44: ASEAN Consumer Electronics Digital Holography Revenue (million) Forecast, by Application 2020 & 2033
- Table 45: Oceania Consumer Electronics Digital Holography Revenue (million) Forecast, by Application 2020 & 2033
- Table 46: Rest of Asia Pacific Consumer Electronics Digital Holography Revenue (million) Forecast, by Application 2020 & 2033
Frequently Asked Questions
1. What is the projected Compound Annual Growth Rate (CAGR) of the Consumer Electronics Digital Holography?
The projected CAGR is approximately 16.5%.
2. Which companies are prominent players in the Consumer Electronics Digital Holography?
Key companies in the market include Lyncee TEC SA, RealView Imaging, Holoxica Limited, EON Reality, Phase Holographic Imaging AB (PHI), Holotech Switzerland AG, Holmarc Opto-Mechatronics, Geola Digital Uab, Leia Inc., ovizio imaging systems.
3. What are the main segments of the Consumer Electronics Digital Holography?
The market segments include Application, Types.
4. Can you provide details about the market size?
The market size is estimated to be USD 3245.1 million as of 2022.
5. What are some drivers contributing to market growth?
N/A
6. What are the notable trends driving market growth?
N/A
7. Are there any restraints impacting market growth?
N/A
8. Can you provide examples of recent developments in the market?
N/A
9. What pricing options are available for accessing the report?
Pricing options include single-user, multi-user, and enterprise licenses priced at USD 3350.00, USD 5025.00, and USD 6700.00 respectively.
10. Is the market size provided in terms of value or volume?
The market size is provided in terms of value, measured in million.
11. Are there any specific market keywords associated with the report?
Yes, the market keyword associated with the report is "Consumer Electronics Digital Holography," which aids in identifying and referencing the specific market segment covered.
12. How do I determine which pricing option suits my needs best?
The pricing options vary based on user requirements and access needs. Individual users may opt for single-user licenses, while businesses requiring broader access may choose multi-user or enterprise licenses for cost-effective access to the report.
13. Are there any additional resources or data provided in the Consumer Electronics Digital Holography report?
While the report offers comprehensive insights, it's advisable to review the specific contents or supplementary materials provided to ascertain if additional resources or data are available.
14. How can I stay updated on further developments or reports in the Consumer Electronics Digital Holography?
To stay informed about further developments, trends, and reports in the Consumer Electronics Digital Holography, consider subscribing to industry newsletters, following relevant companies and organizations, or regularly checking reputable industry news sources and publications.
Methodology
Step 1 - Identification of Relevant Samples Size from Population Database


Step 2 - Approaches for Defining Global Market Size (Value, Volume* & Price*)

Note*: In applicable scenarios
Step 3 - Data Sources
Primary Research
- Web Analytics
- Survey Reports
- Research Institute
- Latest Research Reports
- Opinion Leaders
Secondary Research
- Annual Reports
- White Paper
- Latest Press Release
- Industry Association
- Paid Database
- Investor Presentations

Step 4 - Data Triangulation
Involves using different sources of information in order to increase the validity of a study
These sources are likely to be stakeholders in a program - participants, other researchers, program staff, other community members, and so on.
Then we put all data in single framework & apply various statistical tools to find out the dynamic on the market.
During the analysis stage, feedback from the stakeholder groups would be compared to determine areas of agreement as well as areas of divergence