

Key Insights
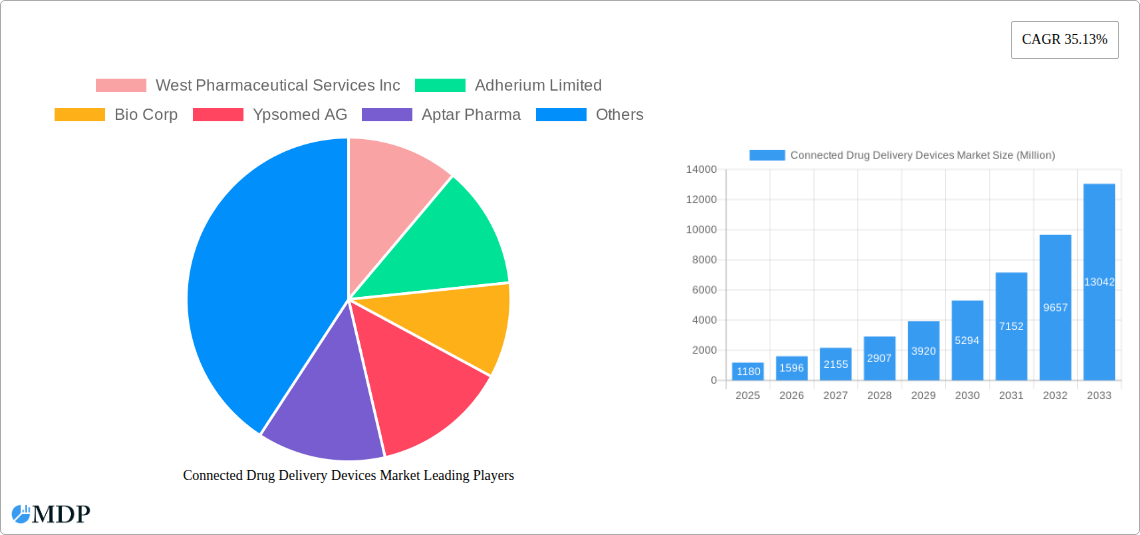
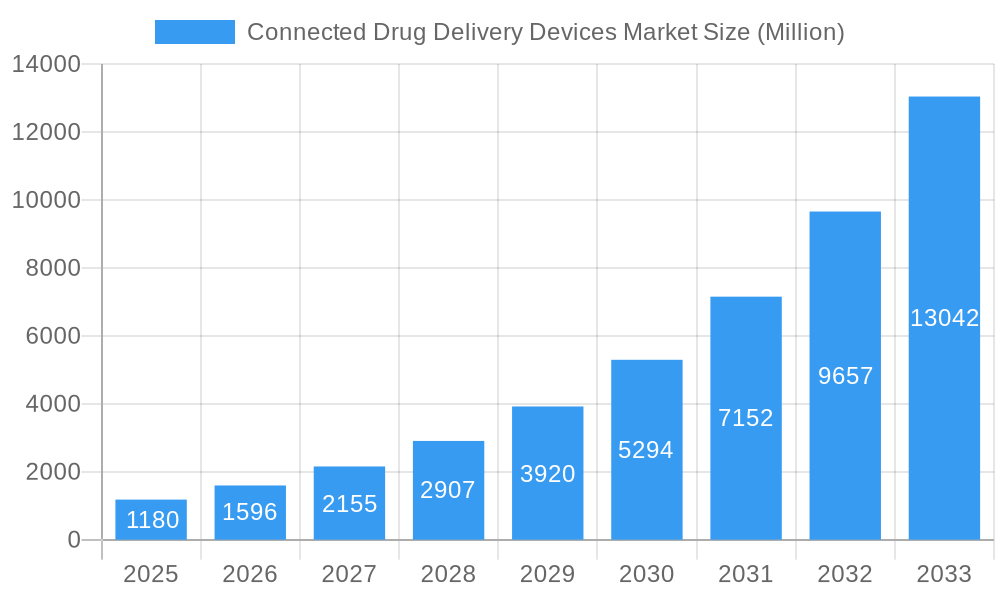
The Connected Drug Delivery Devices market is experiencing robust growth, projected to reach $1.18 billion in 2025 and exhibiting a Compound Annual Growth Rate (CAGR) of 35.13%. This expansion is fueled by several key factors. The increasing prevalence of chronic diseases necessitates sophisticated medication management, driving demand for connected devices offering precise dosage control, improved patient adherence, and real-time monitoring capabilities. Technological advancements, particularly in Bluetooth and NFC technologies, are enabling the development of smaller, more user-friendly, and data-secure devices. Furthermore, the rising adoption of telehealth and remote patient monitoring programs is further accelerating market growth, as these devices seamlessly integrate into digital healthcare ecosystems. The market segmentation reveals a significant contribution from connected sensors and connectable injection sensors, integrated into devices for simplified administration and data tracking. Major players like West Pharmaceutical Services, Adherium, and Ypsomed are driving innovation and expanding market penetration through strategic partnerships and product diversification. The North American market currently holds a dominant share, driven by advanced healthcare infrastructure and high technological adoption, followed by Europe and the Asia-Pacific region, which are witnessing significant growth potential due to increasing healthcare spending and rising awareness of connected health solutions. However, factors like high initial investment costs for both manufacturers and patients and concerns related to data security and privacy represent potential restraints.
Connected Drug Delivery Devices Market Market Size (In Billion)
The forecast period (2025-2033) anticipates continued market expansion, driven by the ongoing evolution of connected healthcare and the introduction of advanced functionalities like personalized medicine and AI-powered drug delivery optimization. Expansion into emerging markets will also contribute significantly to future growth. The integration of data analytics capabilities within these devices offers valuable insights into treatment efficacy and patient outcomes, enabling proactive intervention and improved healthcare management. While challenges regarding regulatory approvals and data privacy persist, the overall trajectory suggests a strong future for this market, positioning it as a pivotal element in the transformation of modern healthcare.
Connected Drug Delivery Devices Market Company Market Share
Connected Drug Delivery Devices Market: A Comprehensive Report (2019-2033)
This comprehensive report provides an in-depth analysis of the Connected Drug Delivery Devices Market, offering invaluable insights for stakeholders across the pharmaceutical, medical technology, and healthcare sectors. The study covers the period from 2019 to 2033, with 2025 serving as the base and estimated year. We project robust market growth driven by technological advancements, increasing demand for remote patient monitoring, and the expanding adoption of connected healthcare solutions. The report is meticulously structured to provide actionable intelligence, covering market dynamics, industry trends, leading players, and future prospects. The market size is expected to reach xx Million by 2033.
Connected Drug Delivery Devices Market Market Dynamics & Concentration
The Connected Drug Delivery Devices market exhibits a moderately concentrated landscape, with key players vying for market share through innovation and strategic acquisitions. Market concentration is influenced by factors such as regulatory approvals, technological advancements, and the ability to establish strong distribution channels. The market is characterized by a dynamic interplay of established players and emerging entrants, resulting in both collaborative and competitive interactions.
- Market Share: The top five players account for approximately xx% of the market share in 2025, with West Pharmaceutical Services Inc., Aptar Pharma, and Ypsomed AG holding significant positions.
- Innovation Drivers: Miniaturization of sensors, advancements in wireless communication technologies (Bluetooth, NFC), and the development of user-friendly interfaces are key drivers of innovation.
- Regulatory Frameworks: Stringent regulatory requirements for medical devices significantly impact market entry and product development timelines. Compliance with FDA, EMA, and other regional regulations is paramount.
- Product Substitutes: While there aren't direct substitutes, traditional drug delivery methods remain competitive, although their market share is expected to decline as the advantages of connected devices become increasingly apparent.
- End-User Trends: The rising prevalence of chronic diseases and the growing preference for remote patient monitoring among healthcare providers and patients are bolstering market growth.
- M&A Activities: The number of mergers and acquisitions in the connected drug delivery devices market has increased in recent years, reflecting the strategic consolidation and expansion efforts of major players. We estimate xx M&A deals occurred between 2019 and 2024.
Connected Drug Delivery Devices Market Industry Trends & Analysis
The Connected Drug Delivery Devices market is witnessing exponential growth, propelled by a confluence of factors. The market exhibits a significant Compound Annual Growth Rate (CAGR) of xx% during the forecast period (2025-2033). Market penetration is gradually increasing, particularly in developed economies, as healthcare providers and patients embrace the benefits of connected devices.
Technological disruptions are transforming the landscape, with the integration of advanced sensors, AI-powered analytics, and cloud-based data management systems shaping the future of drug delivery. Consumer preferences are shifting toward convenient, personalized, and data-driven healthcare solutions, further fueling market growth. The competitive dynamics are characterized by intense rivalry among established players and the emergence of innovative startups, leading to continuous product enhancements and market expansion.
Leading Markets & Segments in Connected Drug Delivery Devices Market
The North American region currently dominates the Connected Drug Delivery Devices market, driven by factors such as robust healthcare infrastructure, high adoption rates of new technologies, and favorable regulatory environments. Within North America, the United States holds the largest market share.
- By Technology: Bluetooth technology currently holds the largest market share due to its wide accessibility and compatibility with various devices. Near-field communication (NFC) is gaining traction, particularly for applications requiring short-range data transfer.
- By End User: Healthcare providers are the primary end users, followed by homecare settings. The increasing shift towards value-based care models is further driving adoption within healthcare institutions.
- By Product: Connected sensors and connectable injection sensors (including integrated connected devices) represent the largest segments, driven by the growing need for real-time patient data monitoring and improved medication adherence. Key drivers for each segment include:
- Economic Policies: Government initiatives supporting digital health and telehealth are crucial for market growth.
- Infrastructure: Robust internet connectivity and widespread smartphone penetration facilitate the adoption of connected devices.
Connected Drug Delivery Devices Market Product Developments
Recent years have witnessed a surge in innovative drug delivery devices incorporating advanced connectivity features. This includes the integration of sophisticated sensors, improved data analytics capabilities, and user-friendly mobile applications. The focus is on enhancing patient compliance, optimizing drug delivery efficacy, and facilitating remote patient monitoring. These developments are tailored to address specific needs within the market, targeting improved patient outcomes and cost-effectiveness.
Key Drivers of Connected Drug Delivery Devices Market Growth
Several key factors fuel the expansion of the Connected Drug Delivery Devices market. Technological advancements in miniaturization, wireless communication, and data analytics are pivotal. The increasing prevalence of chronic diseases and the consequent need for improved medication adherence are driving demand. Favorable regulatory frameworks and reimbursement policies in several regions are further stimulating market growth. Furthermore, strategic partnerships between pharmaceutical companies and medical device manufacturers are facilitating market expansion.
Challenges in the Connected Drug Delivery Devices Market Market
Despite the promising growth trajectory, several challenges impede market development. Regulatory hurdles for device approval and data privacy concerns pose significant barriers. Supply chain disruptions and the high cost of developing and manufacturing sophisticated devices can limit market penetration. Intense competition among established players and emerging entrants creates pressure on pricing and profit margins. The estimated impact of these factors on market growth is xx Million annually.
Emerging Opportunities in Connected Drug Delivery Devices Market
The Connected Drug Delivery Devices market holds substantial long-term growth potential. Technological breakthroughs, such as the integration of artificial intelligence and machine learning, will enhance data analytics and personalized medicine. Strategic partnerships between device manufacturers, pharmaceutical companies, and healthcare providers are crucial for expanding market reach and accelerating product adoption. Expansion into emerging markets with growing healthcare needs presents further opportunities.
Leading Players in the Connected Drug Delivery Devices Market Sector
Key Milestones in Connected Drug Delivery Devices Market Industry
- May 2022: Jabil Healthcare launches the Qfinity autoinjector platform, a reusable, connected drug delivery device for subcutaneous administration. This launch expands the options for connected drug delivery, particularly for self-administered medications.
- February 2022: Aptar Pharma launches HeroTracker Sense, transforming standard metered-dose inhalers into smart connected devices. This significantly enhances respiratory health monitoring and medication management.
Strategic Outlook for Connected Drug Delivery Devices Market Market
The Connected Drug Delivery Devices market is poised for sustained growth, driven by technological innovations and evolving healthcare needs. Strategic partnerships, product diversification, and expansion into new geographic markets will be critical for success. The focus on personalized medicine and remote patient monitoring will further enhance the market's appeal, fostering long-term growth and creating lucrative opportunities for players in the sector.
Connected Drug Delivery Devices Market Segmentation
-
1. Product
-
1.1. Connected Sensors
- 1.1.1. Connected Inhaler Sensors
- 1.1.2. Connectable Injection Sensors
-
1.2. Integrated Connected Devices
- 1.2.1. Connected Inhaler Devices
- 1.2.2. Connected Injection Devices
-
1.1. Connected Sensors
-
2. Technology
- 2.1. Bluetooth
- 2.2. Near-field communication (NFC)
- 2.3. Other Technologies
-
3. End User
- 3.1. Healthcare Providers
- 3.2. Homecare
Connected Drug Delivery Devices Market Segmentation By Geography
-
1. North America
- 1.1. United States
- 1.2. Canada
- 1.3. Mexico
-
2. Europe
- 2.1. United Kingdom
- 2.2. Germany
- 2.3. France
- 2.4. Italy
- 2.5. Spain
- 2.6. Rest of Europe
-
3. Asia Pacific
- 3.1. China
- 3.2. Japan
- 3.3. India
- 3.4. Australia
- 3.5. South Korea
- 3.6. Rest of Asia Pacific
- 4. Middle East
-
5. GCC
- 5.1. South Africa
- 5.2. Rest of Middle East
-
6. South America
- 6.1. Brazil
- 6.2. Argentina
- 6.3. Rest of South America
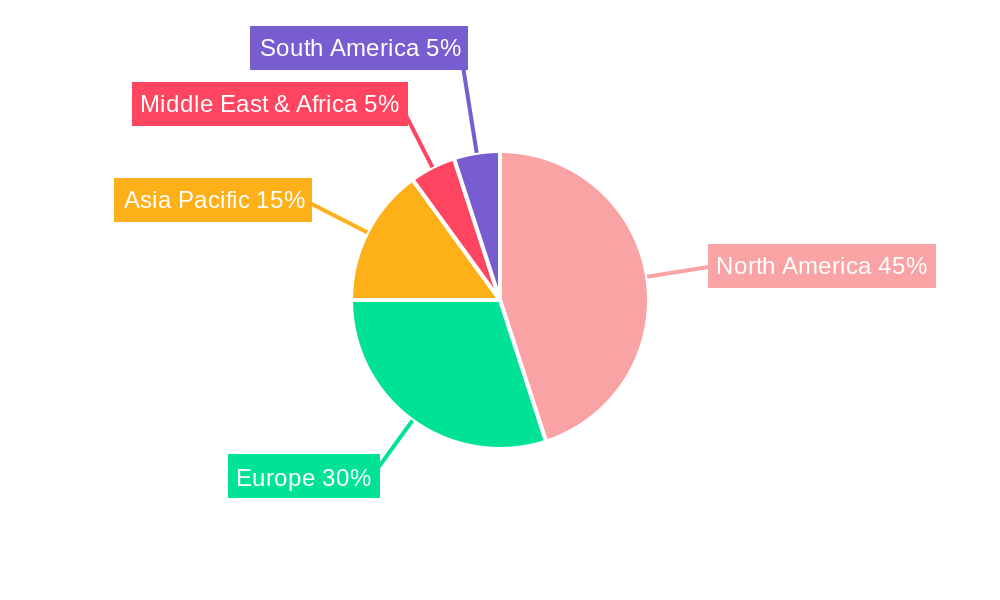
Connected Drug Delivery Devices Market Regional Market Share
Geographic Coverage of Connected Drug Delivery Devices Market
Connected Drug Delivery Devices Market REPORT HIGHLIGHTS
| Aspects | Details |
|---|---|
| Study Period | 2020-2034 |
| Base Year | 2025 |
| Estimated Year | 2026 |
| Forecast Period | 2026-2034 |
| Historical Period | 2020-2025 |
| Growth Rate | CAGR of 35.13% from 2020-2034 |
| Segmentation |
|
Table of Contents
- 1. Introduction
- 1.1. Research Scope
- 1.2. Market Segmentation
- 1.3. Research Objective
- 1.4. Definitions and Assumptions
- 2. Executive Summary
- 2.1. Market Snapshot
- 3. Market Dynamics
- 3.1. Market Drivers
- 3.2. Market Restrains
- 3.3. Market Trends
- 3.4. Market Opportunities
- 4. Market Factor Analysis
- 4.1. Porters Five Forces
- 4.1.1. Bargaining Power of Suppliers
- 4.1.2. Bargaining Power of Buyers
- 4.1.3. Threat of New Entrants
- 4.1.4. Threat of Substitutes
- 4.1.5. Competitive Rivalry
- 4.2. PESTEL analysis
- 4.3. BCG Analysis
- 4.3.1. Stars (High Growth, High Market Share)
- 4.3.2. Cash Cows (Low Growth, High Market Share)
- 4.3.3. Question Mark (High Growth, Low Market Share)
- 4.3.4. Dogs (Low Growth, Low Market Share)
- 4.4. Ansoff Matrix Analysis
- 4.5. Supply Chain Analysis
- 4.6. Regulatory Landscape
- 4.7. Current Market Potential and Opportunity Assessment (TAM–SAM–SOM Framework)
- 4.8. MDP Analyst Note
- 4.1. Porters Five Forces
- 5. Market Analysis, Insights and Forecast 2021-2033
- 5.1. Market Analysis, Insights and Forecast - by Product
- 5.1.1. Connected Sensors
- 5.1.1.1. Connected Inhaler Sensors
- 5.1.1.2. Connectable Injection Sensors
- 5.1.2. Integrated Connected Devices
- 5.1.2.1. Connected Inhaler Devices
- 5.1.2.2. Connected Injection Devices
- 5.1.1. Connected Sensors
- 5.2. Market Analysis, Insights and Forecast - by Technology
- 5.2.1. Bluetooth
- 5.2.2. Near-field communication (NFC)
- 5.2.3. Other Technologies
- 5.3. Market Analysis, Insights and Forecast - by End User
- 5.3.1. Healthcare Providers
- 5.3.2. Homecare
- 5.4. Market Analysis, Insights and Forecast - by Region
- 5.4.1. North America
- 5.4.2. Europe
- 5.4.3. Asia Pacific
- 5.4.4. Middle East
- 5.4.5. GCC
- 5.4.6. South America
- 5.1. Market Analysis, Insights and Forecast - by Product
- 6. Global Connected Drug Delivery Devices Market Analysis, Insights and Forecast, 2021-2033
- 6.1. Market Analysis, Insights and Forecast - by Product
- 6.1.1. Connected Sensors
- 6.1.1.1. Connected Inhaler Sensors
- 6.1.1.2. Connectable Injection Sensors
- 6.1.2. Integrated Connected Devices
- 6.1.2.1. Connected Inhaler Devices
- 6.1.2.2. Connected Injection Devices
- 6.1.1. Connected Sensors
- 6.2. Market Analysis, Insights and Forecast - by Technology
- 6.2.1. Bluetooth
- 6.2.2. Near-field communication (NFC)
- 6.2.3. Other Technologies
- 6.3. Market Analysis, Insights and Forecast - by End User
- 6.3.1. Healthcare Providers
- 6.3.2. Homecare
- 6.1. Market Analysis, Insights and Forecast - by Product
- 7. North America Connected Drug Delivery Devices Market Analysis, Insights and Forecast, 2020-2032
- 7.1. Market Analysis, Insights and Forecast - by Product
- 7.1.1. Connected Sensors
- 7.1.1.1. Connected Inhaler Sensors
- 7.1.1.2. Connectable Injection Sensors
- 7.1.2. Integrated Connected Devices
- 7.1.2.1. Connected Inhaler Devices
- 7.1.2.2. Connected Injection Devices
- 7.1.1. Connected Sensors
- 7.2. Market Analysis, Insights and Forecast - by Technology
- 7.2.1. Bluetooth
- 7.2.2. Near-field communication (NFC)
- 7.2.3. Other Technologies
- 7.3. Market Analysis, Insights and Forecast - by End User
- 7.3.1. Healthcare Providers
- 7.3.2. Homecare
- 7.1. Market Analysis, Insights and Forecast - by Product
- 8. Europe Connected Drug Delivery Devices Market Analysis, Insights and Forecast, 2020-2032
- 8.1. Market Analysis, Insights and Forecast - by Product
- 8.1.1. Connected Sensors
- 8.1.1.1. Connected Inhaler Sensors
- 8.1.1.2. Connectable Injection Sensors
- 8.1.2. Integrated Connected Devices
- 8.1.2.1. Connected Inhaler Devices
- 8.1.2.2. Connected Injection Devices
- 8.1.1. Connected Sensors
- 8.2. Market Analysis, Insights and Forecast - by Technology
- 8.2.1. Bluetooth
- 8.2.2. Near-field communication (NFC)
- 8.2.3. Other Technologies
- 8.3. Market Analysis, Insights and Forecast - by End User
- 8.3.1. Healthcare Providers
- 8.3.2. Homecare
- 8.1. Market Analysis, Insights and Forecast - by Product
- 9. Asia Pacific Connected Drug Delivery Devices Market Analysis, Insights and Forecast, 2020-2032
- 9.1. Market Analysis, Insights and Forecast - by Product
- 9.1.1. Connected Sensors
- 9.1.1.1. Connected Inhaler Sensors
- 9.1.1.2. Connectable Injection Sensors
- 9.1.2. Integrated Connected Devices
- 9.1.2.1. Connected Inhaler Devices
- 9.1.2.2. Connected Injection Devices
- 9.1.1. Connected Sensors
- 9.2. Market Analysis, Insights and Forecast - by Technology
- 9.2.1. Bluetooth
- 9.2.2. Near-field communication (NFC)
- 9.2.3. Other Technologies
- 9.3. Market Analysis, Insights and Forecast - by End User
- 9.3.1. Healthcare Providers
- 9.3.2. Homecare
- 9.1. Market Analysis, Insights and Forecast - by Product
- 10. Middle East Connected Drug Delivery Devices Market Analysis, Insights and Forecast, 2020-2032
- 10.1. Market Analysis, Insights and Forecast - by Product
- 10.1.1. Connected Sensors
- 10.1.1.1. Connected Inhaler Sensors
- 10.1.1.2. Connectable Injection Sensors
- 10.1.2. Integrated Connected Devices
- 10.1.2.1. Connected Inhaler Devices
- 10.1.2.2. Connected Injection Devices
- 10.1.1. Connected Sensors
- 10.2. Market Analysis, Insights and Forecast - by Technology
- 10.2.1. Bluetooth
- 10.2.2. Near-field communication (NFC)
- 10.2.3. Other Technologies
- 10.3. Market Analysis, Insights and Forecast - by End User
- 10.3.1. Healthcare Providers
- 10.3.2. Homecare
- 10.1. Market Analysis, Insights and Forecast - by Product
- 11. GCC Connected Drug Delivery Devices Market Analysis, Insights and Forecast, 2020-2032
- 11.1. Market Analysis, Insights and Forecast - by Product
- 11.1.1. Connected Sensors
- 11.1.1.1. Connected Inhaler Sensors
- 11.1.1.2. Connectable Injection Sensors
- 11.1.2. Integrated Connected Devices
- 11.1.2.1. Connected Inhaler Devices
- 11.1.2.2. Connected Injection Devices
- 11.1.1. Connected Sensors
- 11.2. Market Analysis, Insights and Forecast - by Technology
- 11.2.1. Bluetooth
- 11.2.2. Near-field communication (NFC)
- 11.2.3. Other Technologies
- 11.3. Market Analysis, Insights and Forecast - by End User
- 11.3.1. Healthcare Providers
- 11.3.2. Homecare
- 11.1. Market Analysis, Insights and Forecast - by Product
- 12. South America Connected Drug Delivery Devices Market Analysis, Insights and Forecast, 2020-2032
- 12.1. Market Analysis, Insights and Forecast - by Product
- 12.1.1. Connected Sensors
- 12.1.1.1. Connected Inhaler Sensors
- 12.1.1.2. Connectable Injection Sensors
- 12.1.2. Integrated Connected Devices
- 12.1.2.1. Connected Inhaler Devices
- 12.1.2.2. Connected Injection Devices
- 12.1.1. Connected Sensors
- 12.2. Market Analysis, Insights and Forecast - by Technology
- 12.2.1. Bluetooth
- 12.2.2. Near-field communication (NFC)
- 12.2.3. Other Technologies
- 12.3. Market Analysis, Insights and Forecast - by End User
- 12.3.1. Healthcare Providers
- 12.3.2. Homecare
- 12.1. Market Analysis, Insights and Forecast - by Product
- 13. Competitive Analysis
- 13.1. Company Profiles
- 13.1.1 West Pharmaceutical Services Inc
- 13.1.1.1. Company Overview
- 13.1.1.2. Products
- 13.1.1.3. Company Financials
- 13.1.1.4. SWOT Analysis
- 13.1.2 Adherium Limited
- 13.1.2.1. Company Overview
- 13.1.2.2. Products
- 13.1.2.3. Company Financials
- 13.1.2.4. SWOT Analysis
- 13.1.3 Bio Corp
- 13.1.3.1. Company Overview
- 13.1.3.2. Products
- 13.1.3.3. Company Financials
- 13.1.3.4. SWOT Analysis
- 13.1.4 Ypsomed AG
- 13.1.4.1. Company Overview
- 13.1.4.2. Products
- 13.1.4.3. Company Financials
- 13.1.4.4. SWOT Analysis
- 13.1.5 Aptar Pharma
- 13.1.5.1. Company Overview
- 13.1.5.2. Products
- 13.1.5.3. Company Financials
- 13.1.5.4. SWOT Analysis
- 13.1.6 Findair Sp z o o
- 13.1.6.1. Company Overview
- 13.1.6.2. Products
- 13.1.6.3. Company Financials
- 13.1.6.4. SWOT Analysis
- 13.1.7 Phillips-Medisize
- 13.1.7.1. Company Overview
- 13.1.7.2. Products
- 13.1.7.3. Company Financials
- 13.1.7.4. SWOT Analysis
- 13.1.8 Teva Pharmaceuticals Industries Ltd
- 13.1.8.1. Company Overview
- 13.1.8.2. Products
- 13.1.8.3. Company Financials
- 13.1.8.4. SWOT Analysis
- 13.1.9 Propeller Health (ResMed Inc )
- 13.1.9.1. Company Overview
- 13.1.9.2. Products
- 13.1.9.3. Company Financials
- 13.1.9.4. SWOT Analysis
- 13.1.1 West Pharmaceutical Services Inc
- 13.2. Market Entropy
- 13.2.1 Company's Key Areas Served
- 13.2.2 Recent Developments
- 13.3. Company Market Share Analysis 2025
- 13.3.1 Top 5 Companies Market Share Analysis
- 13.3.2 Top 3 Companies Market Share Analysis
- 13.4. List of Potential Customers
- 14. Research Methodology
List of Figures
- Figure 1: Global Connected Drug Delivery Devices Market Revenue Breakdown (Million, %) by Region 2025 & 2033
- Figure 2: Global Connected Drug Delivery Devices Market Volume Breakdown (K Unit, %) by Region 2025 & 2033
- Figure 3: North America Connected Drug Delivery Devices Market Revenue (Million), by Product 2025 & 2033
- Figure 4: North America Connected Drug Delivery Devices Market Volume (K Unit), by Product 2025 & 2033
- Figure 5: North America Connected Drug Delivery Devices Market Revenue Share (%), by Product 2025 & 2033
- Figure 6: North America Connected Drug Delivery Devices Market Volume Share (%), by Product 2025 & 2033
- Figure 7: North America Connected Drug Delivery Devices Market Revenue (Million), by Technology 2025 & 2033
- Figure 8: North America Connected Drug Delivery Devices Market Volume (K Unit), by Technology 2025 & 2033
- Figure 9: North America Connected Drug Delivery Devices Market Revenue Share (%), by Technology 2025 & 2033
- Figure 10: North America Connected Drug Delivery Devices Market Volume Share (%), by Technology 2025 & 2033
- Figure 11: North America Connected Drug Delivery Devices Market Revenue (Million), by End User 2025 & 2033
- Figure 12: North America Connected Drug Delivery Devices Market Volume (K Unit), by End User 2025 & 2033
- Figure 13: North America Connected Drug Delivery Devices Market Revenue Share (%), by End User 2025 & 2033
- Figure 14: North America Connected Drug Delivery Devices Market Volume Share (%), by End User 2025 & 2033
- Figure 15: North America Connected Drug Delivery Devices Market Revenue (Million), by Country 2025 & 2033
- Figure 16: North America Connected Drug Delivery Devices Market Volume (K Unit), by Country 2025 & 2033
- Figure 17: North America Connected Drug Delivery Devices Market Revenue Share (%), by Country 2025 & 2033
- Figure 18: North America Connected Drug Delivery Devices Market Volume Share (%), by Country 2025 & 2033
- Figure 19: Europe Connected Drug Delivery Devices Market Revenue (Million), by Product 2025 & 2033
- Figure 20: Europe Connected Drug Delivery Devices Market Volume (K Unit), by Product 2025 & 2033
- Figure 21: Europe Connected Drug Delivery Devices Market Revenue Share (%), by Product 2025 & 2033
- Figure 22: Europe Connected Drug Delivery Devices Market Volume Share (%), by Product 2025 & 2033
- Figure 23: Europe Connected Drug Delivery Devices Market Revenue (Million), by Technology 2025 & 2033
- Figure 24: Europe Connected Drug Delivery Devices Market Volume (K Unit), by Technology 2025 & 2033
- Figure 25: Europe Connected Drug Delivery Devices Market Revenue Share (%), by Technology 2025 & 2033
- Figure 26: Europe Connected Drug Delivery Devices Market Volume Share (%), by Technology 2025 & 2033
- Figure 27: Europe Connected Drug Delivery Devices Market Revenue (Million), by End User 2025 & 2033
- Figure 28: Europe Connected Drug Delivery Devices Market Volume (K Unit), by End User 2025 & 2033
- Figure 29: Europe Connected Drug Delivery Devices Market Revenue Share (%), by End User 2025 & 2033
- Figure 30: Europe Connected Drug Delivery Devices Market Volume Share (%), by End User 2025 & 2033
- Figure 31: Europe Connected Drug Delivery Devices Market Revenue (Million), by Country 2025 & 2033
- Figure 32: Europe Connected Drug Delivery Devices Market Volume (K Unit), by Country 2025 & 2033
- Figure 33: Europe Connected Drug Delivery Devices Market Revenue Share (%), by Country 2025 & 2033
- Figure 34: Europe Connected Drug Delivery Devices Market Volume Share (%), by Country 2025 & 2033
- Figure 35: Asia Pacific Connected Drug Delivery Devices Market Revenue (Million), by Product 2025 & 2033
- Figure 36: Asia Pacific Connected Drug Delivery Devices Market Volume (K Unit), by Product 2025 & 2033
- Figure 37: Asia Pacific Connected Drug Delivery Devices Market Revenue Share (%), by Product 2025 & 2033
- Figure 38: Asia Pacific Connected Drug Delivery Devices Market Volume Share (%), by Product 2025 & 2033
- Figure 39: Asia Pacific Connected Drug Delivery Devices Market Revenue (Million), by Technology 2025 & 2033
- Figure 40: Asia Pacific Connected Drug Delivery Devices Market Volume (K Unit), by Technology 2025 & 2033
- Figure 41: Asia Pacific Connected Drug Delivery Devices Market Revenue Share (%), by Technology 2025 & 2033
- Figure 42: Asia Pacific Connected Drug Delivery Devices Market Volume Share (%), by Technology 2025 & 2033
- Figure 43: Asia Pacific Connected Drug Delivery Devices Market Revenue (Million), by End User 2025 & 2033
- Figure 44: Asia Pacific Connected Drug Delivery Devices Market Volume (K Unit), by End User 2025 & 2033
- Figure 45: Asia Pacific Connected Drug Delivery Devices Market Revenue Share (%), by End User 2025 & 2033
- Figure 46: Asia Pacific Connected Drug Delivery Devices Market Volume Share (%), by End User 2025 & 2033
- Figure 47: Asia Pacific Connected Drug Delivery Devices Market Revenue (Million), by Country 2025 & 2033
- Figure 48: Asia Pacific Connected Drug Delivery Devices Market Volume (K Unit), by Country 2025 & 2033
- Figure 49: Asia Pacific Connected Drug Delivery Devices Market Revenue Share (%), by Country 2025 & 2033
- Figure 50: Asia Pacific Connected Drug Delivery Devices Market Volume Share (%), by Country 2025 & 2033
- Figure 51: Middle East Connected Drug Delivery Devices Market Revenue (Million), by Product 2025 & 2033
- Figure 52: Middle East Connected Drug Delivery Devices Market Volume (K Unit), by Product 2025 & 2033
- Figure 53: Middle East Connected Drug Delivery Devices Market Revenue Share (%), by Product 2025 & 2033
- Figure 54: Middle East Connected Drug Delivery Devices Market Volume Share (%), by Product 2025 & 2033
- Figure 55: Middle East Connected Drug Delivery Devices Market Revenue (Million), by Technology 2025 & 2033
- Figure 56: Middle East Connected Drug Delivery Devices Market Volume (K Unit), by Technology 2025 & 2033
- Figure 57: Middle East Connected Drug Delivery Devices Market Revenue Share (%), by Technology 2025 & 2033
- Figure 58: Middle East Connected Drug Delivery Devices Market Volume Share (%), by Technology 2025 & 2033
- Figure 59: Middle East Connected Drug Delivery Devices Market Revenue (Million), by End User 2025 & 2033
- Figure 60: Middle East Connected Drug Delivery Devices Market Volume (K Unit), by End User 2025 & 2033
- Figure 61: Middle East Connected Drug Delivery Devices Market Revenue Share (%), by End User 2025 & 2033
- Figure 62: Middle East Connected Drug Delivery Devices Market Volume Share (%), by End User 2025 & 2033
- Figure 63: Middle East Connected Drug Delivery Devices Market Revenue (Million), by Country 2025 & 2033
- Figure 64: Middle East Connected Drug Delivery Devices Market Volume (K Unit), by Country 2025 & 2033
- Figure 65: Middle East Connected Drug Delivery Devices Market Revenue Share (%), by Country 2025 & 2033
- Figure 66: Middle East Connected Drug Delivery Devices Market Volume Share (%), by Country 2025 & 2033
- Figure 67: GCC Connected Drug Delivery Devices Market Revenue (Million), by Product 2025 & 2033
- Figure 68: GCC Connected Drug Delivery Devices Market Volume (K Unit), by Product 2025 & 2033
- Figure 69: GCC Connected Drug Delivery Devices Market Revenue Share (%), by Product 2025 & 2033
- Figure 70: GCC Connected Drug Delivery Devices Market Volume Share (%), by Product 2025 & 2033
- Figure 71: GCC Connected Drug Delivery Devices Market Revenue (Million), by Technology 2025 & 2033
- Figure 72: GCC Connected Drug Delivery Devices Market Volume (K Unit), by Technology 2025 & 2033
- Figure 73: GCC Connected Drug Delivery Devices Market Revenue Share (%), by Technology 2025 & 2033
- Figure 74: GCC Connected Drug Delivery Devices Market Volume Share (%), by Technology 2025 & 2033
- Figure 75: GCC Connected Drug Delivery Devices Market Revenue (Million), by End User 2025 & 2033
- Figure 76: GCC Connected Drug Delivery Devices Market Volume (K Unit), by End User 2025 & 2033
- Figure 77: GCC Connected Drug Delivery Devices Market Revenue Share (%), by End User 2025 & 2033
- Figure 78: GCC Connected Drug Delivery Devices Market Volume Share (%), by End User 2025 & 2033
- Figure 79: GCC Connected Drug Delivery Devices Market Revenue (Million), by Country 2025 & 2033
- Figure 80: GCC Connected Drug Delivery Devices Market Volume (K Unit), by Country 2025 & 2033
- Figure 81: GCC Connected Drug Delivery Devices Market Revenue Share (%), by Country 2025 & 2033
- Figure 82: GCC Connected Drug Delivery Devices Market Volume Share (%), by Country 2025 & 2033
- Figure 83: South America Connected Drug Delivery Devices Market Revenue (Million), by Product 2025 & 2033
- Figure 84: South America Connected Drug Delivery Devices Market Volume (K Unit), by Product 2025 & 2033
- Figure 85: South America Connected Drug Delivery Devices Market Revenue Share (%), by Product 2025 & 2033
- Figure 86: South America Connected Drug Delivery Devices Market Volume Share (%), by Product 2025 & 2033
- Figure 87: South America Connected Drug Delivery Devices Market Revenue (Million), by Technology 2025 & 2033
- Figure 88: South America Connected Drug Delivery Devices Market Volume (K Unit), by Technology 2025 & 2033
- Figure 89: South America Connected Drug Delivery Devices Market Revenue Share (%), by Technology 2025 & 2033
- Figure 90: South America Connected Drug Delivery Devices Market Volume Share (%), by Technology 2025 & 2033
- Figure 91: South America Connected Drug Delivery Devices Market Revenue (Million), by End User 2025 & 2033
- Figure 92: South America Connected Drug Delivery Devices Market Volume (K Unit), by End User 2025 & 2033
- Figure 93: South America Connected Drug Delivery Devices Market Revenue Share (%), by End User 2025 & 2033
- Figure 94: South America Connected Drug Delivery Devices Market Volume Share (%), by End User 2025 & 2033
- Figure 95: South America Connected Drug Delivery Devices Market Revenue (Million), by Country 2025 & 2033
- Figure 96: South America Connected Drug Delivery Devices Market Volume (K Unit), by Country 2025 & 2033
- Figure 97: South America Connected Drug Delivery Devices Market Revenue Share (%), by Country 2025 & 2033
- Figure 98: South America Connected Drug Delivery Devices Market Volume Share (%), by Country 2025 & 2033
List of Tables
- Table 1: Global Connected Drug Delivery Devices Market Revenue Million Forecast, by Product 2020 & 2033
- Table 2: Global Connected Drug Delivery Devices Market Volume K Unit Forecast, by Product 2020 & 2033
- Table 3: Global Connected Drug Delivery Devices Market Revenue Million Forecast, by Technology 2020 & 2033
- Table 4: Global Connected Drug Delivery Devices Market Volume K Unit Forecast, by Technology 2020 & 2033
- Table 5: Global Connected Drug Delivery Devices Market Revenue Million Forecast, by End User 2020 & 2033
- Table 6: Global Connected Drug Delivery Devices Market Volume K Unit Forecast, by End User 2020 & 2033
- Table 7: Global Connected Drug Delivery Devices Market Revenue Million Forecast, by Region 2020 & 2033
- Table 8: Global Connected Drug Delivery Devices Market Volume K Unit Forecast, by Region 2020 & 2033
- Table 9: Global Connected Drug Delivery Devices Market Revenue Million Forecast, by Product 2020 & 2033
- Table 10: Global Connected Drug Delivery Devices Market Volume K Unit Forecast, by Product 2020 & 2033
- Table 11: Global Connected Drug Delivery Devices Market Revenue Million Forecast, by Technology 2020 & 2033
- Table 12: Global Connected Drug Delivery Devices Market Volume K Unit Forecast, by Technology 2020 & 2033
- Table 13: Global Connected Drug Delivery Devices Market Revenue Million Forecast, by End User 2020 & 2033
- Table 14: Global Connected Drug Delivery Devices Market Volume K Unit Forecast, by End User 2020 & 2033
- Table 15: Global Connected Drug Delivery Devices Market Revenue Million Forecast, by Country 2020 & 2033
- Table 16: Global Connected Drug Delivery Devices Market Volume K Unit Forecast, by Country 2020 & 2033
- Table 17: United States Connected Drug Delivery Devices Market Revenue (Million) Forecast, by Application 2020 & 2033
- Table 18: United States Connected Drug Delivery Devices Market Volume (K Unit) Forecast, by Application 2020 & 2033
- Table 19: Canada Connected Drug Delivery Devices Market Revenue (Million) Forecast, by Application 2020 & 2033
- Table 20: Canada Connected Drug Delivery Devices Market Volume (K Unit) Forecast, by Application 2020 & 2033
- Table 21: Mexico Connected Drug Delivery Devices Market Revenue (Million) Forecast, by Application 2020 & 2033
- Table 22: Mexico Connected Drug Delivery Devices Market Volume (K Unit) Forecast, by Application 2020 & 2033
- Table 23: Global Connected Drug Delivery Devices Market Revenue Million Forecast, by Product 2020 & 2033
- Table 24: Global Connected Drug Delivery Devices Market Volume K Unit Forecast, by Product 2020 & 2033
- Table 25: Global Connected Drug Delivery Devices Market Revenue Million Forecast, by Technology 2020 & 2033
- Table 26: Global Connected Drug Delivery Devices Market Volume K Unit Forecast, by Technology 2020 & 2033
- Table 27: Global Connected Drug Delivery Devices Market Revenue Million Forecast, by End User 2020 & 2033
- Table 28: Global Connected Drug Delivery Devices Market Volume K Unit Forecast, by End User 2020 & 2033
- Table 29: Global Connected Drug Delivery Devices Market Revenue Million Forecast, by Country 2020 & 2033
- Table 30: Global Connected Drug Delivery Devices Market Volume K Unit Forecast, by Country 2020 & 2033
- Table 31: United Kingdom Connected Drug Delivery Devices Market Revenue (Million) Forecast, by Application 2020 & 2033
- Table 32: United Kingdom Connected Drug Delivery Devices Market Volume (K Unit) Forecast, by Application 2020 & 2033
- Table 33: Germany Connected Drug Delivery Devices Market Revenue (Million) Forecast, by Application 2020 & 2033
- Table 34: Germany Connected Drug Delivery Devices Market Volume (K Unit) Forecast, by Application 2020 & 2033
- Table 35: France Connected Drug Delivery Devices Market Revenue (Million) Forecast, by Application 2020 & 2033
- Table 36: France Connected Drug Delivery Devices Market Volume (K Unit) Forecast, by Application 2020 & 2033
- Table 37: Italy Connected Drug Delivery Devices Market Revenue (Million) Forecast, by Application 2020 & 2033
- Table 38: Italy Connected Drug Delivery Devices Market Volume (K Unit) Forecast, by Application 2020 & 2033
- Table 39: Spain Connected Drug Delivery Devices Market Revenue (Million) Forecast, by Application 2020 & 2033
- Table 40: Spain Connected Drug Delivery Devices Market Volume (K Unit) Forecast, by Application 2020 & 2033
- Table 41: Rest of Europe Connected Drug Delivery Devices Market Revenue (Million) Forecast, by Application 2020 & 2033
- Table 42: Rest of Europe Connected Drug Delivery Devices Market Volume (K Unit) Forecast, by Application 2020 & 2033
- Table 43: Global Connected Drug Delivery Devices Market Revenue Million Forecast, by Product 2020 & 2033
- Table 44: Global Connected Drug Delivery Devices Market Volume K Unit Forecast, by Product 2020 & 2033
- Table 45: Global Connected Drug Delivery Devices Market Revenue Million Forecast, by Technology 2020 & 2033
- Table 46: Global Connected Drug Delivery Devices Market Volume K Unit Forecast, by Technology 2020 & 2033
- Table 47: Global Connected Drug Delivery Devices Market Revenue Million Forecast, by End User 2020 & 2033
- Table 48: Global Connected Drug Delivery Devices Market Volume K Unit Forecast, by End User 2020 & 2033
- Table 49: Global Connected Drug Delivery Devices Market Revenue Million Forecast, by Country 2020 & 2033
- Table 50: Global Connected Drug Delivery Devices Market Volume K Unit Forecast, by Country 2020 & 2033
- Table 51: China Connected Drug Delivery Devices Market Revenue (Million) Forecast, by Application 2020 & 2033
- Table 52: China Connected Drug Delivery Devices Market Volume (K Unit) Forecast, by Application 2020 & 2033
- Table 53: Japan Connected Drug Delivery Devices Market Revenue (Million) Forecast, by Application 2020 & 2033
- Table 54: Japan Connected Drug Delivery Devices Market Volume (K Unit) Forecast, by Application 2020 & 2033
- Table 55: India Connected Drug Delivery Devices Market Revenue (Million) Forecast, by Application 2020 & 2033
- Table 56: India Connected Drug Delivery Devices Market Volume (K Unit) Forecast, by Application 2020 & 2033
- Table 57: Australia Connected Drug Delivery Devices Market Revenue (Million) Forecast, by Application 2020 & 2033
- Table 58: Australia Connected Drug Delivery Devices Market Volume (K Unit) Forecast, by Application 2020 & 2033
- Table 59: South Korea Connected Drug Delivery Devices Market Revenue (Million) Forecast, by Application 2020 & 2033
- Table 60: South Korea Connected Drug Delivery Devices Market Volume (K Unit) Forecast, by Application 2020 & 2033
- Table 61: Rest of Asia Pacific Connected Drug Delivery Devices Market Revenue (Million) Forecast, by Application 2020 & 2033
- Table 62: Rest of Asia Pacific Connected Drug Delivery Devices Market Volume (K Unit) Forecast, by Application 2020 & 2033
- Table 63: Global Connected Drug Delivery Devices Market Revenue Million Forecast, by Product 2020 & 2033
- Table 64: Global Connected Drug Delivery Devices Market Volume K Unit Forecast, by Product 2020 & 2033
- Table 65: Global Connected Drug Delivery Devices Market Revenue Million Forecast, by Technology 2020 & 2033
- Table 66: Global Connected Drug Delivery Devices Market Volume K Unit Forecast, by Technology 2020 & 2033
- Table 67: Global Connected Drug Delivery Devices Market Revenue Million Forecast, by End User 2020 & 2033
- Table 68: Global Connected Drug Delivery Devices Market Volume K Unit Forecast, by End User 2020 & 2033
- Table 69: Global Connected Drug Delivery Devices Market Revenue Million Forecast, by Country 2020 & 2033
- Table 70: Global Connected Drug Delivery Devices Market Volume K Unit Forecast, by Country 2020 & 2033
- Table 71: Global Connected Drug Delivery Devices Market Revenue Million Forecast, by Product 2020 & 2033
- Table 72: Global Connected Drug Delivery Devices Market Volume K Unit Forecast, by Product 2020 & 2033
- Table 73: Global Connected Drug Delivery Devices Market Revenue Million Forecast, by Technology 2020 & 2033
- Table 74: Global Connected Drug Delivery Devices Market Volume K Unit Forecast, by Technology 2020 & 2033
- Table 75: Global Connected Drug Delivery Devices Market Revenue Million Forecast, by End User 2020 & 2033
- Table 76: Global Connected Drug Delivery Devices Market Volume K Unit Forecast, by End User 2020 & 2033
- Table 77: Global Connected Drug Delivery Devices Market Revenue Million Forecast, by Country 2020 & 2033
- Table 78: Global Connected Drug Delivery Devices Market Volume K Unit Forecast, by Country 2020 & 2033
- Table 79: South Africa Connected Drug Delivery Devices Market Revenue (Million) Forecast, by Application 2020 & 2033
- Table 80: South Africa Connected Drug Delivery Devices Market Volume (K Unit) Forecast, by Application 2020 & 2033
- Table 81: Rest of Middle East Connected Drug Delivery Devices Market Revenue (Million) Forecast, by Application 2020 & 2033
- Table 82: Rest of Middle East Connected Drug Delivery Devices Market Volume (K Unit) Forecast, by Application 2020 & 2033
- Table 83: Global Connected Drug Delivery Devices Market Revenue Million Forecast, by Product 2020 & 2033
- Table 84: Global Connected Drug Delivery Devices Market Volume K Unit Forecast, by Product 2020 & 2033
- Table 85: Global Connected Drug Delivery Devices Market Revenue Million Forecast, by Technology 2020 & 2033
- Table 86: Global Connected Drug Delivery Devices Market Volume K Unit Forecast, by Technology 2020 & 2033
- Table 87: Global Connected Drug Delivery Devices Market Revenue Million Forecast, by End User 2020 & 2033
- Table 88: Global Connected Drug Delivery Devices Market Volume K Unit Forecast, by End User 2020 & 2033
- Table 89: Global Connected Drug Delivery Devices Market Revenue Million Forecast, by Country 2020 & 2033
- Table 90: Global Connected Drug Delivery Devices Market Volume K Unit Forecast, by Country 2020 & 2033
- Table 91: Brazil Connected Drug Delivery Devices Market Revenue (Million) Forecast, by Application 2020 & 2033
- Table 92: Brazil Connected Drug Delivery Devices Market Volume (K Unit) Forecast, by Application 2020 & 2033
- Table 93: Argentina Connected Drug Delivery Devices Market Revenue (Million) Forecast, by Application 2020 & 2033
- Table 94: Argentina Connected Drug Delivery Devices Market Volume (K Unit) Forecast, by Application 2020 & 2033
- Table 95: Rest of South America Connected Drug Delivery Devices Market Revenue (Million) Forecast, by Application 2020 & 2033
- Table 96: Rest of South America Connected Drug Delivery Devices Market Volume (K Unit) Forecast, by Application 2020 & 2033
Frequently Asked Questions
1. What is the projected Compound Annual Growth Rate (CAGR) of the Connected Drug Delivery Devices Market?
The projected CAGR is approximately 35.13%.
2. Which companies are prominent players in the Connected Drug Delivery Devices Market?
Key companies in the market include West Pharmaceutical Services Inc, Adherium Limited, Bio Corp, Ypsomed AG, Aptar Pharma, Findair Sp z o o, Phillips-Medisize, Teva Pharmaceuticals Industries Ltd, Propeller Health (ResMed Inc ).
3. What are the main segments of the Connected Drug Delivery Devices Market?
The market segments include Product, Technology, End User.
4. Can you provide details about the market size?
The market size is estimated to be USD 1.18 Million as of 2022.
5. What are some drivers contributing to market growth?
Increasing Prevalence of Chronic Diseases Such as Asthma. COPD. and Diabetes; Increased Patient Connectivity and Engagement; Rising Patient Awareness About Adherence to Prescribed Therapies.
6. What are the notable trends driving market growth?
Homecare Segment is Estimated to Register a Significant Growth Rate Over the Forecast Period.
7. Are there any restraints impacting market growth?
Increased Cost Of Devices; Increasing Concerns About Data Privacy And Transfer.
8. Can you provide examples of recent developments in the market?
In May 2022, Jabil Healthcare, a division of Jabil Inc. launched the Qfinity autoinjector platform in the United States, a reusable drug delivery device for subcutaneous (SC) drug self-administration. The product also comes in a connected option.
9. What pricing options are available for accessing the report?
Pricing options include single-user, multi-user, and enterprise licenses priced at USD 4750, USD 5250, and USD 8750 respectively.
10. Is the market size provided in terms of value or volume?
The market size is provided in terms of value, measured in Million and volume, measured in K Unit.
11. Are there any specific market keywords associated with the report?
Yes, the market keyword associated with the report is "Connected Drug Delivery Devices Market," which aids in identifying and referencing the specific market segment covered.
12. How do I determine which pricing option suits my needs best?
The pricing options vary based on user requirements and access needs. Individual users may opt for single-user licenses, while businesses requiring broader access may choose multi-user or enterprise licenses for cost-effective access to the report.
13. Are there any additional resources or data provided in the Connected Drug Delivery Devices Market report?
While the report offers comprehensive insights, it's advisable to review the specific contents or supplementary materials provided to ascertain if additional resources or data are available.
14. How can I stay updated on further developments or reports in the Connected Drug Delivery Devices Market?
To stay informed about further developments, trends, and reports in the Connected Drug Delivery Devices Market, consider subscribing to industry newsletters, following relevant companies and organizations, or regularly checking reputable industry news sources and publications.
Methodology
Step 1 - Identification of Relevant Samples Size from Population Database


Step 2 - Approaches for Defining Global Market Size (Value, Volume* & Price*)

Note*: In applicable scenarios
Step 3 - Data Sources
Primary Research
- Web Analytics
- Survey Reports
- Research Institute
- Latest Research Reports
- Opinion Leaders
Secondary Research
- Annual Reports
- White Paper
- Latest Press Release
- Industry Association
- Paid Database
- Investor Presentations

Step 4 - Data Triangulation
Involves using different sources of information in order to increase the validity of a study
These sources are likely to be stakeholders in a program - participants, other researchers, program staff, other community members, and so on.
Then we put all data in single framework & apply various statistical tools to find out the dynamic on the market.
During the analysis stage, feedback from the stakeholder groups would be compared to determine areas of agreement as well as areas of divergence