

Key Insights
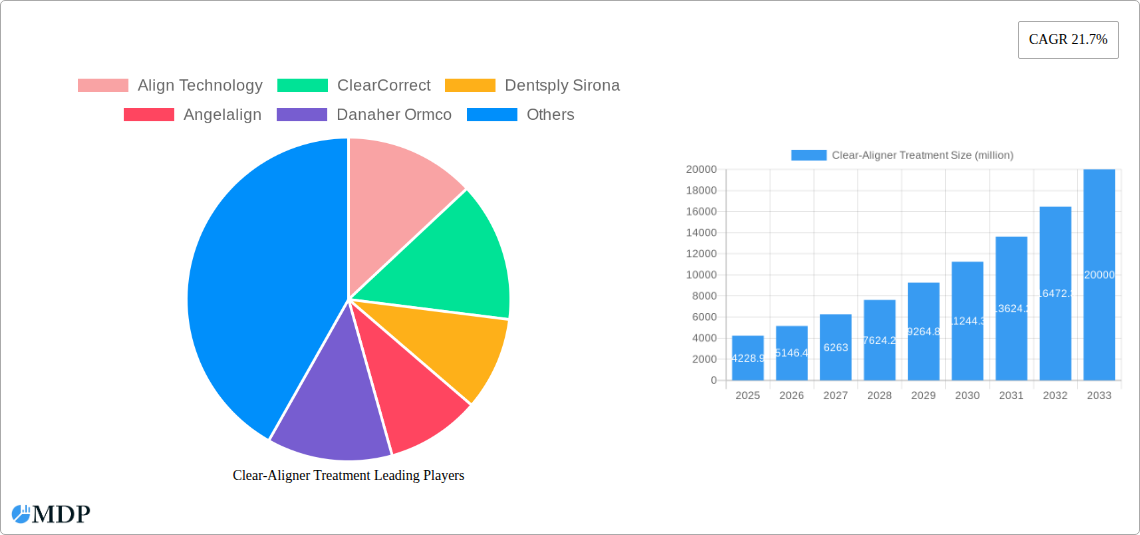
The global clear aligner treatment market is experiencing robust growth, projected to reach a substantial size. The market's Compound Annual Growth Rate (CAGR) of 21.7% from 2019 to 2024 indicates significant expansion, driven by several key factors. Increased consumer awareness of cosmetic dentistry, a rising preference for minimally invasive orthodontic treatments, and technological advancements leading to more comfortable and efficient aligner systems are major contributors. The convenience and discreet nature of clear aligners compared to traditional metal braces are also fueling market growth, particularly among adults seeking aesthetic solutions. Furthermore, the increasing affordability of clear aligner treatments through various payment plans and insurance coverage options expands the accessible market segment. The competitive landscape is dynamic, with established players like Align Technology and Dentsply Sirona alongside emerging innovative companies driving competition and technological innovation. This fosters a market characterized by ongoing improvement in aligner technology, materials, and treatment processes, enhancing patient experience and treatment outcomes.
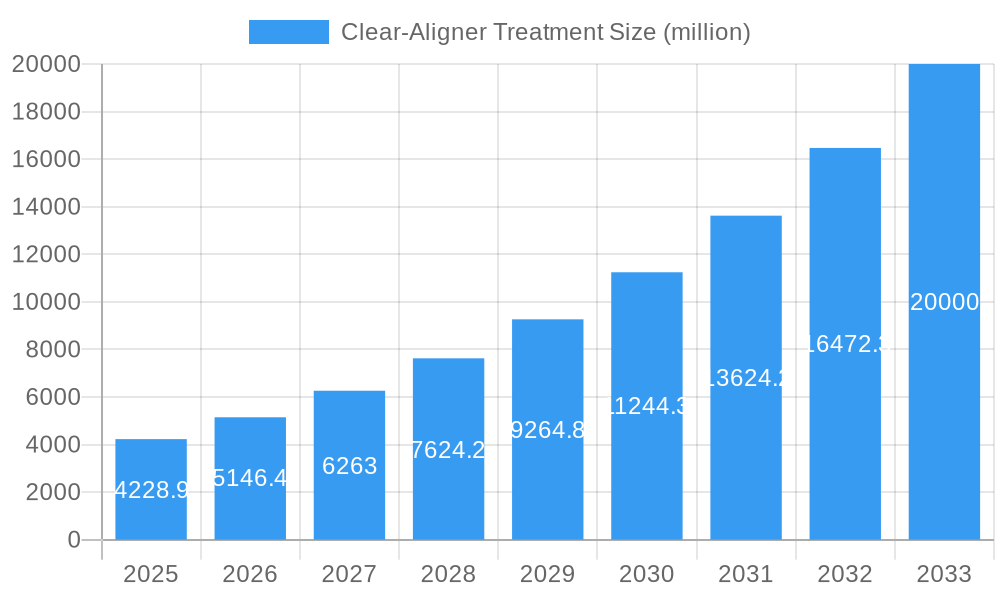
Clear-Aligner Treatment Market Size (In Billion)
Looking forward, the market is poised for continued expansion through 2033. While specific regional breakdowns and segment data are unavailable, a reasonable estimate, considering the CAGR and market trends, suggests a significant portion of the market is concentrated in developed regions like North America and Europe, with developing economies demonstrating increasing adoption rates. Future growth will likely depend on factors such as continued technological innovation, expansion into emerging markets, and the accessibility of financing options. The market will also see continued competition amongst established and emerging companies, pushing for better products, services, and patient care. Sustained growth in the coming years is predicted based on current market trends and the increasing global demand for aesthetic and effective orthodontic solutions.
Clear-Aligner Treatment Company Market Share
This comprehensive report provides an in-depth analysis of the global clear-aligner treatment market, offering invaluable insights for industry stakeholders, investors, and businesses seeking to navigate this rapidly evolving sector. The report covers the period 2019-2033, with a focus on the forecast period 2025-2033, and includes detailed market sizing, segmentation, and competitive landscape analysis. The global market was valued at $XX million in 2024 and is projected to reach $XX million by 2033, exhibiting a CAGR of XX% during the forecast period.
Clear-Aligner Treatment Market Dynamics & Concentration
The global clear-aligner treatment market is characterized by a moderately concentrated landscape, with key players such as Align Technology, ClearCorrect, and Dentsply Sirona holding significant market share. The market share of these three companies combined is estimated at xx%. However, the market also witnesses the presence of several smaller players and emerging companies, fostering competition and driving innovation. Several factors influence market dynamics:
- Innovation Drivers: Continuous advancements in aligner technology, including improved materials, software for treatment planning, and faster treatment times, are driving market growth.
- Regulatory Frameworks: Stringent regulatory approvals and safety standards impact market entry and product development. Variations in regulatory frameworks across different regions influence market penetration.
- Product Substitutes: Traditional orthodontic treatments (braces) remain a significant competitor, although clear aligners are gaining popularity due to their aesthetic appeal and convenience.
- End-User Trends: Increasing awareness of cosmetic dentistry and the demand for discreet orthodontic solutions are key drivers for market expansion. The rising disposable incomes in developing economies contribute to higher adoption rates.
- M&A Activities: The market has witnessed several mergers and acquisitions in recent years, with larger players consolidating their market presence and expanding their product portfolios. The number of M&A deals in the past five years is estimated at xx. These activities have implications for market competition and pricing.
Clear-Aligner Treatment Industry Trends & Analysis
The clear-aligner treatment market is experiencing robust growth, propelled by several key trends:
- Technological Disruptions: The integration of AI and machine learning in treatment planning and monitoring is revolutionizing the industry. 3D printing technology is improving the efficiency and precision of aligner fabrication.
- Market Growth Drivers: Increasing consumer awareness of clear aligners, their aesthetic advantages, and convenience are major drivers. The rising prevalence of malocclusion and the expanding middle class in emerging markets further contribute to the market's expansion.
- Consumer Preferences: The preference for discreet and comfortable orthodontic treatments is fueling demand for clear aligners. The growing adoption of telehealth and remote monitoring is also influencing consumer choices.
- Competitive Dynamics: Intense competition among established players and emerging companies drives innovation and price optimization. The market is witnessing the emergence of direct-to-consumer brands, challenging traditional orthodontic practices. The market penetration of clear aligners compared to traditional braces is estimated at xx% in 2024, with projections of reaching xx% by 2033.
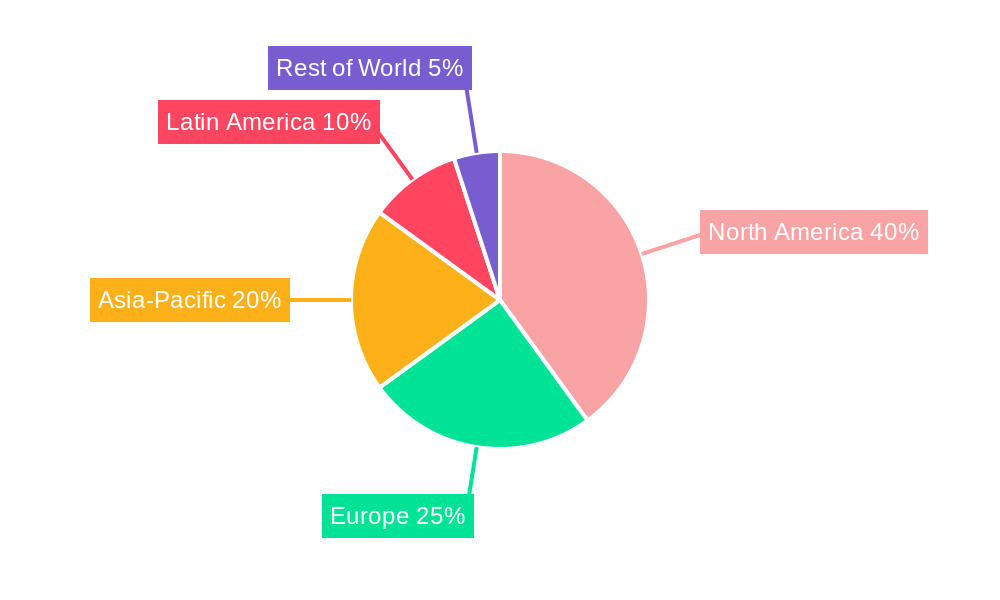
Leading Markets & Segments in Clear-Aligner Treatment
North America currently dominates the global clear-aligner treatment market, driven by high consumer awareness, advanced healthcare infrastructure, and a strong presence of major market players.
- Key Drivers in North America:
- Strong consumer preference for aesthetically pleasing orthodontic solutions.
- High disposable incomes and a willingness to spend on cosmetic procedures.
- Well-established healthcare infrastructure and high penetration of dental insurance.
- Presence of significant players and technological advancements.
The market is segmented by type (invisible aligners, lingual aligners), by application (adult orthodontics, pediatric orthodontics) and by distribution channel. Adult orthodontics represents a larger segment of the market compared to pediatric orthodontics due to higher disposable income and increased awareness about cosmetic dentistry among adults.
Clear-Aligner Treatment Product Developments
Recent advancements in clear-aligner technology include improved materials that offer greater strength and comfort, advanced software for precise treatment planning, and the development of more sophisticated aligner designs to address complex orthodontic cases. This leads to improved treatment outcomes and increased patient satisfaction, leading to a competitive advantage for companies offering these advanced solutions. The use of AI in treatment planning is rapidly gaining traction and promises to optimize treatment efficiency and reduce treatment times.
Key Drivers of Clear-Aligner Treatment Growth
Several key factors are driving the growth of the clear-aligner treatment market:
- Technological Advancements: Innovations in aligner materials, manufacturing processes, and software are enhancing treatment efficacy and patient experience.
- Economic Factors: Rising disposable incomes in developing countries and increased access to dental insurance are fueling demand.
- Regulatory Approvals: Favorable regulatory landscapes and approvals for new technologies are facilitating market entry and expansion.
Challenges in the Clear-Aligner Treatment Market
Despite the promising growth outlook, the clear-aligner treatment market faces certain challenges:
- High Initial Investment Costs: The relatively high cost of treatment can act as a barrier for certain consumers.
- Competition from Traditional Braces: Traditional braces remain a prevalent and established treatment option.
- Treatment Complexity: Complex orthodontic cases may not be suitable for clear aligner treatment.
Emerging Opportunities in Clear-Aligner Treatment
The long-term growth potential of the clear-aligner treatment market is significant, fueled by several opportunities:
- Expansion in Emerging Markets: Increased awareness and affordability in developing countries will lead to robust market growth.
- Technological Innovations: Continued advancements in materials science, software, and manufacturing will further enhance treatment outcomes.
- Strategic Partnerships: Collaborations between aligner manufacturers and dental practices will optimize market penetration.
Leading Players in the Clear-Aligner Treatment Sector
- Align Technology
- ClearCorrect
- Dentsply Sirona
- Angelalign
- Danaher Ormco
- Smartee
- Irok
- BioMers
- ClearPath Orthodontics
- Geniova
- Clarus Company
- EZ SMILE
- 3M
- Scheu Dental
Key Milestones in Clear-Aligner Treatment Industry
- 2020: Increased adoption of telehealth for remote monitoring of aligner treatment.
- 2021: Launch of several new aligner systems with improved materials and design.
- 2022: Significant investment in AI-powered treatment planning software.
- 2023: Several mergers and acquisitions consolidating market share.
Strategic Outlook for Clear-Aligner Treatment Market
The future of the clear-aligner treatment market is bright, driven by continuous technological advancements, rising consumer demand, and expansion into new markets. Companies focusing on innovation, strategic partnerships, and efficient treatment delivery will be best positioned to capture market share and benefit from the significant growth potential. The market is poised for substantial expansion, presenting significant opportunities for both established players and emerging companies.
Clear-Aligner Treatment Segmentation
-
1. Application
- 1.1. Adults
- 1.2. Teenagers
-
2. Types
- 2.1. Professional Treatment
- 2.2. Foundation Treatment
Clear-Aligner Treatment Segmentation By Geography
-
1. North America
- 1.1. United States
- 1.2. Canada
- 1.3. Mexico
-
2. South America
- 2.1. Brazil
- 2.2. Argentina
- 2.3. Rest of South America
-
3. Europe
- 3.1. United Kingdom
- 3.2. Germany
- 3.3. France
- 3.4. Italy
- 3.5. Spain
- 3.6. Russia
- 3.7. Benelux
- 3.8. Nordics
- 3.9. Rest of Europe
-
4. Middle East & Africa
- 4.1. Turkey
- 4.2. Israel
- 4.3. GCC
- 4.4. North Africa
- 4.5. South Africa
- 4.6. Rest of Middle East & Africa
-
5. Asia Pacific
- 5.1. China
- 5.2. India
- 5.3. Japan
- 5.4. South Korea
- 5.5. ASEAN
- 5.6. Oceania
- 5.7. Rest of Asia Pacific
Clear-Aligner Treatment Regional Market Share
Geographic Coverage of Clear-Aligner Treatment
Clear-Aligner Treatment REPORT HIGHLIGHTS
| Aspects | Details |
|---|---|
| Study Period | 2020-2034 |
| Base Year | 2025 |
| Estimated Year | 2026 |
| Forecast Period | 2026-2034 |
| Historical Period | 2020-2025 |
| Growth Rate | CAGR of 15% from 2020-2034 |
| Segmentation |
|
Table of Contents
- 1. Introduction
- 1.1. Research Scope
- 1.2. Market Segmentation
- 1.3. Research Objective
- 1.4. Definitions and Assumptions
- 2. Executive Summary
- 2.1. Market Snapshot
- 3. Market Dynamics
- 3.1. Market Drivers
- 3.2. Market Restrains
- 3.3. Market Trends
- 3.4. Market Opportunities
- 4. Market Factor Analysis
- 4.1. Porters Five Forces
- 4.1.1. Bargaining Power of Suppliers
- 4.1.2. Bargaining Power of Buyers
- 4.1.3. Threat of New Entrants
- 4.1.4. Threat of Substitutes
- 4.1.5. Competitive Rivalry
- 4.2. PESTEL analysis
- 4.3. BCG Analysis
- 4.3.1. Stars (High Growth, High Market Share)
- 4.3.2. Cash Cows (Low Growth, High Market Share)
- 4.3.3. Question Mark (High Growth, Low Market Share)
- 4.3.4. Dogs (Low Growth, Low Market Share)
- 4.4. Ansoff Matrix Analysis
- 4.5. Supply Chain Analysis
- 4.6. Regulatory Landscape
- 4.7. Current Market Potential and Opportunity Assessment (TAM–SAM–SOM Framework)
- 4.8. MDP Analyst Note
- 4.1. Porters Five Forces
- 5. Market Analysis, Insights and Forecast 2021-2033
- 5.1. Market Analysis, Insights and Forecast - by Application
- 5.1.1. Adults
- 5.1.2. Teenagers
- 5.2. Market Analysis, Insights and Forecast - by Types
- 5.2.1. Professional Treatment
- 5.2.2. Foundation Treatment
- 5.3. Market Analysis, Insights and Forecast - by Region
- 5.3.1. North America
- 5.3.2. South America
- 5.3.3. Europe
- 5.3.4. Middle East & Africa
- 5.3.5. Asia Pacific
- 5.1. Market Analysis, Insights and Forecast - by Application
- 6. Global Clear-Aligner Treatment Analysis, Insights and Forecast, 2021-2033
- 6.1. Market Analysis, Insights and Forecast - by Application
- 6.1.1. Adults
- 6.1.2. Teenagers
- 6.2. Market Analysis, Insights and Forecast - by Types
- 6.2.1. Professional Treatment
- 6.2.2. Foundation Treatment
- 6.1. Market Analysis, Insights and Forecast - by Application
- 7. North America Clear-Aligner Treatment Analysis, Insights and Forecast, 2020-2032
- 7.1. Market Analysis, Insights and Forecast - by Application
- 7.1.1. Adults
- 7.1.2. Teenagers
- 7.2. Market Analysis, Insights and Forecast - by Types
- 7.2.1. Professional Treatment
- 7.2.2. Foundation Treatment
- 7.1. Market Analysis, Insights and Forecast - by Application
- 8. South America Clear-Aligner Treatment Analysis, Insights and Forecast, 2020-2032
- 8.1. Market Analysis, Insights and Forecast - by Application
- 8.1.1. Adults
- 8.1.2. Teenagers
- 8.2. Market Analysis, Insights and Forecast - by Types
- 8.2.1. Professional Treatment
- 8.2.2. Foundation Treatment
- 8.1. Market Analysis, Insights and Forecast - by Application
- 9. Europe Clear-Aligner Treatment Analysis, Insights and Forecast, 2020-2032
- 9.1. Market Analysis, Insights and Forecast - by Application
- 9.1.1. Adults
- 9.1.2. Teenagers
- 9.2. Market Analysis, Insights and Forecast - by Types
- 9.2.1. Professional Treatment
- 9.2.2. Foundation Treatment
- 9.1. Market Analysis, Insights and Forecast - by Application
- 10. Middle East & Africa Clear-Aligner Treatment Analysis, Insights and Forecast, 2020-2032
- 10.1. Market Analysis, Insights and Forecast - by Application
- 10.1.1. Adults
- 10.1.2. Teenagers
- 10.2. Market Analysis, Insights and Forecast - by Types
- 10.2.1. Professional Treatment
- 10.2.2. Foundation Treatment
- 10.1. Market Analysis, Insights and Forecast - by Application
- 11. Asia Pacific Clear-Aligner Treatment Analysis, Insights and Forecast, 2020-2032
- 11.1. Market Analysis, Insights and Forecast - by Application
- 11.1.1. Adults
- 11.1.2. Teenagers
- 11.2. Market Analysis, Insights and Forecast - by Types
- 11.2.1. Professional Treatment
- 11.2.2. Foundation Treatment
- 11.1. Market Analysis, Insights and Forecast - by Application
- 12. Competitive Analysis
- 12.1. Company Profiles
- 12.1.1 Align Technology
- 12.1.1.1. Company Overview
- 12.1.1.2. Products
- 12.1.1.3. Company Financials
- 12.1.1.4. SWOT Analysis
- 12.1.2 ClearCorrect
- 12.1.2.1. Company Overview
- 12.1.2.2. Products
- 12.1.2.3. Company Financials
- 12.1.2.4. SWOT Analysis
- 12.1.3 Dentsply Sirona
- 12.1.3.1. Company Overview
- 12.1.3.2. Products
- 12.1.3.3. Company Financials
- 12.1.3.4. SWOT Analysis
- 12.1.4 Angelalign
- 12.1.4.1. Company Overview
- 12.1.4.2. Products
- 12.1.4.3. Company Financials
- 12.1.4.4. SWOT Analysis
- 12.1.5 Danaher Ormco
- 12.1.5.1. Company Overview
- 12.1.5.2. Products
- 12.1.5.3. Company Financials
- 12.1.5.4. SWOT Analysis
- 12.1.6 Smartee
- 12.1.6.1. Company Overview
- 12.1.6.2. Products
- 12.1.6.3. Company Financials
- 12.1.6.4. SWOT Analysis
- 12.1.7 Irok
- 12.1.7.1. Company Overview
- 12.1.7.2. Products
- 12.1.7.3. Company Financials
- 12.1.7.4. SWOT Analysis
- 12.1.8 BioMers
- 12.1.8.1. Company Overview
- 12.1.8.2. Products
- 12.1.8.3. Company Financials
- 12.1.8.4. SWOT Analysis
- 12.1.9 ClearPath Orthodontics
- 12.1.9.1. Company Overview
- 12.1.9.2. Products
- 12.1.9.3. Company Financials
- 12.1.9.4. SWOT Analysis
- 12.1.10 Geniova
- 12.1.10.1. Company Overview
- 12.1.10.2. Products
- 12.1.10.3. Company Financials
- 12.1.10.4. SWOT Analysis
- 12.1.11 Clarus Company
- 12.1.11.1. Company Overview
- 12.1.11.2. Products
- 12.1.11.3. Company Financials
- 12.1.11.4. SWOT Analysis
- 12.1.12 EZ SMILE
- 12.1.12.1. Company Overview
- 12.1.12.2. Products
- 12.1.12.3. Company Financials
- 12.1.12.4. SWOT Analysis
- 12.1.13 3M
- 12.1.13.1. Company Overview
- 12.1.13.2. Products
- 12.1.13.3. Company Financials
- 12.1.13.4. SWOT Analysis
- 12.1.14 Scheu Dental
- 12.1.14.1. Company Overview
- 12.1.14.2. Products
- 12.1.14.3. Company Financials
- 12.1.14.4. SWOT Analysis
- 12.1.1 Align Technology
- 12.2. Market Entropy
- 12.2.1 Company's Key Areas Served
- 12.2.2 Recent Developments
- 12.3. Company Market Share Analysis 2025
- 12.3.1 Top 5 Companies Market Share Analysis
- 12.3.2 Top 3 Companies Market Share Analysis
- 12.4. List of Potential Customers
- 13. Research Methodology
List of Figures
- Figure 1: Global Clear-Aligner Treatment Revenue Breakdown (undefined, %) by Region 2025 & 2033
- Figure 2: Global Clear-Aligner Treatment Volume Breakdown (K, %) by Region 2025 & 2033
- Figure 3: North America Clear-Aligner Treatment Revenue (undefined), by Application 2025 & 2033
- Figure 4: North America Clear-Aligner Treatment Volume (K), by Application 2025 & 2033
- Figure 5: North America Clear-Aligner Treatment Revenue Share (%), by Application 2025 & 2033
- Figure 6: North America Clear-Aligner Treatment Volume Share (%), by Application 2025 & 2033
- Figure 7: North America Clear-Aligner Treatment Revenue (undefined), by Types 2025 & 2033
- Figure 8: North America Clear-Aligner Treatment Volume (K), by Types 2025 & 2033
- Figure 9: North America Clear-Aligner Treatment Revenue Share (%), by Types 2025 & 2033
- Figure 10: North America Clear-Aligner Treatment Volume Share (%), by Types 2025 & 2033
- Figure 11: North America Clear-Aligner Treatment Revenue (undefined), by Country 2025 & 2033
- Figure 12: North America Clear-Aligner Treatment Volume (K), by Country 2025 & 2033
- Figure 13: North America Clear-Aligner Treatment Revenue Share (%), by Country 2025 & 2033
- Figure 14: North America Clear-Aligner Treatment Volume Share (%), by Country 2025 & 2033
- Figure 15: South America Clear-Aligner Treatment Revenue (undefined), by Application 2025 & 2033
- Figure 16: South America Clear-Aligner Treatment Volume (K), by Application 2025 & 2033
- Figure 17: South America Clear-Aligner Treatment Revenue Share (%), by Application 2025 & 2033
- Figure 18: South America Clear-Aligner Treatment Volume Share (%), by Application 2025 & 2033
- Figure 19: South America Clear-Aligner Treatment Revenue (undefined), by Types 2025 & 2033
- Figure 20: South America Clear-Aligner Treatment Volume (K), by Types 2025 & 2033
- Figure 21: South America Clear-Aligner Treatment Revenue Share (%), by Types 2025 & 2033
- Figure 22: South America Clear-Aligner Treatment Volume Share (%), by Types 2025 & 2033
- Figure 23: South America Clear-Aligner Treatment Revenue (undefined), by Country 2025 & 2033
- Figure 24: South America Clear-Aligner Treatment Volume (K), by Country 2025 & 2033
- Figure 25: South America Clear-Aligner Treatment Revenue Share (%), by Country 2025 & 2033
- Figure 26: South America Clear-Aligner Treatment Volume Share (%), by Country 2025 & 2033
- Figure 27: Europe Clear-Aligner Treatment Revenue (undefined), by Application 2025 & 2033
- Figure 28: Europe Clear-Aligner Treatment Volume (K), by Application 2025 & 2033
- Figure 29: Europe Clear-Aligner Treatment Revenue Share (%), by Application 2025 & 2033
- Figure 30: Europe Clear-Aligner Treatment Volume Share (%), by Application 2025 & 2033
- Figure 31: Europe Clear-Aligner Treatment Revenue (undefined), by Types 2025 & 2033
- Figure 32: Europe Clear-Aligner Treatment Volume (K), by Types 2025 & 2033
- Figure 33: Europe Clear-Aligner Treatment Revenue Share (%), by Types 2025 & 2033
- Figure 34: Europe Clear-Aligner Treatment Volume Share (%), by Types 2025 & 2033
- Figure 35: Europe Clear-Aligner Treatment Revenue (undefined), by Country 2025 & 2033
- Figure 36: Europe Clear-Aligner Treatment Volume (K), by Country 2025 & 2033
- Figure 37: Europe Clear-Aligner Treatment Revenue Share (%), by Country 2025 & 2033
- Figure 38: Europe Clear-Aligner Treatment Volume Share (%), by Country 2025 & 2033
- Figure 39: Middle East & Africa Clear-Aligner Treatment Revenue (undefined), by Application 2025 & 2033
- Figure 40: Middle East & Africa Clear-Aligner Treatment Volume (K), by Application 2025 & 2033
- Figure 41: Middle East & Africa Clear-Aligner Treatment Revenue Share (%), by Application 2025 & 2033
- Figure 42: Middle East & Africa Clear-Aligner Treatment Volume Share (%), by Application 2025 & 2033
- Figure 43: Middle East & Africa Clear-Aligner Treatment Revenue (undefined), by Types 2025 & 2033
- Figure 44: Middle East & Africa Clear-Aligner Treatment Volume (K), by Types 2025 & 2033
- Figure 45: Middle East & Africa Clear-Aligner Treatment Revenue Share (%), by Types 2025 & 2033
- Figure 46: Middle East & Africa Clear-Aligner Treatment Volume Share (%), by Types 2025 & 2033
- Figure 47: Middle East & Africa Clear-Aligner Treatment Revenue (undefined), by Country 2025 & 2033
- Figure 48: Middle East & Africa Clear-Aligner Treatment Volume (K), by Country 2025 & 2033
- Figure 49: Middle East & Africa Clear-Aligner Treatment Revenue Share (%), by Country 2025 & 2033
- Figure 50: Middle East & Africa Clear-Aligner Treatment Volume Share (%), by Country 2025 & 2033
- Figure 51: Asia Pacific Clear-Aligner Treatment Revenue (undefined), by Application 2025 & 2033
- Figure 52: Asia Pacific Clear-Aligner Treatment Volume (K), by Application 2025 & 2033
- Figure 53: Asia Pacific Clear-Aligner Treatment Revenue Share (%), by Application 2025 & 2033
- Figure 54: Asia Pacific Clear-Aligner Treatment Volume Share (%), by Application 2025 & 2033
- Figure 55: Asia Pacific Clear-Aligner Treatment Revenue (undefined), by Types 2025 & 2033
- Figure 56: Asia Pacific Clear-Aligner Treatment Volume (K), by Types 2025 & 2033
- Figure 57: Asia Pacific Clear-Aligner Treatment Revenue Share (%), by Types 2025 & 2033
- Figure 58: Asia Pacific Clear-Aligner Treatment Volume Share (%), by Types 2025 & 2033
- Figure 59: Asia Pacific Clear-Aligner Treatment Revenue (undefined), by Country 2025 & 2033
- Figure 60: Asia Pacific Clear-Aligner Treatment Volume (K), by Country 2025 & 2033
- Figure 61: Asia Pacific Clear-Aligner Treatment Revenue Share (%), by Country 2025 & 2033
- Figure 62: Asia Pacific Clear-Aligner Treatment Volume Share (%), by Country 2025 & 2033
List of Tables
- Table 1: Global Clear-Aligner Treatment Revenue undefined Forecast, by Application 2020 & 2033
- Table 2: Global Clear-Aligner Treatment Volume K Forecast, by Application 2020 & 2033
- Table 3: Global Clear-Aligner Treatment Revenue undefined Forecast, by Types 2020 & 2033
- Table 4: Global Clear-Aligner Treatment Volume K Forecast, by Types 2020 & 2033
- Table 5: Global Clear-Aligner Treatment Revenue undefined Forecast, by Region 2020 & 2033
- Table 6: Global Clear-Aligner Treatment Volume K Forecast, by Region 2020 & 2033
- Table 7: Global Clear-Aligner Treatment Revenue undefined Forecast, by Application 2020 & 2033
- Table 8: Global Clear-Aligner Treatment Volume K Forecast, by Application 2020 & 2033
- Table 9: Global Clear-Aligner Treatment Revenue undefined Forecast, by Types 2020 & 2033
- Table 10: Global Clear-Aligner Treatment Volume K Forecast, by Types 2020 & 2033
- Table 11: Global Clear-Aligner Treatment Revenue undefined Forecast, by Country 2020 & 2033
- Table 12: Global Clear-Aligner Treatment Volume K Forecast, by Country 2020 & 2033
- Table 13: United States Clear-Aligner Treatment Revenue (undefined) Forecast, by Application 2020 & 2033
- Table 14: United States Clear-Aligner Treatment Volume (K) Forecast, by Application 2020 & 2033
- Table 15: Canada Clear-Aligner Treatment Revenue (undefined) Forecast, by Application 2020 & 2033
- Table 16: Canada Clear-Aligner Treatment Volume (K) Forecast, by Application 2020 & 2033
- Table 17: Mexico Clear-Aligner Treatment Revenue (undefined) Forecast, by Application 2020 & 2033
- Table 18: Mexico Clear-Aligner Treatment Volume (K) Forecast, by Application 2020 & 2033
- Table 19: Global Clear-Aligner Treatment Revenue undefined Forecast, by Application 2020 & 2033
- Table 20: Global Clear-Aligner Treatment Volume K Forecast, by Application 2020 & 2033
- Table 21: Global Clear-Aligner Treatment Revenue undefined Forecast, by Types 2020 & 2033
- Table 22: Global Clear-Aligner Treatment Volume K Forecast, by Types 2020 & 2033
- Table 23: Global Clear-Aligner Treatment Revenue undefined Forecast, by Country 2020 & 2033
- Table 24: Global Clear-Aligner Treatment Volume K Forecast, by Country 2020 & 2033
- Table 25: Brazil Clear-Aligner Treatment Revenue (undefined) Forecast, by Application 2020 & 2033
- Table 26: Brazil Clear-Aligner Treatment Volume (K) Forecast, by Application 2020 & 2033
- Table 27: Argentina Clear-Aligner Treatment Revenue (undefined) Forecast, by Application 2020 & 2033
- Table 28: Argentina Clear-Aligner Treatment Volume (K) Forecast, by Application 2020 & 2033
- Table 29: Rest of South America Clear-Aligner Treatment Revenue (undefined) Forecast, by Application 2020 & 2033
- Table 30: Rest of South America Clear-Aligner Treatment Volume (K) Forecast, by Application 2020 & 2033
- Table 31: Global Clear-Aligner Treatment Revenue undefined Forecast, by Application 2020 & 2033
- Table 32: Global Clear-Aligner Treatment Volume K Forecast, by Application 2020 & 2033
- Table 33: Global Clear-Aligner Treatment Revenue undefined Forecast, by Types 2020 & 2033
- Table 34: Global Clear-Aligner Treatment Volume K Forecast, by Types 2020 & 2033
- Table 35: Global Clear-Aligner Treatment Revenue undefined Forecast, by Country 2020 & 2033
- Table 36: Global Clear-Aligner Treatment Volume K Forecast, by Country 2020 & 2033
- Table 37: United Kingdom Clear-Aligner Treatment Revenue (undefined) Forecast, by Application 2020 & 2033
- Table 38: United Kingdom Clear-Aligner Treatment Volume (K) Forecast, by Application 2020 & 2033
- Table 39: Germany Clear-Aligner Treatment Revenue (undefined) Forecast, by Application 2020 & 2033
- Table 40: Germany Clear-Aligner Treatment Volume (K) Forecast, by Application 2020 & 2033
- Table 41: France Clear-Aligner Treatment Revenue (undefined) Forecast, by Application 2020 & 2033
- Table 42: France Clear-Aligner Treatment Volume (K) Forecast, by Application 2020 & 2033
- Table 43: Italy Clear-Aligner Treatment Revenue (undefined) Forecast, by Application 2020 & 2033
- Table 44: Italy Clear-Aligner Treatment Volume (K) Forecast, by Application 2020 & 2033
- Table 45: Spain Clear-Aligner Treatment Revenue (undefined) Forecast, by Application 2020 & 2033
- Table 46: Spain Clear-Aligner Treatment Volume (K) Forecast, by Application 2020 & 2033
- Table 47: Russia Clear-Aligner Treatment Revenue (undefined) Forecast, by Application 2020 & 2033
- Table 48: Russia Clear-Aligner Treatment Volume (K) Forecast, by Application 2020 & 2033
- Table 49: Benelux Clear-Aligner Treatment Revenue (undefined) Forecast, by Application 2020 & 2033
- Table 50: Benelux Clear-Aligner Treatment Volume (K) Forecast, by Application 2020 & 2033
- Table 51: Nordics Clear-Aligner Treatment Revenue (undefined) Forecast, by Application 2020 & 2033
- Table 52: Nordics Clear-Aligner Treatment Volume (K) Forecast, by Application 2020 & 2033
- Table 53: Rest of Europe Clear-Aligner Treatment Revenue (undefined) Forecast, by Application 2020 & 2033
- Table 54: Rest of Europe Clear-Aligner Treatment Volume (K) Forecast, by Application 2020 & 2033
- Table 55: Global Clear-Aligner Treatment Revenue undefined Forecast, by Application 2020 & 2033
- Table 56: Global Clear-Aligner Treatment Volume K Forecast, by Application 2020 & 2033
- Table 57: Global Clear-Aligner Treatment Revenue undefined Forecast, by Types 2020 & 2033
- Table 58: Global Clear-Aligner Treatment Volume K Forecast, by Types 2020 & 2033
- Table 59: Global Clear-Aligner Treatment Revenue undefined Forecast, by Country 2020 & 2033
- Table 60: Global Clear-Aligner Treatment Volume K Forecast, by Country 2020 & 2033
- Table 61: Turkey Clear-Aligner Treatment Revenue (undefined) Forecast, by Application 2020 & 2033
- Table 62: Turkey Clear-Aligner Treatment Volume (K) Forecast, by Application 2020 & 2033
- Table 63: Israel Clear-Aligner Treatment Revenue (undefined) Forecast, by Application 2020 & 2033
- Table 64: Israel Clear-Aligner Treatment Volume (K) Forecast, by Application 2020 & 2033
- Table 65: GCC Clear-Aligner Treatment Revenue (undefined) Forecast, by Application 2020 & 2033
- Table 66: GCC Clear-Aligner Treatment Volume (K) Forecast, by Application 2020 & 2033
- Table 67: North Africa Clear-Aligner Treatment Revenue (undefined) Forecast, by Application 2020 & 2033
- Table 68: North Africa Clear-Aligner Treatment Volume (K) Forecast, by Application 2020 & 2033
- Table 69: South Africa Clear-Aligner Treatment Revenue (undefined) Forecast, by Application 2020 & 2033
- Table 70: South Africa Clear-Aligner Treatment Volume (K) Forecast, by Application 2020 & 2033
- Table 71: Rest of Middle East & Africa Clear-Aligner Treatment Revenue (undefined) Forecast, by Application 2020 & 2033
- Table 72: Rest of Middle East & Africa Clear-Aligner Treatment Volume (K) Forecast, by Application 2020 & 2033
- Table 73: Global Clear-Aligner Treatment Revenue undefined Forecast, by Application 2020 & 2033
- Table 74: Global Clear-Aligner Treatment Volume K Forecast, by Application 2020 & 2033
- Table 75: Global Clear-Aligner Treatment Revenue undefined Forecast, by Types 2020 & 2033
- Table 76: Global Clear-Aligner Treatment Volume K Forecast, by Types 2020 & 2033
- Table 77: Global Clear-Aligner Treatment Revenue undefined Forecast, by Country 2020 & 2033
- Table 78: Global Clear-Aligner Treatment Volume K Forecast, by Country 2020 & 2033
- Table 79: China Clear-Aligner Treatment Revenue (undefined) Forecast, by Application 2020 & 2033
- Table 80: China Clear-Aligner Treatment Volume (K) Forecast, by Application 2020 & 2033
- Table 81: India Clear-Aligner Treatment Revenue (undefined) Forecast, by Application 2020 & 2033
- Table 82: India Clear-Aligner Treatment Volume (K) Forecast, by Application 2020 & 2033
- Table 83: Japan Clear-Aligner Treatment Revenue (undefined) Forecast, by Application 2020 & 2033
- Table 84: Japan Clear-Aligner Treatment Volume (K) Forecast, by Application 2020 & 2033
- Table 85: South Korea Clear-Aligner Treatment Revenue (undefined) Forecast, by Application 2020 & 2033
- Table 86: South Korea Clear-Aligner Treatment Volume (K) Forecast, by Application 2020 & 2033
- Table 87: ASEAN Clear-Aligner Treatment Revenue (undefined) Forecast, by Application 2020 & 2033
- Table 88: ASEAN Clear-Aligner Treatment Volume (K) Forecast, by Application 2020 & 2033
- Table 89: Oceania Clear-Aligner Treatment Revenue (undefined) Forecast, by Application 2020 & 2033
- Table 90: Oceania Clear-Aligner Treatment Volume (K) Forecast, by Application 2020 & 2033
- Table 91: Rest of Asia Pacific Clear-Aligner Treatment Revenue (undefined) Forecast, by Application 2020 & 2033
- Table 92: Rest of Asia Pacific Clear-Aligner Treatment Volume (K) Forecast, by Application 2020 & 2033
Frequently Asked Questions
1. What is the projected Compound Annual Growth Rate (CAGR) of the Clear-Aligner Treatment?
The projected CAGR is approximately 15%.
2. Which companies are prominent players in the Clear-Aligner Treatment?
Key companies in the market include Align Technology, ClearCorrect, Dentsply Sirona, Angelalign, Danaher Ormco, Smartee, Irok, BioMers, ClearPath Orthodontics, Geniova, Clarus Company, EZ SMILE, 3M, Scheu Dental.
3. What are the main segments of the Clear-Aligner Treatment?
The market segments include Application, Types.
4. Can you provide details about the market size?
The market size is estimated to be USD XXX N/A as of 2022.
5. What are some drivers contributing to market growth?
N/A
6. What are the notable trends driving market growth?
N/A
7. Are there any restraints impacting market growth?
N/A
8. Can you provide examples of recent developments in the market?
N/A
9. What pricing options are available for accessing the report?
Pricing options include single-user, multi-user, and enterprise licenses priced at USD 3950.00, USD 5925.00, and USD 7900.00 respectively.
10. Is the market size provided in terms of value or volume?
The market size is provided in terms of value, measured in N/A and volume, measured in K.
11. Are there any specific market keywords associated with the report?
Yes, the market keyword associated with the report is "Clear-Aligner Treatment," which aids in identifying and referencing the specific market segment covered.
12. How do I determine which pricing option suits my needs best?
The pricing options vary based on user requirements and access needs. Individual users may opt for single-user licenses, while businesses requiring broader access may choose multi-user or enterprise licenses for cost-effective access to the report.
13. Are there any additional resources or data provided in the Clear-Aligner Treatment report?
While the report offers comprehensive insights, it's advisable to review the specific contents or supplementary materials provided to ascertain if additional resources or data are available.
14. How can I stay updated on further developments or reports in the Clear-Aligner Treatment?
To stay informed about further developments, trends, and reports in the Clear-Aligner Treatment, consider subscribing to industry newsletters, following relevant companies and organizations, or regularly checking reputable industry news sources and publications.
Methodology
Step 1 - Identification of Relevant Samples Size from Population Database


Step 2 - Approaches for Defining Global Market Size (Value, Volume* & Price*)

Note*: In applicable scenarios
Step 3 - Data Sources
Primary Research
- Web Analytics
- Survey Reports
- Research Institute
- Latest Research Reports
- Opinion Leaders
Secondary Research
- Annual Reports
- White Paper
- Latest Press Release
- Industry Association
- Paid Database
- Investor Presentations

Step 4 - Data Triangulation
Involves using different sources of information in order to increase the validity of a study
These sources are likely to be stakeholders in a program - participants, other researchers, program staff, other community members, and so on.
Then we put all data in single framework & apply various statistical tools to find out the dynamic on the market.
During the analysis stage, feedback from the stakeholder groups would be compared to determine areas of agreement as well as areas of divergence