

Key Insights
The global cell harvesting market is poised for significant expansion, driven by advancements in biopharmaceutical development and regenerative medicine. The market is projected to grow at a compound annual growth rate (CAGR) of 9.5%, reaching a market size of $2.56 billion by 2025. Increasing demand for cell-based therapies, particularly within biopharmaceutical applications, is a key growth driver. Automation in cell harvesting is gaining prominence over manual processes due to superior efficiency, precision, and scalability, further accelerating market growth. Research into stem cells and the rising incidence of chronic diseases, necessitating novel treatment strategies, also contribute to market expansion. Leading companies are actively investing in research and development to enhance current technologies and introduce innovative solutions, fostering a competitive and innovative market landscape. North America and Europe currently dominate the market due to robust research infrastructure and supportive regulatory environments for biotechnological progress. However, the Asia-Pacific region is expected to experience rapid growth, fueled by increased healthcare spending and expanding research capabilities.
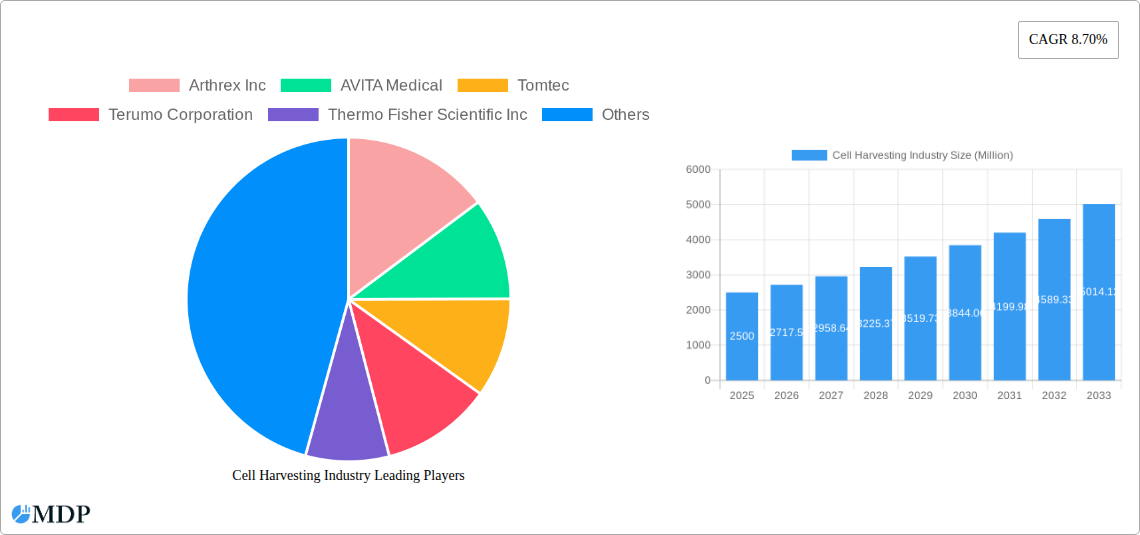
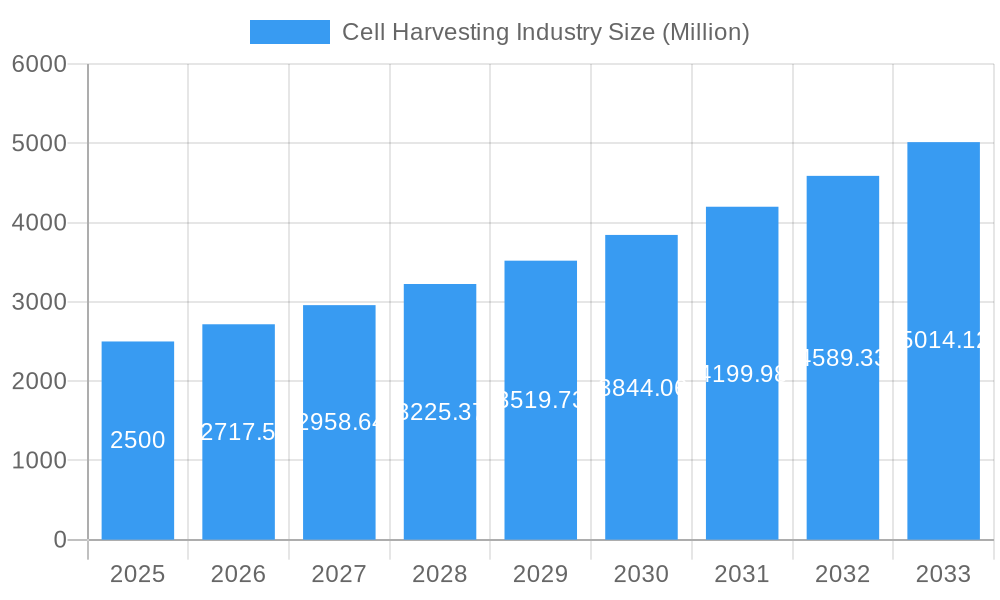
Cell Harvesting Industry Market Size (In Billion)
Challenges to market growth include the substantial initial investment required for automated cell harvesting systems, especially for smaller research institutions and new market entrants. Stringent regulatory requirements for cell therapy approvals and rigorous quality control measures also present obstacles. Despite these challenges, the long-term outlook for the cell harvesting market remains highly promising, with ongoing technological innovations and expanding applications in personalized medicine anticipated to drive considerable growth throughout the forecast period. The market’s segmentation by end-user (biotechnology and biopharmaceutical companies, research institutes, etc.) and application (biopharmaceutical, stem cell research, etc.) presents varied opportunities for stakeholders, with each segment exhibiting distinct growth patterns influenced by specific technological advancements and market demands. Intensifying competition among established players and new entrants is expected to spur further innovation and potentially lead to cost reductions.
Cell Harvesting Industry Company Market Share
Cell Harvesting Industry: A Comprehensive Market Report (2019-2033)
This comprehensive report provides an in-depth analysis of the global cell harvesting industry, offering invaluable insights for stakeholders across the value chain. With a study period spanning 2019-2033, a base year of 2025, and a forecast period of 2025-2033, this report leverages extensive market research to project a xx Million USD market value by 2033, exhibiting a CAGR of xx% during the forecast period. It meticulously examines market dynamics, leading players, technological advancements, and future growth opportunities.
Cell Harvesting Industry Market Dynamics & Concentration
The cell harvesting industry is characterized by a moderately concentrated market, with several key players holding significant market share. The market concentration ratio (CR5) is estimated at xx%, indicating a moderately competitive landscape. Innovation is a key driver, particularly in automated cell harvesting technologies and single-use systems. Stringent regulatory frameworks, particularly concerning GMP (Good Manufacturing Practices) compliance, influence market growth and product development. Substitutes for cell harvesting technologies are limited, with the primary alternative being manual methods, which are less efficient and scalable. End-user trends demonstrate a clear shift towards automation and increased demand from biopharmaceutical companies driven by the growth of cell-based therapies. M&A activity in the industry has been moderate, with approximately xx deals recorded between 2019 and 2024.
- Market Share: Top 5 players hold approximately xx% of the market.
- M&A Activity: An average of xx M&A deals per year were observed during 2019-2024.
- Regulatory Landscape: Stringent GMP regulations drive the adoption of advanced, validated technologies.
- Innovation Drivers: Automation, single-use systems, and miniaturization are key technological advancements.
Cell Harvesting Industry Industry Trends & Analysis
The cell harvesting industry is experiencing significant growth, fueled by the burgeoning biopharmaceutical and regenerative medicine sectors. The market is witnessing a rapid shift towards automated cell harvesting systems, driven by increasing demand for higher throughput, reduced contamination risk, and improved process efficiency. Consumer preference for automation is evident in the growing market share of automated cell harvesters. Technological disruptions, such as the advent of microfluidic devices and 3D-printed harvesting systems, are further reshaping the industry landscape. Competitive dynamics are intensifying with increased investment in R&D and strategic partnerships. The global market is projected to reach xx Million USD by 2033, with a significant market penetration rate of xx% for automated systems by that year.
Leading Markets & Segments in Cell Harvesting Industry
North America currently dominates the cell harvesting market, driven by a robust biopharmaceutical industry, substantial investments in research and development, and favorable regulatory environments. Within the segment analysis, the Biotechnology and Biopharmaceutical Companies segment represents the largest end-user group, contributing to over xx% of total market revenue in 2024. Automated cell harvesters command a larger market share compared to manual systems due to advantages in throughput, efficiency, and scalability. Biopharmaceutical applications are currently the primary driver of market demand, followed by Stem Cell Research.
- Key Drivers for North American Dominance:
- Strong biopharmaceutical industry
- High R&D spending
- Supportive regulatory frameworks
- Advanced infrastructure
- Dominant Segment: Biotechnology and Biopharmaceutical Companies.
- Fastest Growing Segment: Automated Cell Harvesters, driven by efficiency gains and reduced contamination risk.
Cell Harvesting Industry Product Developments
Recent innovations include single-use centrifuge systems (like Thermo Fisher Scientific's DynaSpin) that streamline large-scale cell harvesting and reduce costs associated with traditional methods. 3D-printed microfluidic systems offer a scalable and cost-effective approach for stem cell harvesting. These technological advancements improve efficiency, reduce contamination risks, and enable higher throughput, enhancing the overall market appeal.
Key Drivers of Cell Harvesting Industry Growth
Growth in the cell harvesting industry is largely driven by the increasing demand for cell-based therapies and regenerative medicine products. Technological advancements, such as automation and miniaturization, are further boosting market growth. Favorable regulatory environments in key markets also contribute to industry expansion. For example, the launch of innovative single-use centrifuge systems reduces processing time and costs.
Challenges in the Cell Harvesting Industry Market
The cell harvesting industry faces challenges such as stringent regulatory compliance requirements, which can increase product development costs and timelines. Supply chain disruptions can impact the availability of crucial components and reagents. Intense competition amongst established players and emerging companies also pose challenges. The impact of these challenges on market growth is estimated to be approximately xx% reduction in CAGR by 2033.
Emerging Opportunities in Cell Harvesting Industry
Emerging opportunities include technological breakthroughs such as the development of more efficient and scalable microfluidic devices and the increased adoption of AI and machine learning for process optimization. Strategic partnerships between technology providers and biopharmaceutical companies will drive further growth. Expansion into emerging markets with growing healthcare infrastructure presents significant potential.
Leading Players in the Cell Harvesting Industry Sector
- Arthrex Inc
- AVITA Medical
- Tomtec
- Terumo Corporation
- Thermo Fisher Scientific Inc
- Esco Lifesciences Group
- Eurofins Scientific
- Sartorius AG
- Danaher Corporation
- Cox Scientific Ltd
- Alcami Corporation
- Perkin Elmer Inc
Key Milestones in Cell Harvesting Industry Industry
- October 2022: Thermo Fisher Scientific launched the DynaSpin Single-Use Centrifuge system, significantly improving large-scale cell culture harvesting efficiency.
- June 2022: Researchers developed a 3D-printed microfluidic stem cell harvester, offering a scalable and cost-effective method for stem cell processing.
Strategic Outlook for Cell Harvesting Industry Market
The cell harvesting industry is poised for continued growth, driven by advancements in automation, single-use technologies, and microfluidics. Strategic partnerships and expansion into emerging markets will further accelerate market expansion. The development of novel cell harvesting techniques for emerging therapeutic areas will also contribute to long-term growth. The market shows strong potential for sustained expansion, with opportunities for both established players and new entrants.
Cell Harvesting Industry Segmentation
-
1. Type of Cell Harvesting
- 1.1. Manual Cell Harvesters
- 1.2. Automated Cell Harvesters
-
2. Application
- 2.1. Biopharmaceutical Application
- 2.2. Stem Cell Research
- 2.3. Other Applications
-
3. End User
- 3.1. Biotechnology and Biopharmaceutical Companies
- 3.2. Research Institutes
- 3.3. Other End Users
Cell Harvesting Industry Segmentation By Geography
-
1. North America
- 1.1. United States
- 1.2. Canada
- 1.3. Mexico
-
2. Europe
- 2.1. Germany
- 2.2. United Kingdom
- 2.3. France
- 2.4. Italy
- 2.5. Spain
- 2.6. Rest of Europe
-
3. Asia Pacific
- 3.1. China
- 3.2. Japan
- 3.3. India
- 3.4. Australia
- 3.5. South Korea
- 3.6. Rest of Asia Pacific
-
4. Middle East and Africa
- 4.1. GCC
- 4.2. South Africa
- 4.3. Rest of Middle East and Africa
-
5. South America
- 5.1. Brazil
- 5.2. Argentina
- 5.3. Rest of South America
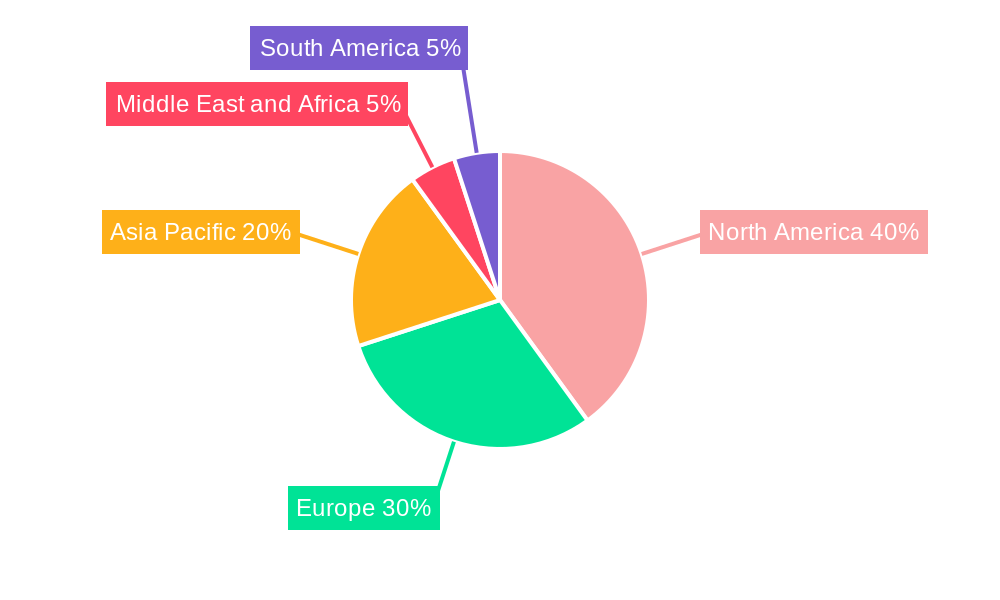
Cell Harvesting Industry Regional Market Share
Geographic Coverage of Cell Harvesting Industry
Cell Harvesting Industry REPORT HIGHLIGHTS
| Aspects | Details |
|---|---|
| Study Period | 2020-2034 |
| Base Year | 2025 |
| Estimated Year | 2026 |
| Forecast Period | 2026-2034 |
| Historical Period | 2020-2025 |
| Growth Rate | CAGR of 9.5% from 2020-2034 |
| Segmentation |
|
Table of Contents
- 1. Introduction
- 1.1. Research Scope
- 1.2. Market Segmentation
- 1.3. Research Objective
- 1.4. Definitions and Assumptions
- 2. Executive Summary
- 2.1. Market Snapshot
- 3. Market Dynamics
- 3.1. Market Drivers
- 3.2. Market Restrains
- 3.3. Market Trends
- 3.4. Market Opportunities
- 4. Market Factor Analysis
- 4.1. Porters Five Forces
- 4.1.1. Bargaining Power of Suppliers
- 4.1.2. Bargaining Power of Buyers
- 4.1.3. Threat of New Entrants
- 4.1.4. Threat of Substitutes
- 4.1.5. Competitive Rivalry
- 4.2. PESTEL analysis
- 4.3. BCG Analysis
- 4.3.1. Stars (High Growth, High Market Share)
- 4.3.2. Cash Cows (Low Growth, High Market Share)
- 4.3.3. Question Mark (High Growth, Low Market Share)
- 4.3.4. Dogs (Low Growth, Low Market Share)
- 4.4. Ansoff Matrix Analysis
- 4.5. Supply Chain Analysis
- 4.6. Regulatory Landscape
- 4.7. Current Market Potential and Opportunity Assessment (TAM–SAM–SOM Framework)
- 4.8. MDP Analyst Note
- 4.1. Porters Five Forces
- 5. Market Analysis, Insights and Forecast 2021-2033
- 5.1. Market Analysis, Insights and Forecast - by Type of Cell Harvesting
- 5.1.1. Manual Cell Harvesters
- 5.1.2. Automated Cell Harvesters
- 5.2. Market Analysis, Insights and Forecast - by Application
- 5.2.1. Biopharmaceutical Application
- 5.2.2. Stem Cell Research
- 5.2.3. Other Applications
- 5.3. Market Analysis, Insights and Forecast - by End User
- 5.3.1. Biotechnology and Biopharmaceutical Companies
- 5.3.2. Research Institutes
- 5.3.3. Other End Users
- 5.4. Market Analysis, Insights and Forecast - by Region
- 5.4.1. North America
- 5.4.2. Europe
- 5.4.3. Asia Pacific
- 5.4.4. Middle East and Africa
- 5.4.5. South America
- 5.1. Market Analysis, Insights and Forecast - by Type of Cell Harvesting
- 6. Global Cell Harvesting Industry Analysis, Insights and Forecast, 2021-2033
- 6.1. Market Analysis, Insights and Forecast - by Type of Cell Harvesting
- 6.1.1. Manual Cell Harvesters
- 6.1.2. Automated Cell Harvesters
- 6.2. Market Analysis, Insights and Forecast - by Application
- 6.2.1. Biopharmaceutical Application
- 6.2.2. Stem Cell Research
- 6.2.3. Other Applications
- 6.3. Market Analysis, Insights and Forecast - by End User
- 6.3.1. Biotechnology and Biopharmaceutical Companies
- 6.3.2. Research Institutes
- 6.3.3. Other End Users
- 6.1. Market Analysis, Insights and Forecast - by Type of Cell Harvesting
- 7. North America Cell Harvesting Industry Analysis, Insights and Forecast, 2020-2032
- 7.1. Market Analysis, Insights and Forecast - by Type of Cell Harvesting
- 7.1.1. Manual Cell Harvesters
- 7.1.2. Automated Cell Harvesters
- 7.2. Market Analysis, Insights and Forecast - by Application
- 7.2.1. Biopharmaceutical Application
- 7.2.2. Stem Cell Research
- 7.2.3. Other Applications
- 7.3. Market Analysis, Insights and Forecast - by End User
- 7.3.1. Biotechnology and Biopharmaceutical Companies
- 7.3.2. Research Institutes
- 7.3.3. Other End Users
- 7.1. Market Analysis, Insights and Forecast - by Type of Cell Harvesting
- 8. Europe Cell Harvesting Industry Analysis, Insights and Forecast, 2020-2032
- 8.1. Market Analysis, Insights and Forecast - by Type of Cell Harvesting
- 8.1.1. Manual Cell Harvesters
- 8.1.2. Automated Cell Harvesters
- 8.2. Market Analysis, Insights and Forecast - by Application
- 8.2.1. Biopharmaceutical Application
- 8.2.2. Stem Cell Research
- 8.2.3. Other Applications
- 8.3. Market Analysis, Insights and Forecast - by End User
- 8.3.1. Biotechnology and Biopharmaceutical Companies
- 8.3.2. Research Institutes
- 8.3.3. Other End Users
- 8.1. Market Analysis, Insights and Forecast - by Type of Cell Harvesting
- 9. Asia Pacific Cell Harvesting Industry Analysis, Insights and Forecast, 2020-2032
- 9.1. Market Analysis, Insights and Forecast - by Type of Cell Harvesting
- 9.1.1. Manual Cell Harvesters
- 9.1.2. Automated Cell Harvesters
- 9.2. Market Analysis, Insights and Forecast - by Application
- 9.2.1. Biopharmaceutical Application
- 9.2.2. Stem Cell Research
- 9.2.3. Other Applications
- 9.3. Market Analysis, Insights and Forecast - by End User
- 9.3.1. Biotechnology and Biopharmaceutical Companies
- 9.3.2. Research Institutes
- 9.3.3. Other End Users
- 9.1. Market Analysis, Insights and Forecast - by Type of Cell Harvesting
- 10. Middle East and Africa Cell Harvesting Industry Analysis, Insights and Forecast, 2020-2032
- 10.1. Market Analysis, Insights and Forecast - by Type of Cell Harvesting
- 10.1.1. Manual Cell Harvesters
- 10.1.2. Automated Cell Harvesters
- 10.2. Market Analysis, Insights and Forecast - by Application
- 10.2.1. Biopharmaceutical Application
- 10.2.2. Stem Cell Research
- 10.2.3. Other Applications
- 10.3. Market Analysis, Insights and Forecast - by End User
- 10.3.1. Biotechnology and Biopharmaceutical Companies
- 10.3.2. Research Institutes
- 10.3.3. Other End Users
- 10.1. Market Analysis, Insights and Forecast - by Type of Cell Harvesting
- 11. South America Cell Harvesting Industry Analysis, Insights and Forecast, 2020-2032
- 11.1. Market Analysis, Insights and Forecast - by Type of Cell Harvesting
- 11.1.1. Manual Cell Harvesters
- 11.1.2. Automated Cell Harvesters
- 11.2. Market Analysis, Insights and Forecast - by Application
- 11.2.1. Biopharmaceutical Application
- 11.2.2. Stem Cell Research
- 11.2.3. Other Applications
- 11.3. Market Analysis, Insights and Forecast - by End User
- 11.3.1. Biotechnology and Biopharmaceutical Companies
- 11.3.2. Research Institutes
- 11.3.3. Other End Users
- 11.1. Market Analysis, Insights and Forecast - by Type of Cell Harvesting
- 12. Competitive Analysis
- 12.1. Company Profiles
- 12.1.1 Arthrex Inc
- 12.1.1.1. Company Overview
- 12.1.1.2. Products
- 12.1.1.3. Company Financials
- 12.1.1.4. SWOT Analysis
- 12.1.2 AVITA Medical
- 12.1.2.1. Company Overview
- 12.1.2.2. Products
- 12.1.2.3. Company Financials
- 12.1.2.4. SWOT Analysis
- 12.1.3 Tomtec
- 12.1.3.1. Company Overview
- 12.1.3.2. Products
- 12.1.3.3. Company Financials
- 12.1.3.4. SWOT Analysis
- 12.1.4 Terumo Corporation
- 12.1.4.1. Company Overview
- 12.1.4.2. Products
- 12.1.4.3. Company Financials
- 12.1.4.4. SWOT Analysis
- 12.1.5 Thermo Fisher Scientific Inc
- 12.1.5.1. Company Overview
- 12.1.5.2. Products
- 12.1.5.3. Company Financials
- 12.1.5.4. SWOT Analysis
- 12.1.6 Esco Lifesciences Group
- 12.1.6.1. Company Overview
- 12.1.6.2. Products
- 12.1.6.3. Company Financials
- 12.1.6.4. SWOT Analysis
- 12.1.7 Eurofins Scientific
- 12.1.7.1. Company Overview
- 12.1.7.2. Products
- 12.1.7.3. Company Financials
- 12.1.7.4. SWOT Analysis
- 12.1.8 Sartorius AG
- 12.1.8.1. Company Overview
- 12.1.8.2. Products
- 12.1.8.3. Company Financials
- 12.1.8.4. SWOT Analysis
- 12.1.9 Danaher Corporation
- 12.1.9.1. Company Overview
- 12.1.9.2. Products
- 12.1.9.3. Company Financials
- 12.1.9.4. SWOT Analysis
- 12.1.10 Cox Scientific Ltd
- 12.1.10.1. Company Overview
- 12.1.10.2. Products
- 12.1.10.3. Company Financials
- 12.1.10.4. SWOT Analysis
- 12.1.11 Alcami Corporation
- 12.1.11.1. Company Overview
- 12.1.11.2. Products
- 12.1.11.3. Company Financials
- 12.1.11.4. SWOT Analysis
- 12.1.12 Perkin Elmer Inc
- 12.1.12.1. Company Overview
- 12.1.12.2. Products
- 12.1.12.3. Company Financials
- 12.1.12.4. SWOT Analysis
- 12.1.1 Arthrex Inc
- 12.2. Market Entropy
- 12.2.1 Company's Key Areas Served
- 12.2.2 Recent Developments
- 12.3. Company Market Share Analysis 2025
- 12.3.1 Top 5 Companies Market Share Analysis
- 12.3.2 Top 3 Companies Market Share Analysis
- 12.4. List of Potential Customers
- 13. Research Methodology
List of Figures
- Figure 1: Global Cell Harvesting Industry Revenue Breakdown (billion, %) by Region 2025 & 2033
- Figure 2: Global Cell Harvesting Industry Volume Breakdown (K Unit, %) by Region 2025 & 2033
- Figure 3: North America Cell Harvesting Industry Revenue (billion), by Type of Cell Harvesting 2025 & 2033
- Figure 4: North America Cell Harvesting Industry Volume (K Unit), by Type of Cell Harvesting 2025 & 2033
- Figure 5: North America Cell Harvesting Industry Revenue Share (%), by Type of Cell Harvesting 2025 & 2033
- Figure 6: North America Cell Harvesting Industry Volume Share (%), by Type of Cell Harvesting 2025 & 2033
- Figure 7: North America Cell Harvesting Industry Revenue (billion), by Application 2025 & 2033
- Figure 8: North America Cell Harvesting Industry Volume (K Unit), by Application 2025 & 2033
- Figure 9: North America Cell Harvesting Industry Revenue Share (%), by Application 2025 & 2033
- Figure 10: North America Cell Harvesting Industry Volume Share (%), by Application 2025 & 2033
- Figure 11: North America Cell Harvesting Industry Revenue (billion), by End User 2025 & 2033
- Figure 12: North America Cell Harvesting Industry Volume (K Unit), by End User 2025 & 2033
- Figure 13: North America Cell Harvesting Industry Revenue Share (%), by End User 2025 & 2033
- Figure 14: North America Cell Harvesting Industry Volume Share (%), by End User 2025 & 2033
- Figure 15: North America Cell Harvesting Industry Revenue (billion), by Country 2025 & 2033
- Figure 16: North America Cell Harvesting Industry Volume (K Unit), by Country 2025 & 2033
- Figure 17: North America Cell Harvesting Industry Revenue Share (%), by Country 2025 & 2033
- Figure 18: North America Cell Harvesting Industry Volume Share (%), by Country 2025 & 2033
- Figure 19: Europe Cell Harvesting Industry Revenue (billion), by Type of Cell Harvesting 2025 & 2033
- Figure 20: Europe Cell Harvesting Industry Volume (K Unit), by Type of Cell Harvesting 2025 & 2033
- Figure 21: Europe Cell Harvesting Industry Revenue Share (%), by Type of Cell Harvesting 2025 & 2033
- Figure 22: Europe Cell Harvesting Industry Volume Share (%), by Type of Cell Harvesting 2025 & 2033
- Figure 23: Europe Cell Harvesting Industry Revenue (billion), by Application 2025 & 2033
- Figure 24: Europe Cell Harvesting Industry Volume (K Unit), by Application 2025 & 2033
- Figure 25: Europe Cell Harvesting Industry Revenue Share (%), by Application 2025 & 2033
- Figure 26: Europe Cell Harvesting Industry Volume Share (%), by Application 2025 & 2033
- Figure 27: Europe Cell Harvesting Industry Revenue (billion), by End User 2025 & 2033
- Figure 28: Europe Cell Harvesting Industry Volume (K Unit), by End User 2025 & 2033
- Figure 29: Europe Cell Harvesting Industry Revenue Share (%), by End User 2025 & 2033
- Figure 30: Europe Cell Harvesting Industry Volume Share (%), by End User 2025 & 2033
- Figure 31: Europe Cell Harvesting Industry Revenue (billion), by Country 2025 & 2033
- Figure 32: Europe Cell Harvesting Industry Volume (K Unit), by Country 2025 & 2033
- Figure 33: Europe Cell Harvesting Industry Revenue Share (%), by Country 2025 & 2033
- Figure 34: Europe Cell Harvesting Industry Volume Share (%), by Country 2025 & 2033
- Figure 35: Asia Pacific Cell Harvesting Industry Revenue (billion), by Type of Cell Harvesting 2025 & 2033
- Figure 36: Asia Pacific Cell Harvesting Industry Volume (K Unit), by Type of Cell Harvesting 2025 & 2033
- Figure 37: Asia Pacific Cell Harvesting Industry Revenue Share (%), by Type of Cell Harvesting 2025 & 2033
- Figure 38: Asia Pacific Cell Harvesting Industry Volume Share (%), by Type of Cell Harvesting 2025 & 2033
- Figure 39: Asia Pacific Cell Harvesting Industry Revenue (billion), by Application 2025 & 2033
- Figure 40: Asia Pacific Cell Harvesting Industry Volume (K Unit), by Application 2025 & 2033
- Figure 41: Asia Pacific Cell Harvesting Industry Revenue Share (%), by Application 2025 & 2033
- Figure 42: Asia Pacific Cell Harvesting Industry Volume Share (%), by Application 2025 & 2033
- Figure 43: Asia Pacific Cell Harvesting Industry Revenue (billion), by End User 2025 & 2033
- Figure 44: Asia Pacific Cell Harvesting Industry Volume (K Unit), by End User 2025 & 2033
- Figure 45: Asia Pacific Cell Harvesting Industry Revenue Share (%), by End User 2025 & 2033
- Figure 46: Asia Pacific Cell Harvesting Industry Volume Share (%), by End User 2025 & 2033
- Figure 47: Asia Pacific Cell Harvesting Industry Revenue (billion), by Country 2025 & 2033
- Figure 48: Asia Pacific Cell Harvesting Industry Volume (K Unit), by Country 2025 & 2033
- Figure 49: Asia Pacific Cell Harvesting Industry Revenue Share (%), by Country 2025 & 2033
- Figure 50: Asia Pacific Cell Harvesting Industry Volume Share (%), by Country 2025 & 2033
- Figure 51: Middle East and Africa Cell Harvesting Industry Revenue (billion), by Type of Cell Harvesting 2025 & 2033
- Figure 52: Middle East and Africa Cell Harvesting Industry Volume (K Unit), by Type of Cell Harvesting 2025 & 2033
- Figure 53: Middle East and Africa Cell Harvesting Industry Revenue Share (%), by Type of Cell Harvesting 2025 & 2033
- Figure 54: Middle East and Africa Cell Harvesting Industry Volume Share (%), by Type of Cell Harvesting 2025 & 2033
- Figure 55: Middle East and Africa Cell Harvesting Industry Revenue (billion), by Application 2025 & 2033
- Figure 56: Middle East and Africa Cell Harvesting Industry Volume (K Unit), by Application 2025 & 2033
- Figure 57: Middle East and Africa Cell Harvesting Industry Revenue Share (%), by Application 2025 & 2033
- Figure 58: Middle East and Africa Cell Harvesting Industry Volume Share (%), by Application 2025 & 2033
- Figure 59: Middle East and Africa Cell Harvesting Industry Revenue (billion), by End User 2025 & 2033
- Figure 60: Middle East and Africa Cell Harvesting Industry Volume (K Unit), by End User 2025 & 2033
- Figure 61: Middle East and Africa Cell Harvesting Industry Revenue Share (%), by End User 2025 & 2033
- Figure 62: Middle East and Africa Cell Harvesting Industry Volume Share (%), by End User 2025 & 2033
- Figure 63: Middle East and Africa Cell Harvesting Industry Revenue (billion), by Country 2025 & 2033
- Figure 64: Middle East and Africa Cell Harvesting Industry Volume (K Unit), by Country 2025 & 2033
- Figure 65: Middle East and Africa Cell Harvesting Industry Revenue Share (%), by Country 2025 & 2033
- Figure 66: Middle East and Africa Cell Harvesting Industry Volume Share (%), by Country 2025 & 2033
- Figure 67: South America Cell Harvesting Industry Revenue (billion), by Type of Cell Harvesting 2025 & 2033
- Figure 68: South America Cell Harvesting Industry Volume (K Unit), by Type of Cell Harvesting 2025 & 2033
- Figure 69: South America Cell Harvesting Industry Revenue Share (%), by Type of Cell Harvesting 2025 & 2033
- Figure 70: South America Cell Harvesting Industry Volume Share (%), by Type of Cell Harvesting 2025 & 2033
- Figure 71: South America Cell Harvesting Industry Revenue (billion), by Application 2025 & 2033
- Figure 72: South America Cell Harvesting Industry Volume (K Unit), by Application 2025 & 2033
- Figure 73: South America Cell Harvesting Industry Revenue Share (%), by Application 2025 & 2033
- Figure 74: South America Cell Harvesting Industry Volume Share (%), by Application 2025 & 2033
- Figure 75: South America Cell Harvesting Industry Revenue (billion), by End User 2025 & 2033
- Figure 76: South America Cell Harvesting Industry Volume (K Unit), by End User 2025 & 2033
- Figure 77: South America Cell Harvesting Industry Revenue Share (%), by End User 2025 & 2033
- Figure 78: South America Cell Harvesting Industry Volume Share (%), by End User 2025 & 2033
- Figure 79: South America Cell Harvesting Industry Revenue (billion), by Country 2025 & 2033
- Figure 80: South America Cell Harvesting Industry Volume (K Unit), by Country 2025 & 2033
- Figure 81: South America Cell Harvesting Industry Revenue Share (%), by Country 2025 & 2033
- Figure 82: South America Cell Harvesting Industry Volume Share (%), by Country 2025 & 2033
List of Tables
- Table 1: Global Cell Harvesting Industry Revenue billion Forecast, by Type of Cell Harvesting 2020 & 2033
- Table 2: Global Cell Harvesting Industry Volume K Unit Forecast, by Type of Cell Harvesting 2020 & 2033
- Table 3: Global Cell Harvesting Industry Revenue billion Forecast, by Application 2020 & 2033
- Table 4: Global Cell Harvesting Industry Volume K Unit Forecast, by Application 2020 & 2033
- Table 5: Global Cell Harvesting Industry Revenue billion Forecast, by End User 2020 & 2033
- Table 6: Global Cell Harvesting Industry Volume K Unit Forecast, by End User 2020 & 2033
- Table 7: Global Cell Harvesting Industry Revenue billion Forecast, by Region 2020 & 2033
- Table 8: Global Cell Harvesting Industry Volume K Unit Forecast, by Region 2020 & 2033
- Table 9: Global Cell Harvesting Industry Revenue billion Forecast, by Type of Cell Harvesting 2020 & 2033
- Table 10: Global Cell Harvesting Industry Volume K Unit Forecast, by Type of Cell Harvesting 2020 & 2033
- Table 11: Global Cell Harvesting Industry Revenue billion Forecast, by Application 2020 & 2033
- Table 12: Global Cell Harvesting Industry Volume K Unit Forecast, by Application 2020 & 2033
- Table 13: Global Cell Harvesting Industry Revenue billion Forecast, by End User 2020 & 2033
- Table 14: Global Cell Harvesting Industry Volume K Unit Forecast, by End User 2020 & 2033
- Table 15: Global Cell Harvesting Industry Revenue billion Forecast, by Country 2020 & 2033
- Table 16: Global Cell Harvesting Industry Volume K Unit Forecast, by Country 2020 & 2033
- Table 17: United States Cell Harvesting Industry Revenue (billion) Forecast, by Application 2020 & 2033
- Table 18: United States Cell Harvesting Industry Volume (K Unit) Forecast, by Application 2020 & 2033
- Table 19: Canada Cell Harvesting Industry Revenue (billion) Forecast, by Application 2020 & 2033
- Table 20: Canada Cell Harvesting Industry Volume (K Unit) Forecast, by Application 2020 & 2033
- Table 21: Mexico Cell Harvesting Industry Revenue (billion) Forecast, by Application 2020 & 2033
- Table 22: Mexico Cell Harvesting Industry Volume (K Unit) Forecast, by Application 2020 & 2033
- Table 23: Global Cell Harvesting Industry Revenue billion Forecast, by Type of Cell Harvesting 2020 & 2033
- Table 24: Global Cell Harvesting Industry Volume K Unit Forecast, by Type of Cell Harvesting 2020 & 2033
- Table 25: Global Cell Harvesting Industry Revenue billion Forecast, by Application 2020 & 2033
- Table 26: Global Cell Harvesting Industry Volume K Unit Forecast, by Application 2020 & 2033
- Table 27: Global Cell Harvesting Industry Revenue billion Forecast, by End User 2020 & 2033
- Table 28: Global Cell Harvesting Industry Volume K Unit Forecast, by End User 2020 & 2033
- Table 29: Global Cell Harvesting Industry Revenue billion Forecast, by Country 2020 & 2033
- Table 30: Global Cell Harvesting Industry Volume K Unit Forecast, by Country 2020 & 2033
- Table 31: Germany Cell Harvesting Industry Revenue (billion) Forecast, by Application 2020 & 2033
- Table 32: Germany Cell Harvesting Industry Volume (K Unit) Forecast, by Application 2020 & 2033
- Table 33: United Kingdom Cell Harvesting Industry Revenue (billion) Forecast, by Application 2020 & 2033
- Table 34: United Kingdom Cell Harvesting Industry Volume (K Unit) Forecast, by Application 2020 & 2033
- Table 35: France Cell Harvesting Industry Revenue (billion) Forecast, by Application 2020 & 2033
- Table 36: France Cell Harvesting Industry Volume (K Unit) Forecast, by Application 2020 & 2033
- Table 37: Italy Cell Harvesting Industry Revenue (billion) Forecast, by Application 2020 & 2033
- Table 38: Italy Cell Harvesting Industry Volume (K Unit) Forecast, by Application 2020 & 2033
- Table 39: Spain Cell Harvesting Industry Revenue (billion) Forecast, by Application 2020 & 2033
- Table 40: Spain Cell Harvesting Industry Volume (K Unit) Forecast, by Application 2020 & 2033
- Table 41: Rest of Europe Cell Harvesting Industry Revenue (billion) Forecast, by Application 2020 & 2033
- Table 42: Rest of Europe Cell Harvesting Industry Volume (K Unit) Forecast, by Application 2020 & 2033
- Table 43: Global Cell Harvesting Industry Revenue billion Forecast, by Type of Cell Harvesting 2020 & 2033
- Table 44: Global Cell Harvesting Industry Volume K Unit Forecast, by Type of Cell Harvesting 2020 & 2033
- Table 45: Global Cell Harvesting Industry Revenue billion Forecast, by Application 2020 & 2033
- Table 46: Global Cell Harvesting Industry Volume K Unit Forecast, by Application 2020 & 2033
- Table 47: Global Cell Harvesting Industry Revenue billion Forecast, by End User 2020 & 2033
- Table 48: Global Cell Harvesting Industry Volume K Unit Forecast, by End User 2020 & 2033
- Table 49: Global Cell Harvesting Industry Revenue billion Forecast, by Country 2020 & 2033
- Table 50: Global Cell Harvesting Industry Volume K Unit Forecast, by Country 2020 & 2033
- Table 51: China Cell Harvesting Industry Revenue (billion) Forecast, by Application 2020 & 2033
- Table 52: China Cell Harvesting Industry Volume (K Unit) Forecast, by Application 2020 & 2033
- Table 53: Japan Cell Harvesting Industry Revenue (billion) Forecast, by Application 2020 & 2033
- Table 54: Japan Cell Harvesting Industry Volume (K Unit) Forecast, by Application 2020 & 2033
- Table 55: India Cell Harvesting Industry Revenue (billion) Forecast, by Application 2020 & 2033
- Table 56: India Cell Harvesting Industry Volume (K Unit) Forecast, by Application 2020 & 2033
- Table 57: Australia Cell Harvesting Industry Revenue (billion) Forecast, by Application 2020 & 2033
- Table 58: Australia Cell Harvesting Industry Volume (K Unit) Forecast, by Application 2020 & 2033
- Table 59: South Korea Cell Harvesting Industry Revenue (billion) Forecast, by Application 2020 & 2033
- Table 60: South Korea Cell Harvesting Industry Volume (K Unit) Forecast, by Application 2020 & 2033
- Table 61: Rest of Asia Pacific Cell Harvesting Industry Revenue (billion) Forecast, by Application 2020 & 2033
- Table 62: Rest of Asia Pacific Cell Harvesting Industry Volume (K Unit) Forecast, by Application 2020 & 2033
- Table 63: Global Cell Harvesting Industry Revenue billion Forecast, by Type of Cell Harvesting 2020 & 2033
- Table 64: Global Cell Harvesting Industry Volume K Unit Forecast, by Type of Cell Harvesting 2020 & 2033
- Table 65: Global Cell Harvesting Industry Revenue billion Forecast, by Application 2020 & 2033
- Table 66: Global Cell Harvesting Industry Volume K Unit Forecast, by Application 2020 & 2033
- Table 67: Global Cell Harvesting Industry Revenue billion Forecast, by End User 2020 & 2033
- Table 68: Global Cell Harvesting Industry Volume K Unit Forecast, by End User 2020 & 2033
- Table 69: Global Cell Harvesting Industry Revenue billion Forecast, by Country 2020 & 2033
- Table 70: Global Cell Harvesting Industry Volume K Unit Forecast, by Country 2020 & 2033
- Table 71: GCC Cell Harvesting Industry Revenue (billion) Forecast, by Application 2020 & 2033
- Table 72: GCC Cell Harvesting Industry Volume (K Unit) Forecast, by Application 2020 & 2033
- Table 73: South Africa Cell Harvesting Industry Revenue (billion) Forecast, by Application 2020 & 2033
- Table 74: South Africa Cell Harvesting Industry Volume (K Unit) Forecast, by Application 2020 & 2033
- Table 75: Rest of Middle East and Africa Cell Harvesting Industry Revenue (billion) Forecast, by Application 2020 & 2033
- Table 76: Rest of Middle East and Africa Cell Harvesting Industry Volume (K Unit) Forecast, by Application 2020 & 2033
- Table 77: Global Cell Harvesting Industry Revenue billion Forecast, by Type of Cell Harvesting 2020 & 2033
- Table 78: Global Cell Harvesting Industry Volume K Unit Forecast, by Type of Cell Harvesting 2020 & 2033
- Table 79: Global Cell Harvesting Industry Revenue billion Forecast, by Application 2020 & 2033
- Table 80: Global Cell Harvesting Industry Volume K Unit Forecast, by Application 2020 & 2033
- Table 81: Global Cell Harvesting Industry Revenue billion Forecast, by End User 2020 & 2033
- Table 82: Global Cell Harvesting Industry Volume K Unit Forecast, by End User 2020 & 2033
- Table 83: Global Cell Harvesting Industry Revenue billion Forecast, by Country 2020 & 2033
- Table 84: Global Cell Harvesting Industry Volume K Unit Forecast, by Country 2020 & 2033
- Table 85: Brazil Cell Harvesting Industry Revenue (billion) Forecast, by Application 2020 & 2033
- Table 86: Brazil Cell Harvesting Industry Volume (K Unit) Forecast, by Application 2020 & 2033
- Table 87: Argentina Cell Harvesting Industry Revenue (billion) Forecast, by Application 2020 & 2033
- Table 88: Argentina Cell Harvesting Industry Volume (K Unit) Forecast, by Application 2020 & 2033
- Table 89: Rest of South America Cell Harvesting Industry Revenue (billion) Forecast, by Application 2020 & 2033
- Table 90: Rest of South America Cell Harvesting Industry Volume (K Unit) Forecast, by Application 2020 & 2033
Frequently Asked Questions
1. What is the projected Compound Annual Growth Rate (CAGR) of the Cell Harvesting Industry?
The projected CAGR is approximately 9.5%.
2. Which companies are prominent players in the Cell Harvesting Industry?
Key companies in the market include Arthrex Inc, AVITA Medical, Tomtec, Terumo Corporation, Thermo Fisher Scientific Inc, Esco Lifesciences Group, Eurofins Scientific, Sartorius AG, Danaher Corporation, Cox Scientific Ltd, Alcami Corporation, Perkin Elmer Inc.
3. What are the main segments of the Cell Harvesting Industry?
The market segments include Type of Cell Harvesting, Application, End User.
4. Can you provide details about the market size?
The market size is estimated to be USD 2.56 billion as of 2022.
5. What are some drivers contributing to market growth?
Rising Investments in Regenerative Medicine and Cell-based Research; Growth of the Biotechnology and Biopharmaceutical Industries; Increasing Incidence of Chronic and Infectious Diseases.
6. What are the notable trends driving market growth?
Stem Cell Research Segment Expects to Register a Significant CAGR Over the Forecast Period.
7. Are there any restraints impacting market growth?
Ethical Issues pertaining to Embryonic Stem Cell Research.
8. Can you provide examples of recent developments in the market?
October 2022: Thermo Fisher Scientific launched the DynaSpin Single-Use Centrifuge system, a centrifuge designed to provide an optimal single-use solution for large-scale cell culture harvesting. The system improves and streamlines the process by reducing the number of depth filtration cartridges required to complete the harvest process.
9. What pricing options are available for accessing the report?
Pricing options include single-user, multi-user, and enterprise licenses priced at USD 4750, USD 5250, and USD 8750 respectively.
10. Is the market size provided in terms of value or volume?
The market size is provided in terms of value, measured in billion and volume, measured in K Unit.
11. Are there any specific market keywords associated with the report?
Yes, the market keyword associated with the report is "Cell Harvesting Industry," which aids in identifying and referencing the specific market segment covered.
12. How do I determine which pricing option suits my needs best?
The pricing options vary based on user requirements and access needs. Individual users may opt for single-user licenses, while businesses requiring broader access may choose multi-user or enterprise licenses for cost-effective access to the report.
13. Are there any additional resources or data provided in the Cell Harvesting Industry report?
While the report offers comprehensive insights, it's advisable to review the specific contents or supplementary materials provided to ascertain if additional resources or data are available.
14. How can I stay updated on further developments or reports in the Cell Harvesting Industry?
To stay informed about further developments, trends, and reports in the Cell Harvesting Industry, consider subscribing to industry newsletters, following relevant companies and organizations, or regularly checking reputable industry news sources and publications.
Methodology
Step 1 - Identification of Relevant Samples Size from Population Database


Step 2 - Approaches for Defining Global Market Size (Value, Volume* & Price*)

Note*: In applicable scenarios
Step 3 - Data Sources
Primary Research
- Web Analytics
- Survey Reports
- Research Institute
- Latest Research Reports
- Opinion Leaders
Secondary Research
- Annual Reports
- White Paper
- Latest Press Release
- Industry Association
- Paid Database
- Investor Presentations

Step 4 - Data Triangulation
Involves using different sources of information in order to increase the validity of a study
These sources are likely to be stakeholders in a program - participants, other researchers, program staff, other community members, and so on.
Then we put all data in single framework & apply various statistical tools to find out the dynamic on the market.
During the analysis stage, feedback from the stakeholder groups would be compared to determine areas of agreement as well as areas of divergence