

Key Insights
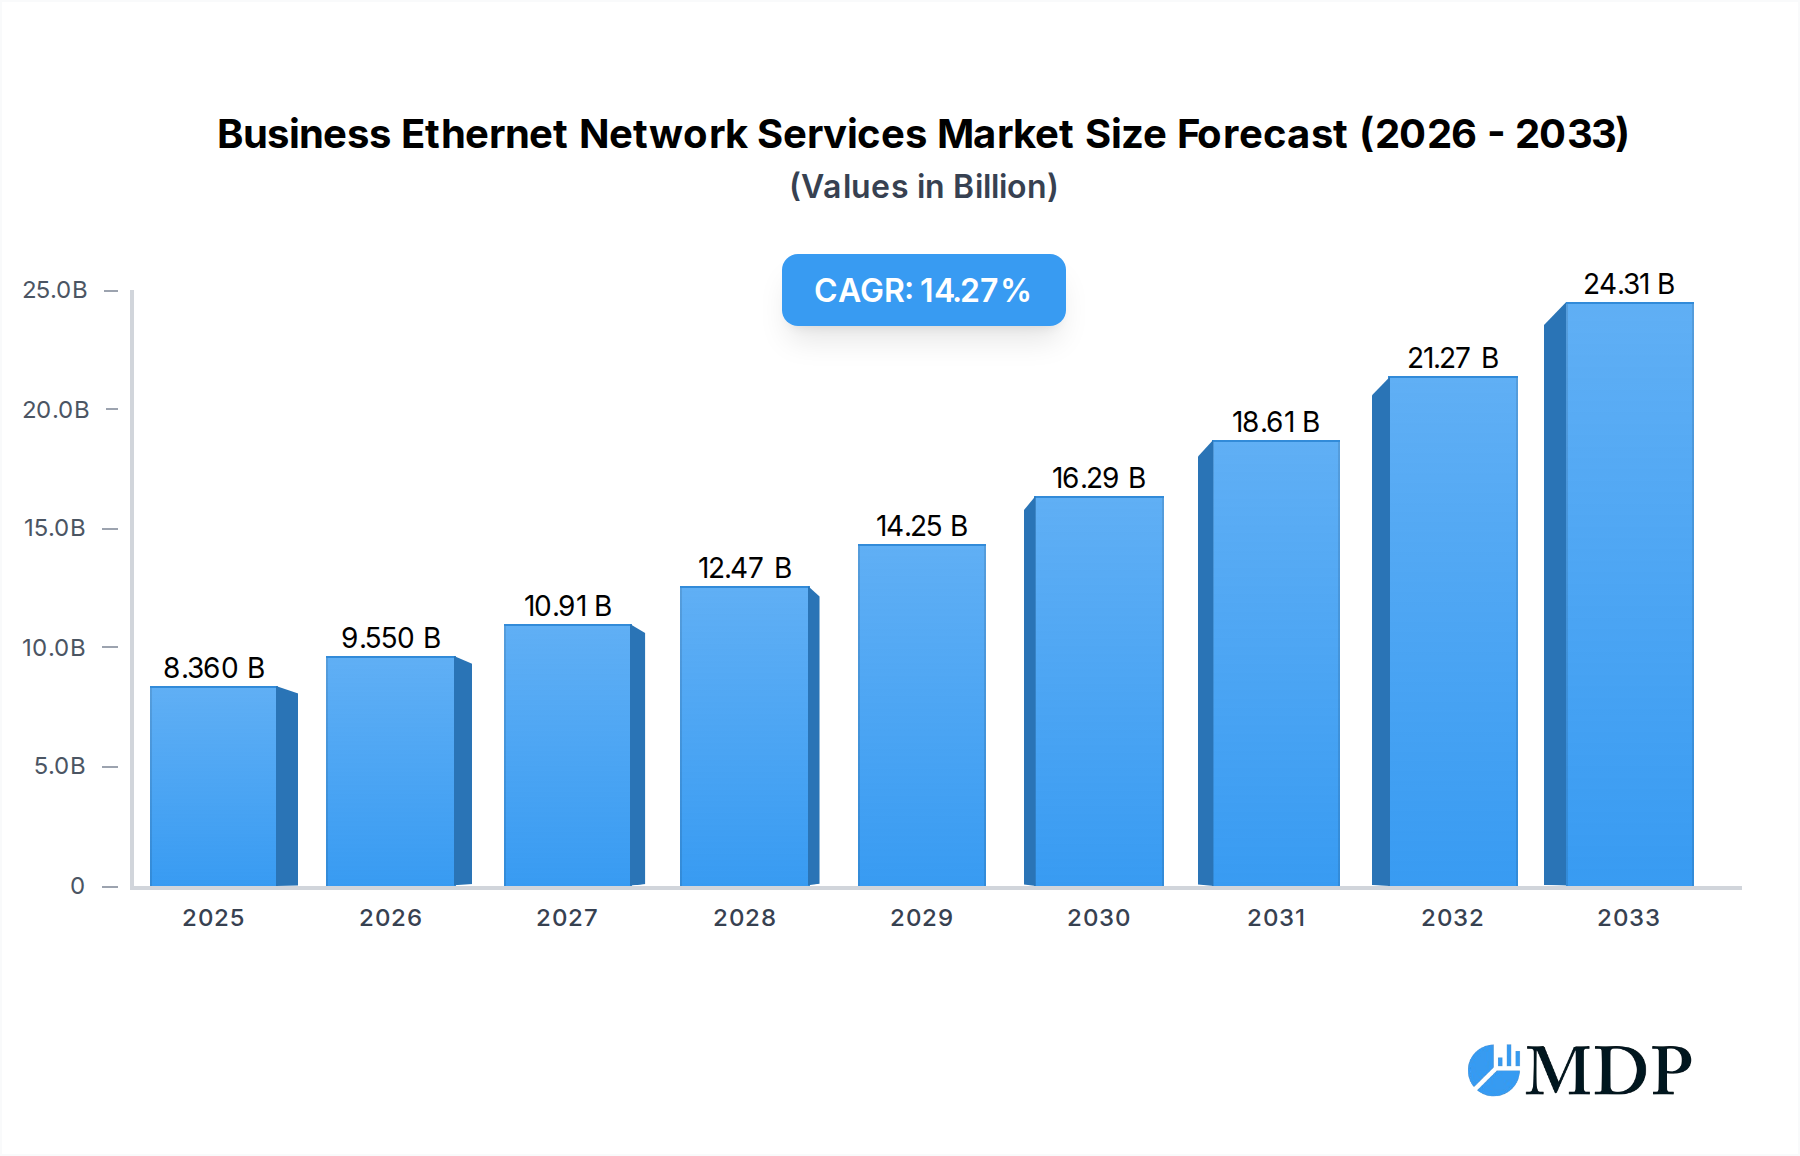
The global Business Ethernet Network Services market is poised for substantial growth, with an estimated market size of $8.36 billion in 2025 and projected to expand at a robust Compound Annual Growth Rate (CAGR) of 14.25% through 2033. This accelerated expansion is primarily driven by the escalating demand for high-speed, reliable, and scalable network infrastructure across diverse industries. The increasing adoption of cloud computing, the proliferation of IoT devices, and the growing need for seamless data transmission for real-time applications in sectors like BFSI, retail, and IT and telecom are key factors fueling this market surge. Businesses are increasingly relying on Ethernet services for their critical operations, including efficient data center interconnectivity, enhanced collaboration tools, and secure point-to-point connectivity, underscoring the indispensable role of these services in modern business operations. The continuous evolution of network technologies, such as the deployment of higher bandwidth Ethernet services and Software-Defined Networking (SDN) integrated solutions, further contributes to market dynamism and adoption.

Business Ethernet Network Services Market Size (In Billion)
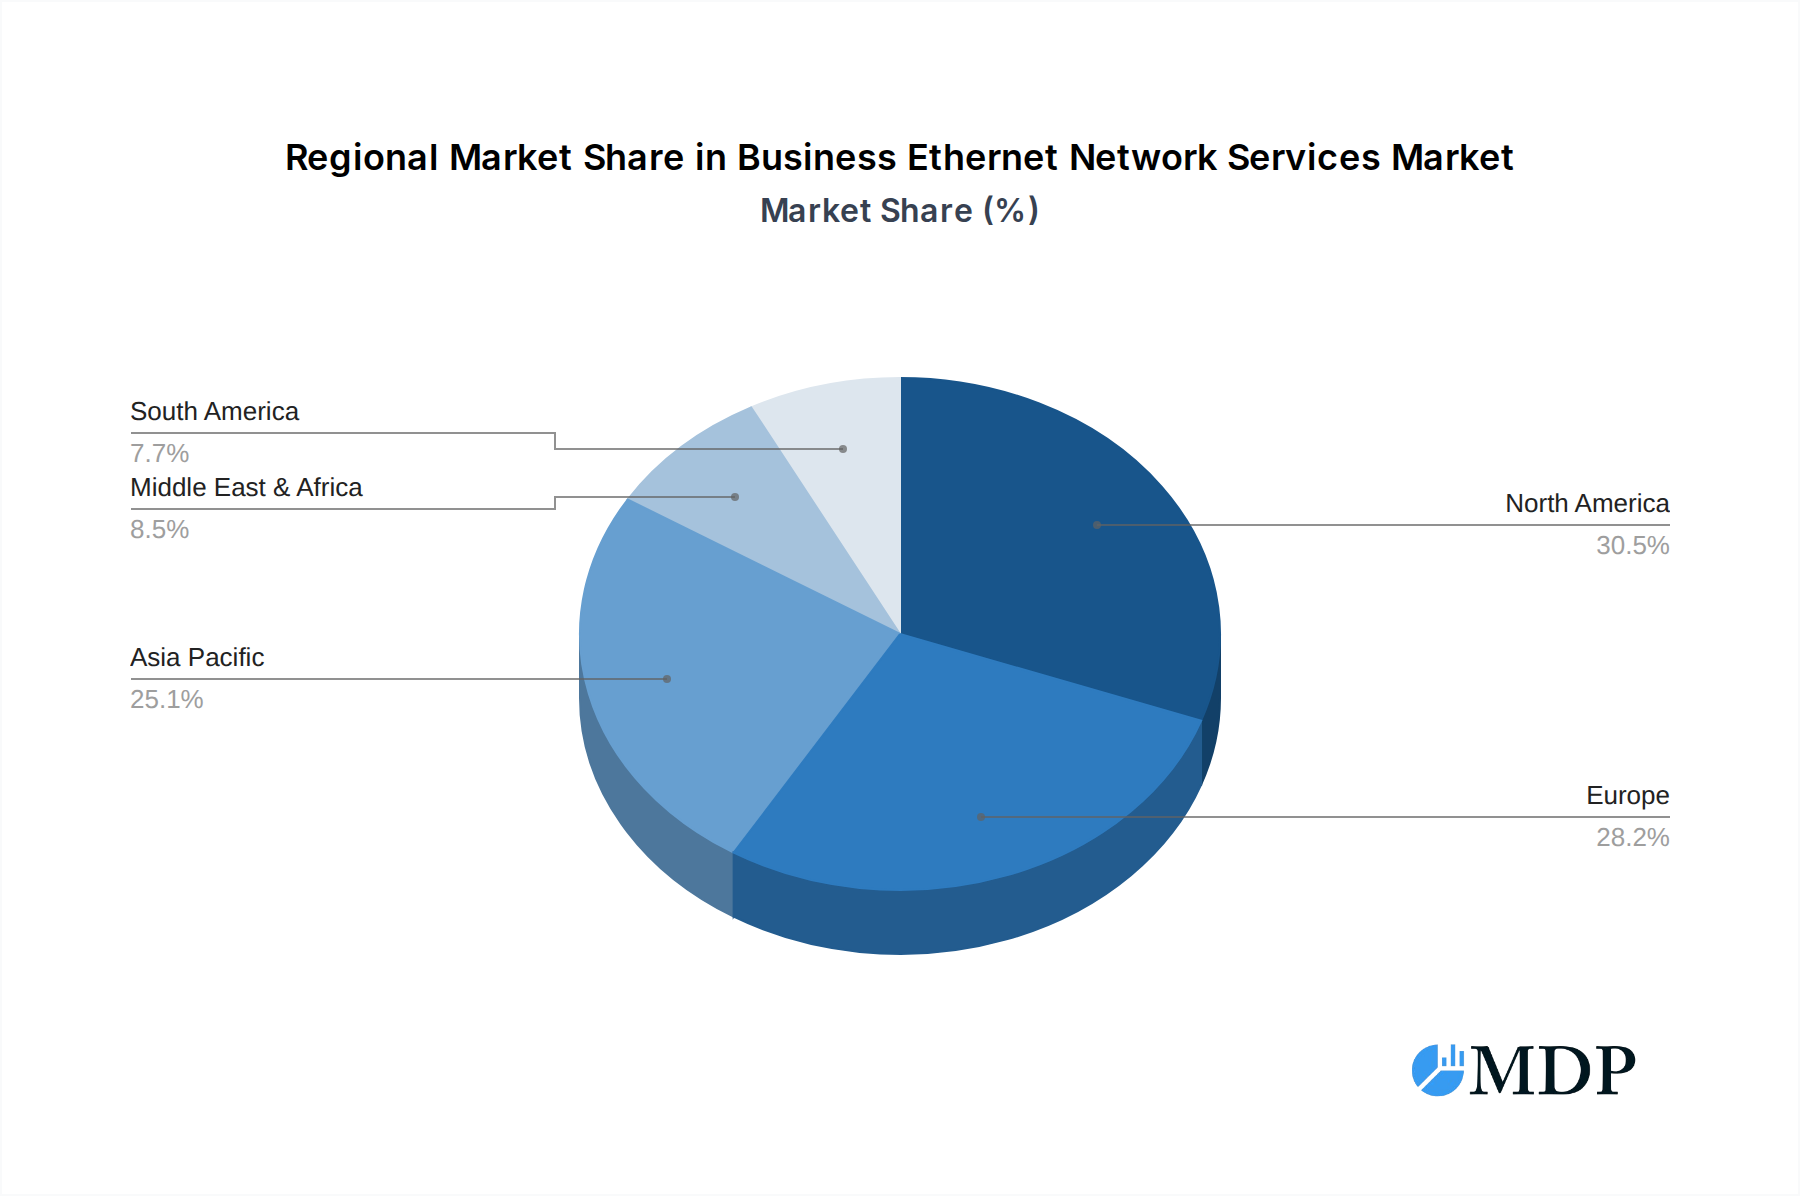
Emerging trends like the integration of AI for network management, the growing preference for managed Ethernet services, and the expanding reach of fiber optic networks are shaping the competitive landscape. While the market offers immense opportunities, certain restraints, such as the high cost of infrastructure deployment in certain regions and the need for skilled professionals to manage complex networks, need to be addressed. North America and Europe currently lead the market, driven by advanced technological adoption and robust enterprise spending, while the Asia Pacific region is anticipated to witness the fastest growth due to its burgeoning economies and rapid digital transformation initiatives. The market is characterized by intense competition among major global and regional telecommunications providers, who are continually innovating to offer comprehensive Ethernet solutions catering to the evolving needs of businesses worldwide.
Business Ethernet Network Services Company Market Share
Business Ethernet Network Services Market Analysis: Size, Trends, and Forecast 2019–2033
This comprehensive report delves into the dynamic landscape of Business Ethernet Network Services, providing an in-depth analysis of market size, growth drivers, technological advancements, and future projections. With a study period spanning from 2019 to 2033, this report offers invaluable insights for industry stakeholders seeking to understand the evolution and opportunities within this critical sector. Our analysis covers a base year of 2025, with estimated projections for the same year, and a detailed forecast period from 2025 to 2033, building upon historical data from 2019 to 2024. We examine the market through various lenses, including company strategies, technological trends, regional dominance, and emerging opportunities.
Business Ethernet Network Services Market Dynamics & Concentration
The Business Ethernet Network Services market exhibits a moderately concentrated structure, driven by the significant capital investment required for robust infrastructure deployment and the need for specialized technical expertise. Innovation in this sector is primarily fueled by the continuous demand for higher bandwidth, lower latency, and enhanced security to support evolving business applications, from cloud computing and big data analytics to the Internet of Things (IoT). Regulatory frameworks, while crucial for ensuring service quality and data privacy, can also present compliance challenges for service providers. Product substitutes, such as MPLS and SD-WAN, are increasingly integrated or offered alongside Ethernet solutions, creating a complex competitive environment. End-user trends are heavily influenced by the digital transformation across industries, pushing for scalable, reliable, and cost-effective network solutions. Mergers and acquisitions (M&A) activities are a significant factor in market concentration, with larger players acquiring smaller, specialized providers to expand their geographical reach and service portfolios. For instance, a projected 2.5 billion USD in M&A deals is anticipated between 2025 and 2033, consolidating market share and accelerating innovation. The market share of the top 5 players is estimated to be 75 billion USD in 2025.
Business Ethernet Network Services Industry Trends & Analysis
The Business Ethernet Network Services industry is experiencing robust growth, propelled by the insatiable demand for high-speed, reliable connectivity essential for modern business operations. The Compound Annual Growth Rate (CAGR) is projected to be a strong 11.2% during the forecast period of 2025–2033, indicating sustained expansion. This growth is largely attributed to the accelerating digital transformation initiatives across all sectors, with businesses increasingly relying on cloud-based applications, data-intensive services, and real-time communication platforms. Technological disruptions are a constant theme, with the ongoing evolution of fiber optics, advancements in network virtualization, and the integration of AI for network management and optimization playing pivotal roles. These innovations enable service providers to offer more sophisticated and agile solutions, meeting the stringent performance requirements of enterprises. Consumer preferences are shifting towards highly scalable and customizable network services that can adapt to fluctuating bandwidth demands and specific application needs. The competitive dynamics within the industry are characterized by intense rivalry among established telecommunication giants and emerging technology providers, all vying for market share through innovation, service differentiation, and strategic partnerships. Market penetration is expected to reach 85% by 2030, driven by the increasing adoption of digital technologies across small and medium-sized enterprises (SMEs) in developing economies. The global market size for Business Ethernet Network Services is projected to reach 250 billion USD by 2033.
Leading Markets & Segments in Business Ethernet Network Services
The Business Ethernet Network Services market is segmented by application and type, with significant variations in growth and adoption rates across different industries and network architectures.
Dominant Regions and Countries: North America, particularly the United States, continues to lead the Business Ethernet Network Services market due to its advanced technological infrastructure, high adoption rates of cloud services, and a strong presence of BFSI and IT and Telecom sectors. Europe follows closely, with countries like Germany, the UK, and France showing substantial investments in network upgrades to support their digital economies. Asia-Pacific is the fastest-growing region, fueled by increasing digitalization in countries like China, India, and Japan, and a burgeoning manufacturing and retail sector.
Application Segments Dominance:
- BFSI (Banking, Financial Services, and Insurance): This segment consistently represents a significant portion of the market due to its critical need for high-speed, secure, and reliable connectivity for transactions, data processing, and fraud detection. The volume of financial transactions processed globally is expected to reach 100 trillion USD by 2025, driving demand for robust Ethernet solutions.
- IT and Telecom: This sector is both a major consumer and provider of Business Ethernet Network Services, requiring extensive connectivity for data centers, cloud infrastructure, and telecommunication networks. The growth of 5G deployment alone is a significant catalyst.
- Manufacturing: The adoption of Industry 4.0 technologies, including IoT devices, automated production lines, and real-time data analytics, is driving substantial demand for high-performance Ethernet. Smart factory initiatives are projected to involve over 30 billion connected devices by 2027.
- Retail and Ecommerce: The exponential growth of online retail necessitates reliable and scalable networks for order processing, inventory management, and customer service. The global ecommerce market is projected to exceed 7 trillion USD by 2025.
Type Segments Dominance:
- Ethernet WAN (Wide Area Network): This segment holds a larger market share due to its application in connecting geographically dispersed business locations, enabling seamless data transfer and communication across enterprises. The increasing complexity of global supply chains and remote workforces amplifies its importance.
- Ethernet LAN (Local Area Network): While crucial for in-premise connectivity, Ethernet LANs are often integrated into broader WAN solutions. The demand for faster internal network speeds within organizations continues to fuel this segment, with internal network traffic projected to grow by 25% year-over-year.
Business Ethernet Network Services Product Developments
Product innovation in Business Ethernet Network Services is characterized by a focus on enhanced performance, security, and manageability. Key developments include the introduction of higher bandwidth capacities, such as 400 Gbps and 800 Gbps Ethernet, to cater to data-intensive applications. Advancements in network function virtualization (NFV) and software-defined networking (SDN) are enabling more agile and programmable network solutions. Furthermore, service providers are integrating advanced security features, including end-to-end encryption and threat detection, to address growing cybersecurity concerns. The competitive advantage lies in offering integrated solutions that combine high-speed connectivity with robust security and intelligent network management capabilities.
Key Drivers of Business Ethernet Network Services Growth
The growth of the Business Ethernet Network Services market is propelled by several interconnected factors. Technologically, the ongoing expansion of cloud computing, big data analytics, and the Internet of Things (IoT) necessitates higher bandwidth and lower latency, which Ethernet provides. Economically, the increasing digital transformation across industries, including BFSI, manufacturing, and retail, drives demand for reliable connectivity. Regulatory advancements that promote broadband deployment and data security also indirectly support market expansion. Furthermore, the increasing trend towards remote and hybrid work models requires robust and secure network infrastructure to connect distributed workforces.
Challenges in the Business Ethernet Network Services Market
Despite its growth trajectory, the Business Ethernet Network Services market faces several challenges. High infrastructure deployment costs, especially in rural or underserved areas, can be a significant barrier. Intense competition among established players and new entrants leads to pricing pressures and reduced profit margins. Evolving cybersecurity threats require continuous investment in advanced security measures, adding to operational expenses. Furthermore, the complexity of network management and the need for skilled IT professionals to operate and maintain these sophisticated networks can pose operational challenges for some businesses. Supply chain disruptions for network hardware can also impact deployment timelines.
Emerging Opportunities in Business Ethernet Network Services
Emerging opportunities in the Business Ethernet Network Services market are centered around the evolving needs of businesses embracing advanced technologies. The increasing adoption of AI and machine learning for network optimization and predictive maintenance presents a significant opportunity for service providers to offer value-added services. Strategic partnerships between telecom companies and cloud providers are creating integrated solutions that offer seamless connectivity and enhanced capabilities. The expansion of 5G networks is also creating new avenues for business Ethernet, particularly for enterprise applications requiring high bandwidth and ultra-low latency. Furthermore, the growing demand for edge computing solutions, which require localized high-speed connectivity, opens up new market segments.
Leading Players in the Business Ethernet Network Services Sector
- NTT
- Verizon
- AT&T
- Tata Communications
- Orange
- BT
- Vodafone
- Lumen
- Masergy (Comcast)
- Telefónica
- Colt Technology
- GTT
- Telia Company
- Deutsche Telekom
- Telstra
- Singtel
- PCCW Global
- RIEDEL Networks
- China Telecom
- China Unicom
- China Mobile
- KDDI
- PLDT
- DIL Technology
- Ooredoo
- Swisscom
Key Milestones in Business Ethernet Network Services Industry
- 2019: Standardization of 400 Gigabit Ethernet (400GbE) specifications, enabling significantly higher bandwidth for data-intensive applications.
- 2020: Increased adoption of Software-Defined Wide Area Networking (SD-WAN) integrated with Ethernet services to enhance network agility and cost-effectiveness.
- 2021: Significant investments in fiber optic infrastructure expansion by major providers to meet growing demand for high-speed connectivity.
- 2022: Growing emphasis on network security features, including end-to-end encryption and advanced threat detection, within Ethernet service offerings.
- 2023: Rise of edge computing initiatives, necessitating the development of localized, high-performance Ethernet connectivity solutions.
- 2024: Increased integration of AI and machine learning for network management, automation, and performance optimization in Ethernet services.
Strategic Outlook for Business Ethernet Network Services Market
The strategic outlook for the Business Ethernet Network Services market is exceptionally positive, driven by the indispensable role of high-speed, reliable connectivity in the modern digital economy. Future growth will be accelerated by the continued expansion of cloud services, the proliferation of IoT devices, and the ongoing digital transformation initiatives across all industry verticals. Strategic opportunities lie in offering integrated solutions that combine advanced Ethernet capabilities with cybersecurity, AI-driven network management, and edge computing support. Partnerships with cloud providers and technology innovators will be crucial for service providers to deliver comprehensive and future-proof network solutions, ensuring sustained market expansion and increased customer value. The projected market size for Business Ethernet Network Services is expected to reach 250 billion USD by 2033.
Business Ethernet Network Services Segmentation
-
1. Application
- 1.1. BFSI
- 1.2. Retail and Ecommerce
- 1.3. IT and Telecom
- 1.4. Manufacturing
- 1.5. Government
- 1.6. Education
- 1.7. Healthcare
- 1.8. Media and Entertainment
- 1.9. Others
-
2. Types
- 2.1. Ethernet LAN
- 2.2. Ethernet WAN
Business Ethernet Network Services Segmentation By Geography
-
1. North America
- 1.1. United States
- 1.2. Canada
- 1.3. Mexico
-
2. South America
- 2.1. Brazil
- 2.2. Argentina
- 2.3. Rest of South America
-
3. Europe
- 3.1. United Kingdom
- 3.2. Germany
- 3.3. France
- 3.4. Italy
- 3.5. Spain
- 3.6. Russia
- 3.7. Benelux
- 3.8. Nordics
- 3.9. Rest of Europe
-
4. Middle East & Africa
- 4.1. Turkey
- 4.2. Israel
- 4.3. GCC
- 4.4. North Africa
- 4.5. South Africa
- 4.6. Rest of Middle East & Africa
-
5. Asia Pacific
- 5.1. China
- 5.2. India
- 5.3. Japan
- 5.4. South Korea
- 5.5. ASEAN
- 5.6. Oceania
- 5.7. Rest of Asia Pacific
Business Ethernet Network Services Regional Market Share
Geographic Coverage of Business Ethernet Network Services
Business Ethernet Network Services REPORT HIGHLIGHTS
| Aspects | Details |
|---|---|
| Study Period | 2020-2034 |
| Base Year | 2025 |
| Estimated Year | 2026 |
| Forecast Period | 2026-2034 |
| Historical Period | 2020-2025 |
| Growth Rate | CAGR of 14.25% from 2020-2034 |
| Segmentation |
|
Table of Contents
- 1. Introduction
- 1.1. Research Scope
- 1.2. Market Segmentation
- 1.3. Research Methodology
- 1.4. Definitions and Assumptions
- 2. Executive Summary
- 2.1. Introduction
- 3. Market Dynamics
- 3.1. Introduction
- 3.2. Market Drivers
- 3.3. Market Restrains
- 3.4. Market Trends
- 4. Market Factor Analysis
- 4.1. Porters Five Forces
- 4.2. Supply/Value Chain
- 4.3. PESTEL analysis
- 4.4. Market Entropy
- 4.5. Patent/Trademark Analysis
- 5. Global Business Ethernet Network Services Analysis, Insights and Forecast, 2020-2032
- 5.1. Market Analysis, Insights and Forecast - by Application
- 5.1.1. BFSI
- 5.1.2. Retail and Ecommerce
- 5.1.3. IT and Telecom
- 5.1.4. Manufacturing
- 5.1.5. Government
- 5.1.6. Education
- 5.1.7. Healthcare
- 5.1.8. Media and Entertainment
- 5.1.9. Others
- 5.2. Market Analysis, Insights and Forecast - by Types
- 5.2.1. Ethernet LAN
- 5.2.2. Ethernet WAN
- 5.3. Market Analysis, Insights and Forecast - by Region
- 5.3.1. North America
- 5.3.2. South America
- 5.3.3. Europe
- 5.3.4. Middle East & Africa
- 5.3.5. Asia Pacific
- 5.1. Market Analysis, Insights and Forecast - by Application
- 6. North America Business Ethernet Network Services Analysis, Insights and Forecast, 2020-2032
- 6.1. Market Analysis, Insights and Forecast - by Application
- 6.1.1. BFSI
- 6.1.2. Retail and Ecommerce
- 6.1.3. IT and Telecom
- 6.1.4. Manufacturing
- 6.1.5. Government
- 6.1.6. Education
- 6.1.7. Healthcare
- 6.1.8. Media and Entertainment
- 6.1.9. Others
- 6.2. Market Analysis, Insights and Forecast - by Types
- 6.2.1. Ethernet LAN
- 6.2.2. Ethernet WAN
- 6.1. Market Analysis, Insights and Forecast - by Application
- 7. South America Business Ethernet Network Services Analysis, Insights and Forecast, 2020-2032
- 7.1. Market Analysis, Insights and Forecast - by Application
- 7.1.1. BFSI
- 7.1.2. Retail and Ecommerce
- 7.1.3. IT and Telecom
- 7.1.4. Manufacturing
- 7.1.5. Government
- 7.1.6. Education
- 7.1.7. Healthcare
- 7.1.8. Media and Entertainment
- 7.1.9. Others
- 7.2. Market Analysis, Insights and Forecast - by Types
- 7.2.1. Ethernet LAN
- 7.2.2. Ethernet WAN
- 7.1. Market Analysis, Insights and Forecast - by Application
- 8. Europe Business Ethernet Network Services Analysis, Insights and Forecast, 2020-2032
- 8.1. Market Analysis, Insights and Forecast - by Application
- 8.1.1. BFSI
- 8.1.2. Retail and Ecommerce
- 8.1.3. IT and Telecom
- 8.1.4. Manufacturing
- 8.1.5. Government
- 8.1.6. Education
- 8.1.7. Healthcare
- 8.1.8. Media and Entertainment
- 8.1.9. Others
- 8.2. Market Analysis, Insights and Forecast - by Types
- 8.2.1. Ethernet LAN
- 8.2.2. Ethernet WAN
- 8.1. Market Analysis, Insights and Forecast - by Application
- 9. Middle East & Africa Business Ethernet Network Services Analysis, Insights and Forecast, 2020-2032
- 9.1. Market Analysis, Insights and Forecast - by Application
- 9.1.1. BFSI
- 9.1.2. Retail and Ecommerce
- 9.1.3. IT and Telecom
- 9.1.4. Manufacturing
- 9.1.5. Government
- 9.1.6. Education
- 9.1.7. Healthcare
- 9.1.8. Media and Entertainment
- 9.1.9. Others
- 9.2. Market Analysis, Insights and Forecast - by Types
- 9.2.1. Ethernet LAN
- 9.2.2. Ethernet WAN
- 9.1. Market Analysis, Insights and Forecast - by Application
- 10. Asia Pacific Business Ethernet Network Services Analysis, Insights and Forecast, 2020-2032
- 10.1. Market Analysis, Insights and Forecast - by Application
- 10.1.1. BFSI
- 10.1.2. Retail and Ecommerce
- 10.1.3. IT and Telecom
- 10.1.4. Manufacturing
- 10.1.5. Government
- 10.1.6. Education
- 10.1.7. Healthcare
- 10.1.8. Media and Entertainment
- 10.1.9. Others
- 10.2. Market Analysis, Insights and Forecast - by Types
- 10.2.1. Ethernet LAN
- 10.2.2. Ethernet WAN
- 10.1. Market Analysis, Insights and Forecast - by Application
- 11. Competitive Analysis
- 11.1. Global Market Share Analysis 2025
- 11.2. Company Profiles
- 11.2.1 NTT
- 11.2.1.1. Overview
- 11.2.1.2. Products
- 11.2.1.3. SWOT Analysis
- 11.2.1.4. Recent Developments
- 11.2.1.5. Financials (Based on Availability)
- 11.2.2 Verizon
- 11.2.2.1. Overview
- 11.2.2.2. Products
- 11.2.2.3. SWOT Analysis
- 11.2.2.4. Recent Developments
- 11.2.2.5. Financials (Based on Availability)
- 11.2.3 AT&T
- 11.2.3.1. Overview
- 11.2.3.2. Products
- 11.2.3.3. SWOT Analysis
- 11.2.3.4. Recent Developments
- 11.2.3.5. Financials (Based on Availability)
- 11.2.4 Tata Communications
- 11.2.4.1. Overview
- 11.2.4.2. Products
- 11.2.4.3. SWOT Analysis
- 11.2.4.4. Recent Developments
- 11.2.4.5. Financials (Based on Availability)
- 11.2.5 Orange
- 11.2.5.1. Overview
- 11.2.5.2. Products
- 11.2.5.3. SWOT Analysis
- 11.2.5.4. Recent Developments
- 11.2.5.5. Financials (Based on Availability)
- 11.2.6 BT
- 11.2.6.1. Overview
- 11.2.6.2. Products
- 11.2.6.3. SWOT Analysis
- 11.2.6.4. Recent Developments
- 11.2.6.5. Financials (Based on Availability)
- 11.2.7 Vodafone
- 11.2.7.1. Overview
- 11.2.7.2. Products
- 11.2.7.3. SWOT Analysis
- 11.2.7.4. Recent Developments
- 11.2.7.5. Financials (Based on Availability)
- 11.2.8 Lumen
- 11.2.8.1. Overview
- 11.2.8.2. Products
- 11.2.8.3. SWOT Analysis
- 11.2.8.4. Recent Developments
- 11.2.8.5. Financials (Based on Availability)
- 11.2.9 Masergy (Comcast)
- 11.2.9.1. Overview
- 11.2.9.2. Products
- 11.2.9.3. SWOT Analysis
- 11.2.9.4. Recent Developments
- 11.2.9.5. Financials (Based on Availability)
- 11.2.10 Telefónica
- 11.2.10.1. Overview
- 11.2.10.2. Products
- 11.2.10.3. SWOT Analysis
- 11.2.10.4. Recent Developments
- 11.2.10.5. Financials (Based on Availability)
- 11.2.11 Colt Technology
- 11.2.11.1. Overview
- 11.2.11.2. Products
- 11.2.11.3. SWOT Analysis
- 11.2.11.4. Recent Developments
- 11.2.11.5. Financials (Based on Availability)
- 11.2.12 GTT
- 11.2.12.1. Overview
- 11.2.12.2. Products
- 11.2.12.3. SWOT Analysis
- 11.2.12.4. Recent Developments
- 11.2.12.5. Financials (Based on Availability)
- 11.2.13 Telia Company
- 11.2.13.1. Overview
- 11.2.13.2. Products
- 11.2.13.3. SWOT Analysis
- 11.2.13.4. Recent Developments
- 11.2.13.5. Financials (Based on Availability)
- 11.2.14 Deutsche Telekom
- 11.2.14.1. Overview
- 11.2.14.2. Products
- 11.2.14.3. SWOT Analysis
- 11.2.14.4. Recent Developments
- 11.2.14.5. Financials (Based on Availability)
- 11.2.15 Telstra
- 11.2.15.1. Overview
- 11.2.15.2. Products
- 11.2.15.3. SWOT Analysis
- 11.2.15.4. Recent Developments
- 11.2.15.5. Financials (Based on Availability)
- 11.2.16 Singtel
- 11.2.16.1. Overview
- 11.2.16.2. Products
- 11.2.16.3. SWOT Analysis
- 11.2.16.4. Recent Developments
- 11.2.16.5. Financials (Based on Availability)
- 11.2.17 PCCW Global
- 11.2.17.1. Overview
- 11.2.17.2. Products
- 11.2.17.3. SWOT Analysis
- 11.2.17.4. Recent Developments
- 11.2.17.5. Financials (Based on Availability)
- 11.2.18 RIEDEL Networks
- 11.2.18.1. Overview
- 11.2.18.2. Products
- 11.2.18.3. SWOT Analysis
- 11.2.18.4. Recent Developments
- 11.2.18.5. Financials (Based on Availability)
- 11.2.19 China Telecom
- 11.2.19.1. Overview
- 11.2.19.2. Products
- 11.2.19.3. SWOT Analysis
- 11.2.19.4. Recent Developments
- 11.2.19.5. Financials (Based on Availability)
- 11.2.20 China Unicom
- 11.2.20.1. Overview
- 11.2.20.2. Products
- 11.2.20.3. SWOT Analysis
- 11.2.20.4. Recent Developments
- 11.2.20.5. Financials (Based on Availability)
- 11.2.21 China Mobile
- 11.2.21.1. Overview
- 11.2.21.2. Products
- 11.2.21.3. SWOT Analysis
- 11.2.21.4. Recent Developments
- 11.2.21.5. Financials (Based on Availability)
- 11.2.22 KDDI
- 11.2.22.1. Overview
- 11.2.22.2. Products
- 11.2.22.3. SWOT Analysis
- 11.2.22.4. Recent Developments
- 11.2.22.5. Financials (Based on Availability)
- 11.2.23 PLDT
- 11.2.23.1. Overview
- 11.2.23.2. Products
- 11.2.23.3. SWOT Analysis
- 11.2.23.4. Recent Developments
- 11.2.23.5. Financials (Based on Availability)
- 11.2.24 DIL Technology
- 11.2.24.1. Overview
- 11.2.24.2. Products
- 11.2.24.3. SWOT Analysis
- 11.2.24.4. Recent Developments
- 11.2.24.5. Financials (Based on Availability)
- 11.2.25 Ooredoo
- 11.2.25.1. Overview
- 11.2.25.2. Products
- 11.2.25.3. SWOT Analysis
- 11.2.25.4. Recent Developments
- 11.2.25.5. Financials (Based on Availability)
- 11.2.26 Swisscom
- 11.2.26.1. Overview
- 11.2.26.2. Products
- 11.2.26.3. SWOT Analysis
- 11.2.26.4. Recent Developments
- 11.2.26.5. Financials (Based on Availability)
- 11.2.1 NTT
List of Figures
- Figure 1: Global Business Ethernet Network Services Revenue Breakdown (billion, %) by Region 2025 & 2033
- Figure 2: North America Business Ethernet Network Services Revenue (billion), by Application 2025 & 2033
- Figure 3: North America Business Ethernet Network Services Revenue Share (%), by Application 2025 & 2033
- Figure 4: North America Business Ethernet Network Services Revenue (billion), by Types 2025 & 2033
- Figure 5: North America Business Ethernet Network Services Revenue Share (%), by Types 2025 & 2033
- Figure 6: North America Business Ethernet Network Services Revenue (billion), by Country 2025 & 2033
- Figure 7: North America Business Ethernet Network Services Revenue Share (%), by Country 2025 & 2033
- Figure 8: South America Business Ethernet Network Services Revenue (billion), by Application 2025 & 2033
- Figure 9: South America Business Ethernet Network Services Revenue Share (%), by Application 2025 & 2033
- Figure 10: South America Business Ethernet Network Services Revenue (billion), by Types 2025 & 2033
- Figure 11: South America Business Ethernet Network Services Revenue Share (%), by Types 2025 & 2033
- Figure 12: South America Business Ethernet Network Services Revenue (billion), by Country 2025 & 2033
- Figure 13: South America Business Ethernet Network Services Revenue Share (%), by Country 2025 & 2033
- Figure 14: Europe Business Ethernet Network Services Revenue (billion), by Application 2025 & 2033
- Figure 15: Europe Business Ethernet Network Services Revenue Share (%), by Application 2025 & 2033
- Figure 16: Europe Business Ethernet Network Services Revenue (billion), by Types 2025 & 2033
- Figure 17: Europe Business Ethernet Network Services Revenue Share (%), by Types 2025 & 2033
- Figure 18: Europe Business Ethernet Network Services Revenue (billion), by Country 2025 & 2033
- Figure 19: Europe Business Ethernet Network Services Revenue Share (%), by Country 2025 & 2033
- Figure 20: Middle East & Africa Business Ethernet Network Services Revenue (billion), by Application 2025 & 2033
- Figure 21: Middle East & Africa Business Ethernet Network Services Revenue Share (%), by Application 2025 & 2033
- Figure 22: Middle East & Africa Business Ethernet Network Services Revenue (billion), by Types 2025 & 2033
- Figure 23: Middle East & Africa Business Ethernet Network Services Revenue Share (%), by Types 2025 & 2033
- Figure 24: Middle East & Africa Business Ethernet Network Services Revenue (billion), by Country 2025 & 2033
- Figure 25: Middle East & Africa Business Ethernet Network Services Revenue Share (%), by Country 2025 & 2033
- Figure 26: Asia Pacific Business Ethernet Network Services Revenue (billion), by Application 2025 & 2033
- Figure 27: Asia Pacific Business Ethernet Network Services Revenue Share (%), by Application 2025 & 2033
- Figure 28: Asia Pacific Business Ethernet Network Services Revenue (billion), by Types 2025 & 2033
- Figure 29: Asia Pacific Business Ethernet Network Services Revenue Share (%), by Types 2025 & 2033
- Figure 30: Asia Pacific Business Ethernet Network Services Revenue (billion), by Country 2025 & 2033
- Figure 31: Asia Pacific Business Ethernet Network Services Revenue Share (%), by Country 2025 & 2033
List of Tables
- Table 1: Global Business Ethernet Network Services Revenue billion Forecast, by Application 2020 & 2033
- Table 2: Global Business Ethernet Network Services Revenue billion Forecast, by Types 2020 & 2033
- Table 3: Global Business Ethernet Network Services Revenue billion Forecast, by Region 2020 & 2033
- Table 4: Global Business Ethernet Network Services Revenue billion Forecast, by Application 2020 & 2033
- Table 5: Global Business Ethernet Network Services Revenue billion Forecast, by Types 2020 & 2033
- Table 6: Global Business Ethernet Network Services Revenue billion Forecast, by Country 2020 & 2033
- Table 7: United States Business Ethernet Network Services Revenue (billion) Forecast, by Application 2020 & 2033
- Table 8: Canada Business Ethernet Network Services Revenue (billion) Forecast, by Application 2020 & 2033
- Table 9: Mexico Business Ethernet Network Services Revenue (billion) Forecast, by Application 2020 & 2033
- Table 10: Global Business Ethernet Network Services Revenue billion Forecast, by Application 2020 & 2033
- Table 11: Global Business Ethernet Network Services Revenue billion Forecast, by Types 2020 & 2033
- Table 12: Global Business Ethernet Network Services Revenue billion Forecast, by Country 2020 & 2033
- Table 13: Brazil Business Ethernet Network Services Revenue (billion) Forecast, by Application 2020 & 2033
- Table 14: Argentina Business Ethernet Network Services Revenue (billion) Forecast, by Application 2020 & 2033
- Table 15: Rest of South America Business Ethernet Network Services Revenue (billion) Forecast, by Application 2020 & 2033
- Table 16: Global Business Ethernet Network Services Revenue billion Forecast, by Application 2020 & 2033
- Table 17: Global Business Ethernet Network Services Revenue billion Forecast, by Types 2020 & 2033
- Table 18: Global Business Ethernet Network Services Revenue billion Forecast, by Country 2020 & 2033
- Table 19: United Kingdom Business Ethernet Network Services Revenue (billion) Forecast, by Application 2020 & 2033
- Table 20: Germany Business Ethernet Network Services Revenue (billion) Forecast, by Application 2020 & 2033
- Table 21: France Business Ethernet Network Services Revenue (billion) Forecast, by Application 2020 & 2033
- Table 22: Italy Business Ethernet Network Services Revenue (billion) Forecast, by Application 2020 & 2033
- Table 23: Spain Business Ethernet Network Services Revenue (billion) Forecast, by Application 2020 & 2033
- Table 24: Russia Business Ethernet Network Services Revenue (billion) Forecast, by Application 2020 & 2033
- Table 25: Benelux Business Ethernet Network Services Revenue (billion) Forecast, by Application 2020 & 2033
- Table 26: Nordics Business Ethernet Network Services Revenue (billion) Forecast, by Application 2020 & 2033
- Table 27: Rest of Europe Business Ethernet Network Services Revenue (billion) Forecast, by Application 2020 & 2033
- Table 28: Global Business Ethernet Network Services Revenue billion Forecast, by Application 2020 & 2033
- Table 29: Global Business Ethernet Network Services Revenue billion Forecast, by Types 2020 & 2033
- Table 30: Global Business Ethernet Network Services Revenue billion Forecast, by Country 2020 & 2033
- Table 31: Turkey Business Ethernet Network Services Revenue (billion) Forecast, by Application 2020 & 2033
- Table 32: Israel Business Ethernet Network Services Revenue (billion) Forecast, by Application 2020 & 2033
- Table 33: GCC Business Ethernet Network Services Revenue (billion) Forecast, by Application 2020 & 2033
- Table 34: North Africa Business Ethernet Network Services Revenue (billion) Forecast, by Application 2020 & 2033
- Table 35: South Africa Business Ethernet Network Services Revenue (billion) Forecast, by Application 2020 & 2033
- Table 36: Rest of Middle East & Africa Business Ethernet Network Services Revenue (billion) Forecast, by Application 2020 & 2033
- Table 37: Global Business Ethernet Network Services Revenue billion Forecast, by Application 2020 & 2033
- Table 38: Global Business Ethernet Network Services Revenue billion Forecast, by Types 2020 & 2033
- Table 39: Global Business Ethernet Network Services Revenue billion Forecast, by Country 2020 & 2033
- Table 40: China Business Ethernet Network Services Revenue (billion) Forecast, by Application 2020 & 2033
- Table 41: India Business Ethernet Network Services Revenue (billion) Forecast, by Application 2020 & 2033
- Table 42: Japan Business Ethernet Network Services Revenue (billion) Forecast, by Application 2020 & 2033
- Table 43: South Korea Business Ethernet Network Services Revenue (billion) Forecast, by Application 2020 & 2033
- Table 44: ASEAN Business Ethernet Network Services Revenue (billion) Forecast, by Application 2020 & 2033
- Table 45: Oceania Business Ethernet Network Services Revenue (billion) Forecast, by Application 2020 & 2033
- Table 46: Rest of Asia Pacific Business Ethernet Network Services Revenue (billion) Forecast, by Application 2020 & 2033
Frequently Asked Questions
1. What is the projected Compound Annual Growth Rate (CAGR) of the Business Ethernet Network Services?
The projected CAGR is approximately 14.25%.
2. Which companies are prominent players in the Business Ethernet Network Services?
Key companies in the market include NTT, Verizon, AT&T, Tata Communications, Orange, BT, Vodafone, Lumen, Masergy (Comcast), Telefónica, Colt Technology, GTT, Telia Company, Deutsche Telekom, Telstra, Singtel, PCCW Global, RIEDEL Networks, China Telecom, China Unicom, China Mobile, KDDI, PLDT, DIL Technology, Ooredoo, Swisscom.
3. What are the main segments of the Business Ethernet Network Services?
The market segments include Application, Types.
4. Can you provide details about the market size?
The market size is estimated to be USD 8.36 billion as of 2022.
5. What are some drivers contributing to market growth?
N/A
6. What are the notable trends driving market growth?
N/A
7. Are there any restraints impacting market growth?
N/A
8. Can you provide examples of recent developments in the market?
N/A
9. What pricing options are available for accessing the report?
Pricing options include single-user, multi-user, and enterprise licenses priced at USD 3950.00, USD 5925.00, and USD 7900.00 respectively.
10. Is the market size provided in terms of value or volume?
The market size is provided in terms of value, measured in billion.
11. Are there any specific market keywords associated with the report?
Yes, the market keyword associated with the report is "Business Ethernet Network Services," which aids in identifying and referencing the specific market segment covered.
12. How do I determine which pricing option suits my needs best?
The pricing options vary based on user requirements and access needs. Individual users may opt for single-user licenses, while businesses requiring broader access may choose multi-user or enterprise licenses for cost-effective access to the report.
13. Are there any additional resources or data provided in the Business Ethernet Network Services report?
While the report offers comprehensive insights, it's advisable to review the specific contents or supplementary materials provided to ascertain if additional resources or data are available.
14. How can I stay updated on further developments or reports in the Business Ethernet Network Services?
To stay informed about further developments, trends, and reports in the Business Ethernet Network Services, consider subscribing to industry newsletters, following relevant companies and organizations, or regularly checking reputable industry news sources and publications.
Methodology
Step 1 - Identification of Relevant Samples Size from Population Database


Step 2 - Approaches for Defining Global Market Size (Value, Volume* & Price*)

Note*: In applicable scenarios
Step 3 - Data Sources
Primary Research
- Web Analytics
- Survey Reports
- Research Institute
- Latest Research Reports
- Opinion Leaders
Secondary Research
- Annual Reports
- White Paper
- Latest Press Release
- Industry Association
- Paid Database
- Investor Presentations

Step 4 - Data Triangulation
Involves using different sources of information in order to increase the validity of a study
These sources are likely to be stakeholders in a program - participants, other researchers, program staff, other community members, and so on.
Then we put all data in single framework & apply various statistical tools to find out the dynamic on the market.
During the analysis stage, feedback from the stakeholder groups would be compared to determine areas of agreement as well as areas of divergence