

Key Insights
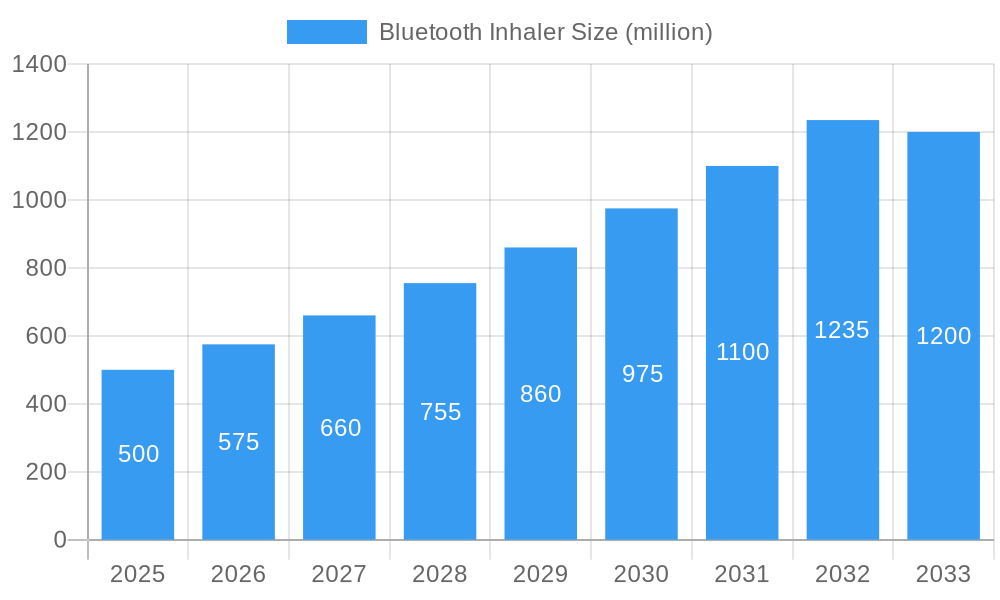
The global Bluetooth inhaler market is poised for significant expansion, driven by the escalating incidence of respiratory conditions, a growing preference for user-friendly and effective drug delivery methods, and continuous innovations in digital health. The market size was valued at 221.98 million in the base year 2025, and is projected to reach USD 1.2 billion by 2033, demonstrating a remarkable Compound Annual Growth Rate (CAGR) of 42.52%. Key growth catalysts include the incorporation of smart functionalities such as medication adherence reminders, dosage monitoring, and real-time data analytics, which collectively enhance patient compliance and therapeutic outcomes. The increasing adoption of telehealth and remote patient monitoring further amplifies the value proposition of Bluetooth inhalers, particularly for individuals managing chronic respiratory diseases. The market is segmented by inhaler type, connectivity features, and end-user settings, including hospitals and home care. Intense competition among established medical device manufacturers and emerging technology providers is fostering rapid technological advancements and driving market consolidation.
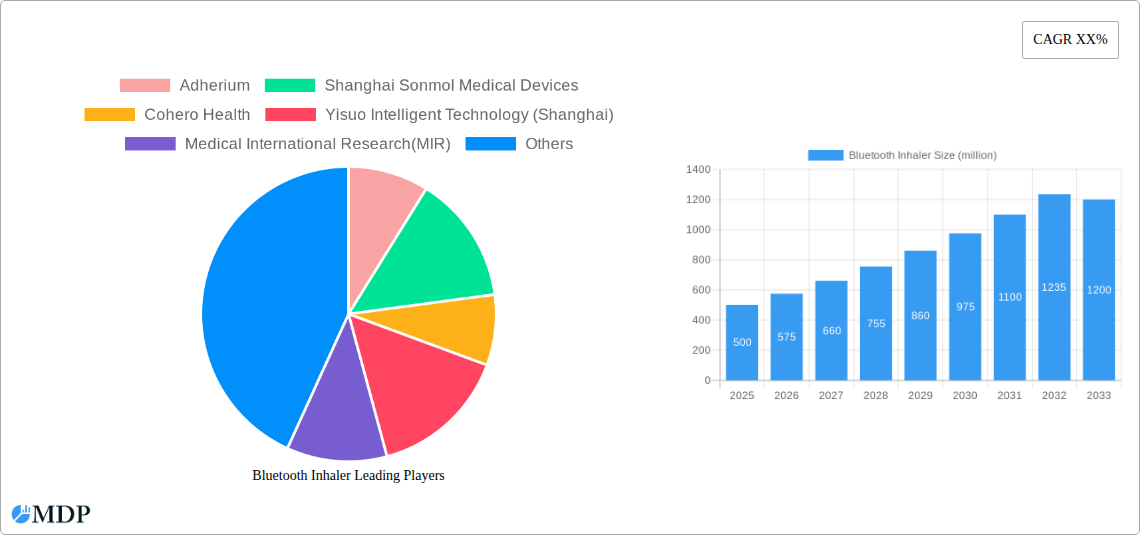
Bluetooth Inhaler Market Size (In Million)
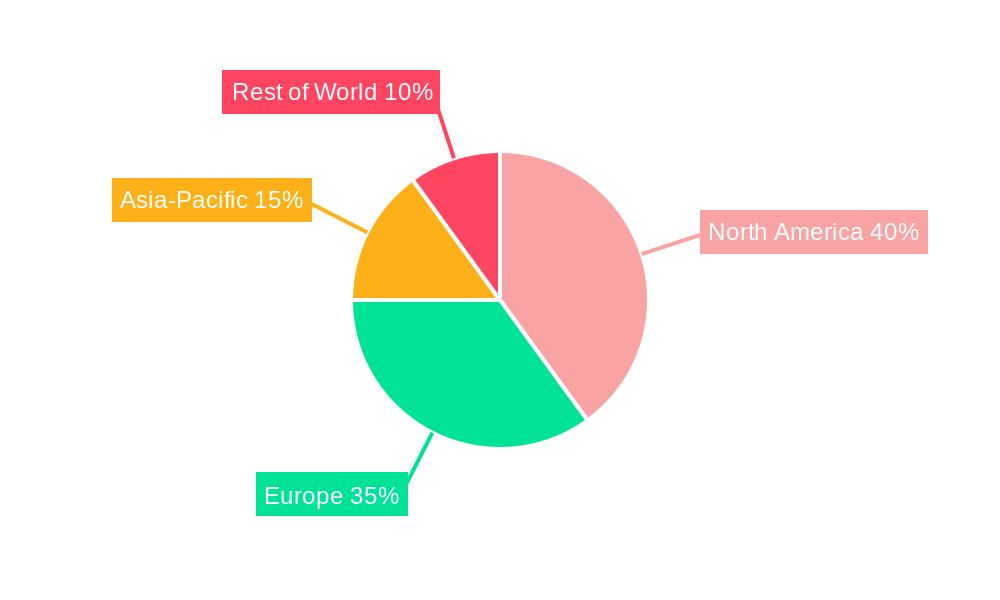
Challenges to market growth include the higher initial investment for Bluetooth inhalers compared to conventional devices, potential data privacy concerns, and the necessity for robust digital health infrastructure. Nevertheless, ongoing technological refinements and the decreasing cost of connected health devices are expected to address these hurdles. North America and Europe currently dominate the market, attributed to substantial healthcare investments and advanced technological adoption. Conversely, the Asia-Pacific region presents considerable growth opportunities, spurred by heightened awareness of respiratory health and rising disposable incomes. Prominent market participants, including Adherium, Shanghai Sonmol Medical Devices, Cohero Health, Yisuo Intelligent Technology, and Medical International Research, are instrumental in driving market innovation and expansion. The industry's trajectory is increasingly focused on personalized medicine delivery and seamless integration within broader healthcare ecosystems, aiming for improved patient health and sustained market development.
Bluetooth Inhaler Company Market Share
Bluetooth Inhaler Market Report: 2019-2033 - A Comprehensive Analysis
Unlocking the Potential of a Multi-Million Dollar Market: This in-depth report provides a comprehensive analysis of the global Bluetooth inhaler market, projecting a value exceeding $xx million by 2033. The study covers market dynamics, leading players, technological advancements, and future growth opportunities, offering actionable insights for stakeholders across the healthcare and technology sectors. Our analysis spans the period 2019-2033, with a focus on the forecast period (2025-2033) and base year (2025).
Bluetooth Inhaler Market Dynamics & Concentration
This section analyzes the market concentration, innovation drivers, regulatory frameworks, product substitutes, end-user trends, and M&A activities within the Bluetooth inhaler market. The global market is moderately concentrated, with a few key players holding significant market share. However, the market is witnessing increased competition due to the entry of new players and technological advancements.
- Market Concentration: The top 5 companies hold an estimated xx% market share in 2025. This concentration is expected to slightly decrease to xx% by 2033 due to increased competition.
- Innovation Drivers: Miniaturization of components, improved sensor technology, and integration with smart health platforms are key drivers of innovation.
- Regulatory Frameworks: Stringent regulatory approvals for medical devices are a key challenge. The speed of approval varies across regions, impacting market entry strategies.
- Product Substitutes: Traditional inhalers remain a significant substitute, but Bluetooth inhalers offer advantages in terms of data monitoring and personalized therapy.
- End-User Trends: Growing awareness of respiratory health, rising prevalence of chronic respiratory diseases, and the increasing adoption of digital health technologies are driving market demand.
- M&A Activities: Over the historical period (2019-2024), an estimated xx M&A deals were recorded in this sector, indicating a consolidated market with a potential for further consolidation.
Bluetooth Inhaler Industry Trends & Analysis
The Bluetooth inhaler market is experiencing robust growth, driven by several key factors. The Compound Annual Growth Rate (CAGR) is projected to be xx% during the forecast period (2025-2033). This growth is fuelled by factors such as increasing prevalence of respiratory diseases (Asthma, COPD), rising adoption of telehealth, and advancements in digital health technologies. Market penetration is estimated to reach xx% by 2033, driven by increasing affordability and consumer awareness. The market is witnessing significant technological disruptions, including the integration of AI and machine learning for personalized treatment recommendations. Consumer preferences are shifting towards connected devices that provide real-time data and remote monitoring capabilities, creating a demand for user-friendly and reliable Bluetooth inhalers. The competitive landscape is dynamic, with both established players and new entrants vying for market share.
Leading Markets & Segments in Bluetooth Inhaler
The North American market currently holds the largest market share due to high healthcare expenditure and strong regulatory frameworks. However, Asia-Pacific is expected to witness the fastest growth rate over the forecast period.
Key Drivers in North America:
- High healthcare expenditure and insurance coverage.
- Strong regulatory framework supporting technological advancements in medical devices.
- High prevalence of chronic respiratory diseases.
Key Drivers in Asia-Pacific:
- Rising disposable incomes.
- Increasing prevalence of respiratory diseases.
- Growing adoption of digital health technologies.
The detailed dominance analysis shows a shift towards personalized medicine, with a focus on tailoring treatments based on individual patient data. This trend is driving the adoption of smart inhalers among healthcare providers and patients.
Bluetooth Inhaler Product Developments
Recent advancements include smaller, more portable designs, improved sensor accuracy, and integration with smartphone apps for data visualization and patient engagement. These innovations improve patient adherence and enable remote monitoring, enhancing the overall effectiveness of respiratory therapy. The market is witnessing a growing emphasis on user-friendly interfaces and seamless integration with existing healthcare ecosystems.
Key Drivers of Bluetooth Inhaler Growth
Several factors are driving the growth of the Bluetooth inhaler market, including:
- Technological Advancements: Miniaturization of sensors, improved connectivity, and the development of advanced algorithms for data analysis are key drivers.
- Economic Factors: Rising disposable incomes in developing economies are increasing the affordability of smart inhalers.
- Regulatory Support: Favorable regulatory environments in several countries are accelerating market adoption.
Challenges in the Bluetooth Inhaler Market
The Bluetooth inhaler market faces challenges, including:
- Regulatory Hurdles: Obtaining regulatory approvals can be time-consuming and costly, hindering market entry.
- Supply Chain Issues: The complexities of integrating multiple components can impact production efficiency and cost.
- Competitive Pressures: Intense competition among established and emerging players necessitates continuous innovation. This competition is estimated to reduce average selling prices by xx% by 2033.
Emerging Opportunities in Bluetooth Inhaler
The long-term growth of the Bluetooth inhaler market is fueled by several opportunities:
- Integration with AI and Machine Learning: This technology will enable more personalized treatment plans and improved patient outcomes.
- Expansion into Emerging Markets: Untapped potential in developing countries offers significant growth opportunities.
- Strategic Partnerships: Collaboration between technology companies and healthcare providers can accelerate market adoption and innovation.
Leading Players in the Bluetooth Inhaler Sector
- Adherium
- Shanghai Sonmol Medical Devices
- Cohero Health
- Yisuo Intelligent Technology (Shanghai)
- Medical International Research(MIR)
Key Milestones in Bluetooth Inhaler Industry
- 2020: Launch of a new Bluetooth inhaler with improved sensor technology by Adherium.
- 2021: Regulatory approval of a smart inhaler by Cohero Health in a major market.
- 2022: Acquisition of a smaller inhaler company by Shanghai Sonmol Medical Devices. (Further milestones can be added based on available data)
Strategic Outlook for Bluetooth Inhaler Market
The Bluetooth inhaler market is poised for significant growth in the coming years. The convergence of technological advancements, supportive regulatory environments, and increasing consumer demand for connected healthcare solutions create a favorable market outlook. Strategic partnerships, focusing on integrating Bluetooth inhalers within broader digital health platforms, will play a key role in driving future market expansion. The focus on data-driven insights and personalized therapies will be critical for success in this competitive market.
Bluetooth Inhaler Segmentation
-
1. Application
- 1.1. Medical
- 1.2. Household
-
2. Types
- 2.1. Rechargeable
- 2.2. Battery Powered
Bluetooth Inhaler Segmentation By Geography
-
1. North America
- 1.1. United States
- 1.2. Canada
- 1.3. Mexico
-
2. South America
- 2.1. Brazil
- 2.2. Argentina
- 2.3. Rest of South America
-
3. Europe
- 3.1. United Kingdom
- 3.2. Germany
- 3.3. France
- 3.4. Italy
- 3.5. Spain
- 3.6. Russia
- 3.7. Benelux
- 3.8. Nordics
- 3.9. Rest of Europe
-
4. Middle East & Africa
- 4.1. Turkey
- 4.2. Israel
- 4.3. GCC
- 4.4. North Africa
- 4.5. South Africa
- 4.6. Rest of Middle East & Africa
-
5. Asia Pacific
- 5.1. China
- 5.2. India
- 5.3. Japan
- 5.4. South Korea
- 5.5. ASEAN
- 5.6. Oceania
- 5.7. Rest of Asia Pacific
Bluetooth Inhaler Regional Market Share
Geographic Coverage of Bluetooth Inhaler
Bluetooth Inhaler REPORT HIGHLIGHTS
| Aspects | Details |
|---|---|
| Study Period | 2020-2034 |
| Base Year | 2025 |
| Estimated Year | 2026 |
| Forecast Period | 2026-2034 |
| Historical Period | 2020-2025 |
| Growth Rate | CAGR of 42.52% from 2020-2034 |
| Segmentation |
|
Table of Contents
- 1. Introduction
- 1.1. Research Scope
- 1.2. Market Segmentation
- 1.3. Research Objective
- 1.4. Definitions and Assumptions
- 2. Executive Summary
- 2.1. Market Snapshot
- 3. Market Dynamics
- 3.1. Market Drivers
- 3.2. Market Restrains
- 3.3. Market Trends
- 3.4. Market Opportunities
- 4. Market Factor Analysis
- 4.1. Porters Five Forces
- 4.1.1. Bargaining Power of Suppliers
- 4.1.2. Bargaining Power of Buyers
- 4.1.3. Threat of New Entrants
- 4.1.4. Threat of Substitutes
- 4.1.5. Competitive Rivalry
- 4.2. PESTEL analysis
- 4.3. BCG Analysis
- 4.3.1. Stars (High Growth, High Market Share)
- 4.3.2. Cash Cows (Low Growth, High Market Share)
- 4.3.3. Question Mark (High Growth, Low Market Share)
- 4.3.4. Dogs (Low Growth, Low Market Share)
- 4.4. Ansoff Matrix Analysis
- 4.5. Supply Chain Analysis
- 4.6. Regulatory Landscape
- 4.7. Current Market Potential and Opportunity Assessment (TAM–SAM–SOM Framework)
- 4.8. MDP Analyst Note
- 4.1. Porters Five Forces
- 5. Market Analysis, Insights and Forecast 2021-2033
- 5.1. Market Analysis, Insights and Forecast - by Application
- 5.1.1. Medical
- 5.1.2. Household
- 5.2. Market Analysis, Insights and Forecast - by Types
- 5.2.1. Rechargeable
- 5.2.2. Battery Powered
- 5.3. Market Analysis, Insights and Forecast - by Region
- 5.3.1. North America
- 5.3.2. South America
- 5.3.3. Europe
- 5.3.4. Middle East & Africa
- 5.3.5. Asia Pacific
- 5.1. Market Analysis, Insights and Forecast - by Application
- 6. Global Bluetooth Inhaler Analysis, Insights and Forecast, 2021-2033
- 6.1. Market Analysis, Insights and Forecast - by Application
- 6.1.1. Medical
- 6.1.2. Household
- 6.2. Market Analysis, Insights and Forecast - by Types
- 6.2.1. Rechargeable
- 6.2.2. Battery Powered
- 6.1. Market Analysis, Insights and Forecast - by Application
- 7. North America Bluetooth Inhaler Analysis, Insights and Forecast, 2020-2032
- 7.1. Market Analysis, Insights and Forecast - by Application
- 7.1.1. Medical
- 7.1.2. Household
- 7.2. Market Analysis, Insights and Forecast - by Types
- 7.2.1. Rechargeable
- 7.2.2. Battery Powered
- 7.1. Market Analysis, Insights and Forecast - by Application
- 8. South America Bluetooth Inhaler Analysis, Insights and Forecast, 2020-2032
- 8.1. Market Analysis, Insights and Forecast - by Application
- 8.1.1. Medical
- 8.1.2. Household
- 8.2. Market Analysis, Insights and Forecast - by Types
- 8.2.1. Rechargeable
- 8.2.2. Battery Powered
- 8.1. Market Analysis, Insights and Forecast - by Application
- 9. Europe Bluetooth Inhaler Analysis, Insights and Forecast, 2020-2032
- 9.1. Market Analysis, Insights and Forecast - by Application
- 9.1.1. Medical
- 9.1.2. Household
- 9.2. Market Analysis, Insights and Forecast - by Types
- 9.2.1. Rechargeable
- 9.2.2. Battery Powered
- 9.1. Market Analysis, Insights and Forecast - by Application
- 10. Middle East & Africa Bluetooth Inhaler Analysis, Insights and Forecast, 2020-2032
- 10.1. Market Analysis, Insights and Forecast - by Application
- 10.1.1. Medical
- 10.1.2. Household
- 10.2. Market Analysis, Insights and Forecast - by Types
- 10.2.1. Rechargeable
- 10.2.2. Battery Powered
- 10.1. Market Analysis, Insights and Forecast - by Application
- 11. Asia Pacific Bluetooth Inhaler Analysis, Insights and Forecast, 2020-2032
- 11.1. Market Analysis, Insights and Forecast - by Application
- 11.1.1. Medical
- 11.1.2. Household
- 11.2. Market Analysis, Insights and Forecast - by Types
- 11.2.1. Rechargeable
- 11.2.2. Battery Powered
- 11.1. Market Analysis, Insights and Forecast - by Application
- 12. Competitive Analysis
- 12.1. Company Profiles
- 12.1.1 Adherium
- 12.1.1.1. Company Overview
- 12.1.1.2. Products
- 12.1.1.3. Company Financials
- 12.1.1.4. SWOT Analysis
- 12.1.2 Shanghai Sonmol Medical Devices
- 12.1.2.1. Company Overview
- 12.1.2.2. Products
- 12.1.2.3. Company Financials
- 12.1.2.4. SWOT Analysis
- 12.1.3 Cohero Health
- 12.1.3.1. Company Overview
- 12.1.3.2. Products
- 12.1.3.3. Company Financials
- 12.1.3.4. SWOT Analysis
- 12.1.4 Yisuo Intelligent Technology (Shanghai)
- 12.1.4.1. Company Overview
- 12.1.4.2. Products
- 12.1.4.3. Company Financials
- 12.1.4.4. SWOT Analysis
- 12.1.5 Medical International Research(MIR)
- 12.1.5.1. Company Overview
- 12.1.5.2. Products
- 12.1.5.3. Company Financials
- 12.1.5.4. SWOT Analysis
- 12.1.1 Adherium
- 12.2. Market Entropy
- 12.2.1 Company's Key Areas Served
- 12.2.2 Recent Developments
- 12.3. Company Market Share Analysis 2025
- 12.3.1 Top 5 Companies Market Share Analysis
- 12.3.2 Top 3 Companies Market Share Analysis
- 12.4. List of Potential Customers
- 13. Research Methodology
List of Figures
- Figure 1: Global Bluetooth Inhaler Revenue Breakdown (million, %) by Region 2025 & 2033
- Figure 2: Global Bluetooth Inhaler Volume Breakdown (K, %) by Region 2025 & 2033
- Figure 3: North America Bluetooth Inhaler Revenue (million), by Application 2025 & 2033
- Figure 4: North America Bluetooth Inhaler Volume (K), by Application 2025 & 2033
- Figure 5: North America Bluetooth Inhaler Revenue Share (%), by Application 2025 & 2033
- Figure 6: North America Bluetooth Inhaler Volume Share (%), by Application 2025 & 2033
- Figure 7: North America Bluetooth Inhaler Revenue (million), by Types 2025 & 2033
- Figure 8: North America Bluetooth Inhaler Volume (K), by Types 2025 & 2033
- Figure 9: North America Bluetooth Inhaler Revenue Share (%), by Types 2025 & 2033
- Figure 10: North America Bluetooth Inhaler Volume Share (%), by Types 2025 & 2033
- Figure 11: North America Bluetooth Inhaler Revenue (million), by Country 2025 & 2033
- Figure 12: North America Bluetooth Inhaler Volume (K), by Country 2025 & 2033
- Figure 13: North America Bluetooth Inhaler Revenue Share (%), by Country 2025 & 2033
- Figure 14: North America Bluetooth Inhaler Volume Share (%), by Country 2025 & 2033
- Figure 15: South America Bluetooth Inhaler Revenue (million), by Application 2025 & 2033
- Figure 16: South America Bluetooth Inhaler Volume (K), by Application 2025 & 2033
- Figure 17: South America Bluetooth Inhaler Revenue Share (%), by Application 2025 & 2033
- Figure 18: South America Bluetooth Inhaler Volume Share (%), by Application 2025 & 2033
- Figure 19: South America Bluetooth Inhaler Revenue (million), by Types 2025 & 2033
- Figure 20: South America Bluetooth Inhaler Volume (K), by Types 2025 & 2033
- Figure 21: South America Bluetooth Inhaler Revenue Share (%), by Types 2025 & 2033
- Figure 22: South America Bluetooth Inhaler Volume Share (%), by Types 2025 & 2033
- Figure 23: South America Bluetooth Inhaler Revenue (million), by Country 2025 & 2033
- Figure 24: South America Bluetooth Inhaler Volume (K), by Country 2025 & 2033
- Figure 25: South America Bluetooth Inhaler Revenue Share (%), by Country 2025 & 2033
- Figure 26: South America Bluetooth Inhaler Volume Share (%), by Country 2025 & 2033
- Figure 27: Europe Bluetooth Inhaler Revenue (million), by Application 2025 & 2033
- Figure 28: Europe Bluetooth Inhaler Volume (K), by Application 2025 & 2033
- Figure 29: Europe Bluetooth Inhaler Revenue Share (%), by Application 2025 & 2033
- Figure 30: Europe Bluetooth Inhaler Volume Share (%), by Application 2025 & 2033
- Figure 31: Europe Bluetooth Inhaler Revenue (million), by Types 2025 & 2033
- Figure 32: Europe Bluetooth Inhaler Volume (K), by Types 2025 & 2033
- Figure 33: Europe Bluetooth Inhaler Revenue Share (%), by Types 2025 & 2033
- Figure 34: Europe Bluetooth Inhaler Volume Share (%), by Types 2025 & 2033
- Figure 35: Europe Bluetooth Inhaler Revenue (million), by Country 2025 & 2033
- Figure 36: Europe Bluetooth Inhaler Volume (K), by Country 2025 & 2033
- Figure 37: Europe Bluetooth Inhaler Revenue Share (%), by Country 2025 & 2033
- Figure 38: Europe Bluetooth Inhaler Volume Share (%), by Country 2025 & 2033
- Figure 39: Middle East & Africa Bluetooth Inhaler Revenue (million), by Application 2025 & 2033
- Figure 40: Middle East & Africa Bluetooth Inhaler Volume (K), by Application 2025 & 2033
- Figure 41: Middle East & Africa Bluetooth Inhaler Revenue Share (%), by Application 2025 & 2033
- Figure 42: Middle East & Africa Bluetooth Inhaler Volume Share (%), by Application 2025 & 2033
- Figure 43: Middle East & Africa Bluetooth Inhaler Revenue (million), by Types 2025 & 2033
- Figure 44: Middle East & Africa Bluetooth Inhaler Volume (K), by Types 2025 & 2033
- Figure 45: Middle East & Africa Bluetooth Inhaler Revenue Share (%), by Types 2025 & 2033
- Figure 46: Middle East & Africa Bluetooth Inhaler Volume Share (%), by Types 2025 & 2033
- Figure 47: Middle East & Africa Bluetooth Inhaler Revenue (million), by Country 2025 & 2033
- Figure 48: Middle East & Africa Bluetooth Inhaler Volume (K), by Country 2025 & 2033
- Figure 49: Middle East & Africa Bluetooth Inhaler Revenue Share (%), by Country 2025 & 2033
- Figure 50: Middle East & Africa Bluetooth Inhaler Volume Share (%), by Country 2025 & 2033
- Figure 51: Asia Pacific Bluetooth Inhaler Revenue (million), by Application 2025 & 2033
- Figure 52: Asia Pacific Bluetooth Inhaler Volume (K), by Application 2025 & 2033
- Figure 53: Asia Pacific Bluetooth Inhaler Revenue Share (%), by Application 2025 & 2033
- Figure 54: Asia Pacific Bluetooth Inhaler Volume Share (%), by Application 2025 & 2033
- Figure 55: Asia Pacific Bluetooth Inhaler Revenue (million), by Types 2025 & 2033
- Figure 56: Asia Pacific Bluetooth Inhaler Volume (K), by Types 2025 & 2033
- Figure 57: Asia Pacific Bluetooth Inhaler Revenue Share (%), by Types 2025 & 2033
- Figure 58: Asia Pacific Bluetooth Inhaler Volume Share (%), by Types 2025 & 2033
- Figure 59: Asia Pacific Bluetooth Inhaler Revenue (million), by Country 2025 & 2033
- Figure 60: Asia Pacific Bluetooth Inhaler Volume (K), by Country 2025 & 2033
- Figure 61: Asia Pacific Bluetooth Inhaler Revenue Share (%), by Country 2025 & 2033
- Figure 62: Asia Pacific Bluetooth Inhaler Volume Share (%), by Country 2025 & 2033
List of Tables
- Table 1: Global Bluetooth Inhaler Revenue million Forecast, by Application 2020 & 2033
- Table 2: Global Bluetooth Inhaler Volume K Forecast, by Application 2020 & 2033
- Table 3: Global Bluetooth Inhaler Revenue million Forecast, by Types 2020 & 2033
- Table 4: Global Bluetooth Inhaler Volume K Forecast, by Types 2020 & 2033
- Table 5: Global Bluetooth Inhaler Revenue million Forecast, by Region 2020 & 2033
- Table 6: Global Bluetooth Inhaler Volume K Forecast, by Region 2020 & 2033
- Table 7: Global Bluetooth Inhaler Revenue million Forecast, by Application 2020 & 2033
- Table 8: Global Bluetooth Inhaler Volume K Forecast, by Application 2020 & 2033
- Table 9: Global Bluetooth Inhaler Revenue million Forecast, by Types 2020 & 2033
- Table 10: Global Bluetooth Inhaler Volume K Forecast, by Types 2020 & 2033
- Table 11: Global Bluetooth Inhaler Revenue million Forecast, by Country 2020 & 2033
- Table 12: Global Bluetooth Inhaler Volume K Forecast, by Country 2020 & 2033
- Table 13: United States Bluetooth Inhaler Revenue (million) Forecast, by Application 2020 & 2033
- Table 14: United States Bluetooth Inhaler Volume (K) Forecast, by Application 2020 & 2033
- Table 15: Canada Bluetooth Inhaler Revenue (million) Forecast, by Application 2020 & 2033
- Table 16: Canada Bluetooth Inhaler Volume (K) Forecast, by Application 2020 & 2033
- Table 17: Mexico Bluetooth Inhaler Revenue (million) Forecast, by Application 2020 & 2033
- Table 18: Mexico Bluetooth Inhaler Volume (K) Forecast, by Application 2020 & 2033
- Table 19: Global Bluetooth Inhaler Revenue million Forecast, by Application 2020 & 2033
- Table 20: Global Bluetooth Inhaler Volume K Forecast, by Application 2020 & 2033
- Table 21: Global Bluetooth Inhaler Revenue million Forecast, by Types 2020 & 2033
- Table 22: Global Bluetooth Inhaler Volume K Forecast, by Types 2020 & 2033
- Table 23: Global Bluetooth Inhaler Revenue million Forecast, by Country 2020 & 2033
- Table 24: Global Bluetooth Inhaler Volume K Forecast, by Country 2020 & 2033
- Table 25: Brazil Bluetooth Inhaler Revenue (million) Forecast, by Application 2020 & 2033
- Table 26: Brazil Bluetooth Inhaler Volume (K) Forecast, by Application 2020 & 2033
- Table 27: Argentina Bluetooth Inhaler Revenue (million) Forecast, by Application 2020 & 2033
- Table 28: Argentina Bluetooth Inhaler Volume (K) Forecast, by Application 2020 & 2033
- Table 29: Rest of South America Bluetooth Inhaler Revenue (million) Forecast, by Application 2020 & 2033
- Table 30: Rest of South America Bluetooth Inhaler Volume (K) Forecast, by Application 2020 & 2033
- Table 31: Global Bluetooth Inhaler Revenue million Forecast, by Application 2020 & 2033
- Table 32: Global Bluetooth Inhaler Volume K Forecast, by Application 2020 & 2033
- Table 33: Global Bluetooth Inhaler Revenue million Forecast, by Types 2020 & 2033
- Table 34: Global Bluetooth Inhaler Volume K Forecast, by Types 2020 & 2033
- Table 35: Global Bluetooth Inhaler Revenue million Forecast, by Country 2020 & 2033
- Table 36: Global Bluetooth Inhaler Volume K Forecast, by Country 2020 & 2033
- Table 37: United Kingdom Bluetooth Inhaler Revenue (million) Forecast, by Application 2020 & 2033
- Table 38: United Kingdom Bluetooth Inhaler Volume (K) Forecast, by Application 2020 & 2033
- Table 39: Germany Bluetooth Inhaler Revenue (million) Forecast, by Application 2020 & 2033
- Table 40: Germany Bluetooth Inhaler Volume (K) Forecast, by Application 2020 & 2033
- Table 41: France Bluetooth Inhaler Revenue (million) Forecast, by Application 2020 & 2033
- Table 42: France Bluetooth Inhaler Volume (K) Forecast, by Application 2020 & 2033
- Table 43: Italy Bluetooth Inhaler Revenue (million) Forecast, by Application 2020 & 2033
- Table 44: Italy Bluetooth Inhaler Volume (K) Forecast, by Application 2020 & 2033
- Table 45: Spain Bluetooth Inhaler Revenue (million) Forecast, by Application 2020 & 2033
- Table 46: Spain Bluetooth Inhaler Volume (K) Forecast, by Application 2020 & 2033
- Table 47: Russia Bluetooth Inhaler Revenue (million) Forecast, by Application 2020 & 2033
- Table 48: Russia Bluetooth Inhaler Volume (K) Forecast, by Application 2020 & 2033
- Table 49: Benelux Bluetooth Inhaler Revenue (million) Forecast, by Application 2020 & 2033
- Table 50: Benelux Bluetooth Inhaler Volume (K) Forecast, by Application 2020 & 2033
- Table 51: Nordics Bluetooth Inhaler Revenue (million) Forecast, by Application 2020 & 2033
- Table 52: Nordics Bluetooth Inhaler Volume (K) Forecast, by Application 2020 & 2033
- Table 53: Rest of Europe Bluetooth Inhaler Revenue (million) Forecast, by Application 2020 & 2033
- Table 54: Rest of Europe Bluetooth Inhaler Volume (K) Forecast, by Application 2020 & 2033
- Table 55: Global Bluetooth Inhaler Revenue million Forecast, by Application 2020 & 2033
- Table 56: Global Bluetooth Inhaler Volume K Forecast, by Application 2020 & 2033
- Table 57: Global Bluetooth Inhaler Revenue million Forecast, by Types 2020 & 2033
- Table 58: Global Bluetooth Inhaler Volume K Forecast, by Types 2020 & 2033
- Table 59: Global Bluetooth Inhaler Revenue million Forecast, by Country 2020 & 2033
- Table 60: Global Bluetooth Inhaler Volume K Forecast, by Country 2020 & 2033
- Table 61: Turkey Bluetooth Inhaler Revenue (million) Forecast, by Application 2020 & 2033
- Table 62: Turkey Bluetooth Inhaler Volume (K) Forecast, by Application 2020 & 2033
- Table 63: Israel Bluetooth Inhaler Revenue (million) Forecast, by Application 2020 & 2033
- Table 64: Israel Bluetooth Inhaler Volume (K) Forecast, by Application 2020 & 2033
- Table 65: GCC Bluetooth Inhaler Revenue (million) Forecast, by Application 2020 & 2033
- Table 66: GCC Bluetooth Inhaler Volume (K) Forecast, by Application 2020 & 2033
- Table 67: North Africa Bluetooth Inhaler Revenue (million) Forecast, by Application 2020 & 2033
- Table 68: North Africa Bluetooth Inhaler Volume (K) Forecast, by Application 2020 & 2033
- Table 69: South Africa Bluetooth Inhaler Revenue (million) Forecast, by Application 2020 & 2033
- Table 70: South Africa Bluetooth Inhaler Volume (K) Forecast, by Application 2020 & 2033
- Table 71: Rest of Middle East & Africa Bluetooth Inhaler Revenue (million) Forecast, by Application 2020 & 2033
- Table 72: Rest of Middle East & Africa Bluetooth Inhaler Volume (K) Forecast, by Application 2020 & 2033
- Table 73: Global Bluetooth Inhaler Revenue million Forecast, by Application 2020 & 2033
- Table 74: Global Bluetooth Inhaler Volume K Forecast, by Application 2020 & 2033
- Table 75: Global Bluetooth Inhaler Revenue million Forecast, by Types 2020 & 2033
- Table 76: Global Bluetooth Inhaler Volume K Forecast, by Types 2020 & 2033
- Table 77: Global Bluetooth Inhaler Revenue million Forecast, by Country 2020 & 2033
- Table 78: Global Bluetooth Inhaler Volume K Forecast, by Country 2020 & 2033
- Table 79: China Bluetooth Inhaler Revenue (million) Forecast, by Application 2020 & 2033
- Table 80: China Bluetooth Inhaler Volume (K) Forecast, by Application 2020 & 2033
- Table 81: India Bluetooth Inhaler Revenue (million) Forecast, by Application 2020 & 2033
- Table 82: India Bluetooth Inhaler Volume (K) Forecast, by Application 2020 & 2033
- Table 83: Japan Bluetooth Inhaler Revenue (million) Forecast, by Application 2020 & 2033
- Table 84: Japan Bluetooth Inhaler Volume (K) Forecast, by Application 2020 & 2033
- Table 85: South Korea Bluetooth Inhaler Revenue (million) Forecast, by Application 2020 & 2033
- Table 86: South Korea Bluetooth Inhaler Volume (K) Forecast, by Application 2020 & 2033
- Table 87: ASEAN Bluetooth Inhaler Revenue (million) Forecast, by Application 2020 & 2033
- Table 88: ASEAN Bluetooth Inhaler Volume (K) Forecast, by Application 2020 & 2033
- Table 89: Oceania Bluetooth Inhaler Revenue (million) Forecast, by Application 2020 & 2033
- Table 90: Oceania Bluetooth Inhaler Volume (K) Forecast, by Application 2020 & 2033
- Table 91: Rest of Asia Pacific Bluetooth Inhaler Revenue (million) Forecast, by Application 2020 & 2033
- Table 92: Rest of Asia Pacific Bluetooth Inhaler Volume (K) Forecast, by Application 2020 & 2033
Frequently Asked Questions
1. What is the projected Compound Annual Growth Rate (CAGR) of the Bluetooth Inhaler?
The projected CAGR is approximately 42.52%.
2. Which companies are prominent players in the Bluetooth Inhaler?
Key companies in the market include Adherium, Shanghai Sonmol Medical Devices, Cohero Health, Yisuo Intelligent Technology (Shanghai), Medical International Research(MIR).
3. What are the main segments of the Bluetooth Inhaler?
The market segments include Application, Types.
4. Can you provide details about the market size?
The market size is estimated to be USD 221.98 million as of 2022.
5. What are some drivers contributing to market growth?
N/A
6. What are the notable trends driving market growth?
N/A
7. Are there any restraints impacting market growth?
N/A
8. Can you provide examples of recent developments in the market?
N/A
9. What pricing options are available for accessing the report?
Pricing options include single-user, multi-user, and enterprise licenses priced at USD 3950.00, USD 5925.00, and USD 7900.00 respectively.
10. Is the market size provided in terms of value or volume?
The market size is provided in terms of value, measured in million and volume, measured in K.
11. Are there any specific market keywords associated with the report?
Yes, the market keyword associated with the report is "Bluetooth Inhaler," which aids in identifying and referencing the specific market segment covered.
12. How do I determine which pricing option suits my needs best?
The pricing options vary based on user requirements and access needs. Individual users may opt for single-user licenses, while businesses requiring broader access may choose multi-user or enterprise licenses for cost-effective access to the report.
13. Are there any additional resources or data provided in the Bluetooth Inhaler report?
While the report offers comprehensive insights, it's advisable to review the specific contents or supplementary materials provided to ascertain if additional resources or data are available.
14. How can I stay updated on further developments or reports in the Bluetooth Inhaler?
To stay informed about further developments, trends, and reports in the Bluetooth Inhaler, consider subscribing to industry newsletters, following relevant companies and organizations, or regularly checking reputable industry news sources and publications.
Methodology
Step 1 - Identification of Relevant Samples Size from Population Database


Step 2 - Approaches for Defining Global Market Size (Value, Volume* & Price*)

Note*: In applicable scenarios
Step 3 - Data Sources
Primary Research
- Web Analytics
- Survey Reports
- Research Institute
- Latest Research Reports
- Opinion Leaders
Secondary Research
- Annual Reports
- White Paper
- Latest Press Release
- Industry Association
- Paid Database
- Investor Presentations

Step 4 - Data Triangulation
Involves using different sources of information in order to increase the validity of a study
These sources are likely to be stakeholders in a program - participants, other researchers, program staff, other community members, and so on.
Then we put all data in single framework & apply various statistical tools to find out the dynamic on the market.
During the analysis stage, feedback from the stakeholder groups would be compared to determine areas of agreement as well as areas of divergence