

Key Insights
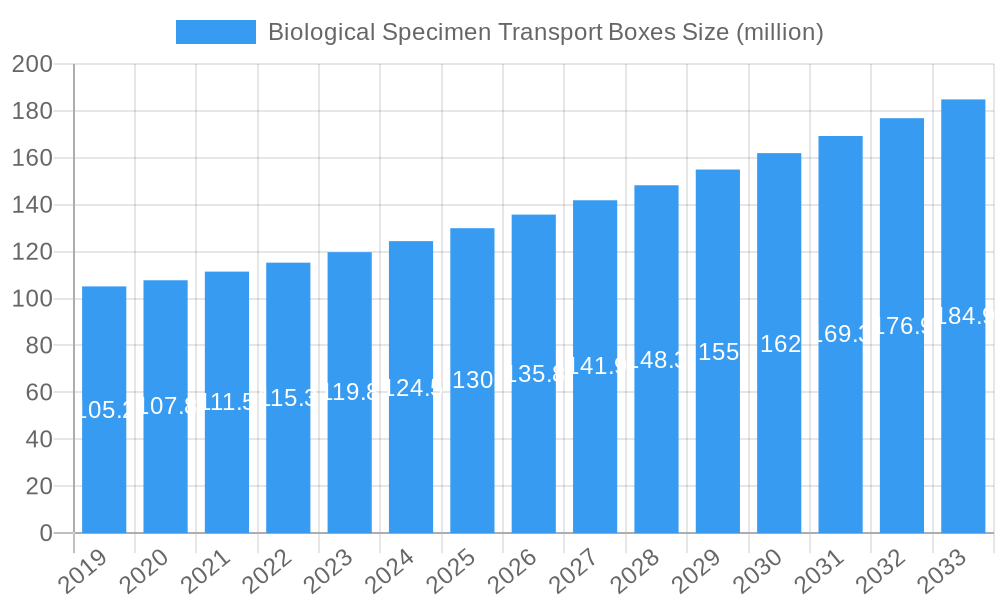
The global Biological Specimen Transport Boxes market is projected to reach a significant valuation of USD 140 million, exhibiting a robust Compound Annual Growth Rate (CAGR) of 4.8% from 2019 to 2033. This sustained growth is primarily fueled by the escalating demand for accurate and reliable transportation of biological samples across various healthcare and research sectors. Key drivers include the increasing prevalence of chronic diseases necessitating extensive diagnostic testing, a growing emphasis on personalized medicine and advanced research, and the expanding footprint of clinical trials and drug development activities worldwide. Furthermore, advancements in specimen preservation technologies, coupled with stringent regulatory requirements for sample integrity during transit, are compelling end-users to invest in high-quality transport solutions, thereby propelling market expansion. The surge in diagnostic testing, especially post-pandemic, has underscored the critical role of these specialized containers in maintaining sample viability from collection points to laboratories.
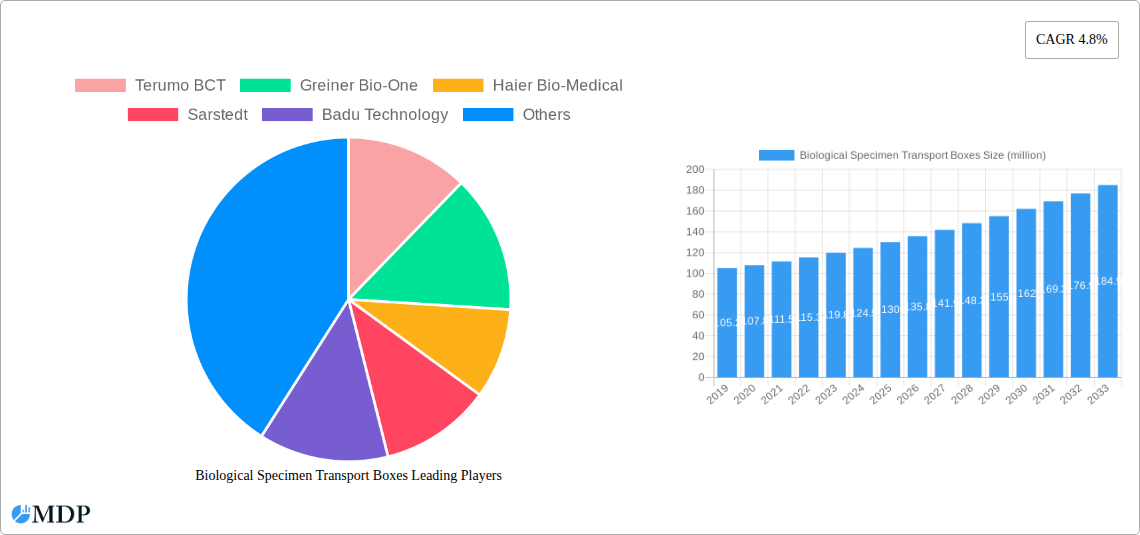
Biological Specimen Transport Boxes Market Size (In Million)
The market segmentation reveals a dynamic landscape with diverse applications and product variations catering to specific industry needs. Sample Collection Centers, Hospitals, and Clinical and Research Laboratories represent the dominant application segments, driven by the continuous flow of biological samples for diagnosis, research, and therapeutic development. The demand is further segmented by insulation thickness, with boxes offering insulation of 35MM~70MM and more than 70 MM likely to witness higher adoption rates due to their superior temperature-control capabilities, crucial for sensitive biological specimens. Emerging economies in the Asia Pacific region, particularly China and India, are expected to be significant growth engines, owing to their rapidly developing healthcare infrastructure and burgeoning pharmaceutical research sectors. North America and Europe remain mature yet substantial markets, characterized by high adoption of advanced technologies and a strong regulatory framework. Notable industry players such as Terumo BCT, Thermo Fisher, and Haier Bio-Medical are actively innovating and expanding their product portfolios to capture market share, focusing on enhanced thermal stability, tamper-evident features, and compliance with international shipping standards.
Biological Specimen Transport Boxes Company Market Share
Biological Specimen Transport Boxes Market Report: Strategic Insights & Growth Forecast (2019–2033)
This comprehensive report provides an in-depth analysis of the global Biological Specimen Transport Boxes market, spanning the historical period of 2019–2024, the base year of 2025, and a detailed forecast from 2025–2033. With a projected market size exceeding millions by 2033, this study is essential for industry stakeholders seeking to understand market dynamics, identify growth opportunities, and navigate the competitive landscape of biological specimen transport solutions. The report leverages high-traffic keywords such as "medical specimen boxes," "cold chain logistics," "sample transport containers," and "laboratory shipping solutions" to maximize search visibility and attract key industry players including Terumo BCT, Greiner Bio-One, Haier Bio-Medical, Sarstedt, Badu Technology, Thermo Fisher, Fresenius Kabi, Labcold, Heathrow Scientific, Medicus Health, Polar Thermal Packaging, Blowkings, Shenzhen Chunde Technology Co., Ltd., and Shandong Sanjiang Medical Technology Co., Ltd.
Biological Specimen Transport Boxes Market Dynamics & Concentration
The global Biological Specimen Transport Boxes market exhibits a moderate concentration, with a few prominent players holding significant market share. Key innovation drivers fueling this growth include the increasing demand for temperature-controlled transport of sensitive biological samples, advancements in insulation materials, and the integration of tracking technologies. Regulatory frameworks, such as those mandated by the FDA and WHO for the safe transport of biohazards, play a crucial role in shaping product development and market entry strategies. Product substitutes, while existing in the form of less sophisticated insulated containers, are increasingly being outperformed by specialized biological specimen transport boxes due to stringent sample integrity requirements. End-user trends are leaning towards solutions offering prolonged temperature stability, enhanced durability, and user-friendly designs for applications in sample collection centers, hospitals, and clinical and research laboratories. Mergers and acquisitions (M&A) activities are expected to contribute to market consolidation. For instance, recent M&A deals indicate a trend towards strategic acquisitions aimed at expanding product portfolios and geographical reach, with an estimated number of M&A activities observed between 2019 and 2024. The market share of leading companies is estimated to be within the range of percentage to percentage, highlighting a competitive yet consolidating environment.
Biological Specimen Transport Boxes Industry Trends & Analysis
The Biological Specimen Transport Boxes industry is poised for substantial growth, driven by several interconnected trends. A primary growth driver is the escalating volume of diagnostic testing and biomedical research globally, necessitating the reliable and secure transport of a diverse range of biological specimens. The increasing prevalence of infectious diseases, coupled with advancements in personalized medicine and genomic research, further amplifies the demand for specialized transport solutions that maintain sample viability and prevent degradation. Technological disruptions are continuously reshaping the market. Innovations in insulation materials, such as vacuum insulated panels (VIPs) and advanced phase change materials (PCMs), are enabling longer temperature hold times, crucial for intercontinental shipments. Furthermore, the integration of IoT sensors for real-time temperature monitoring and tamper detection is becoming a standard expectation, offering enhanced traceability and peace of mind. Consumer preferences are shifting towards sustainable and eco-friendly transport options, pushing manufacturers to explore biodegradable materials and energy-efficient designs. The competitive dynamics are characterized by intense product innovation, strategic pricing, and a focus on building robust distribution networks. Companies are investing heavily in R&D to develop next-generation transport boxes that offer superior thermal performance, lightweight construction, and compliance with evolving international shipping regulations. The Compound Annual Growth Rate (CAGR) for the Biological Specimen Transport Boxes market is estimated to be percentage during the forecast period. Market penetration for advanced specimen transport solutions is expected to reach percentage by 2033, indicating significant adoption across various end-user segments.
Leading Markets & Segments in Biological Specimen Transport Boxes
North America currently dominates the Biological Specimen Transport Boxes market, primarily driven by a well-established healthcare infrastructure, high R&D expenditure in the life sciences sector, and stringent regulatory requirements that mandate the use of compliant transport solutions. Within North America, the United States stands out as the leading country due to its extensive network of hospitals, advanced clinical and research laboratories, and a significant volume of biological sample movements for diagnostics and clinical trials.
Application Segments Dominance:
- Clinical and Research Laboratories: This segment represents the largest application, fueled by the continuous need for sample integrity in academic research, drug discovery, and advanced diagnostics. Key drivers include the growing complexity of research studies and the global expansion of contract research organizations (CROs). The market share for this segment is projected to be percentage.
- Hospitals: Hospitals are a major consumer, requiring reliable transport for patient samples from collection points to on-site or off-site laboratories. Factors contributing to their dominance include an increasing patient volume and the decentralization of laboratory services. Their estimated market share is percentage.
- Sample Collection Centers: With the rise of drive-through and at-home testing models, sample collection centers are emerging as a significant growth area, necessitating specialized, portable, and temperature-controlled transport solutions. This segment is expected to grow at a CAGR of percentage.
- Others: This segment encompasses various niche applications, including veterinary diagnostics and environmental sample testing, which also contribute to market demand.
Type Segments Dominance (Insulation Thickness):
- 35MM~70MM: Boxes with insulation thickness between 35MM and 70MM are currently the most widely adopted due to their optimal balance of thermal performance, capacity, and cost-effectiveness for a broad range of shipping durations and ambient conditions. Their market share is estimated at percentage.
- More Than 70 MM: These high-performance boxes cater to extremely long-haul shipments and highly sensitive biological materials requiring extended temperature stability, making them crucial for global supply chains. This segment is experiencing robust growth at a CAGR of percentage.
- Less Than 35 MM: While offering lower thermal performance, these boxes are suitable for short-distance transport or less temperature-sensitive samples, representing a smaller but consistent market share of percentage.
Biological Specimen Transport Boxes Product Developments
Product innovations in the Biological Specimen Transport Boxes sector are increasingly focused on enhancing thermal efficiency, durability, and user experience. Manufacturers are developing lighter yet more robust materials, advanced insulation technologies like vacuum insulation, and integrated temperature monitoring systems. These advancements ensure extended temperature hold times, vital for preserving sample integrity during transit. Key competitive advantages stem from superior temperature control capabilities, compliance with international shipping regulations (e.g., IATA), and the integration of smart features for real-time tracking and data logging, catering to the evolving needs of sample collection centers, hospitals, and clinical laboratories.
Key Drivers of Biological Specimen Transport Boxes Growth
The growth of the Biological Specimen Transport Boxes market is propelled by several key factors. The expanding global diagnostics and research industries, driven by an aging population and increasing healthcare expenditure, necessitate more reliable sample transport. Technological advancements in insulation materials and temperature monitoring systems are enhancing the performance and compliance of these boxes. Furthermore, stricter regulatory mandates for the safe and secure transportation of biological samples are compelling users to adopt advanced, compliant solutions. The growing demand for cold chain logistics in pharmaceuticals and life sciences further bolsters market expansion.
Challenges in the Biological Specimen Transport Boxes Market
Despite its robust growth, the Biological Specimen Transport Boxes market faces several challenges. High initial manufacturing costs for advanced, high-performance boxes can be a barrier for smaller institutions. Fluctuations in raw material prices, particularly for specialized insulation components, can impact profitability. Additionally, the evolving and complex international shipping regulations for biological materials require continuous adaptation and investment in compliance, posing a challenge for smaller players. Intense competition also leads to price pressures, potentially affecting profit margins. The logistics of managing a global supply chain for these specialized products also presents operational hurdles.
Emerging Opportunities in Biological Specimen Transport Boxes
Emerging opportunities in the Biological Specimen Transport Boxes market are abundant, driven by technological breakthroughs and evolving market demands. The increasing adoption of telemedicine and remote patient monitoring creates a burgeoning demand for reliable home-based sample collection and transport solutions. Advancements in sustainable materials and biodegradable packaging present a significant opportunity for eco-conscious manufacturers. Furthermore, strategic partnerships between transport box manufacturers and logistics providers, as well as pharmaceutical companies, can lead to integrated cold chain solutions and expanded market reach. The growing focus on personalized medicine and cell and gene therapies, which require highly specialized and temperature-sensitive transport, also offers significant growth potential.
Leading Players in the Biological Specimen Transport Boxes Sector
- Terumo BCT
- Greiner Bio-One
- Haier Bio-Medical
- Sarstedt
- Badu Technology
- Thermo Fisher
- Fresenius Kabi
- Labcold
- Heathrow Scientific
- Medicus Health
- Polar Thermal Packaging
- Blowkings
- Shenzhen Chunde Technology Co., Ltd.
- Shandong Sanjiang Medical Technology Co., Ltd.
Key Milestones in Biological Specimen Transport Boxes Industry
- 2019: Increased adoption of temperature-monitoring sensors and data loggers integrated into specimen transport boxes for enhanced traceability.
- 2020: Surge in demand for specialized transport solutions driven by the global COVID-19 pandemic and the need for widespread sample testing.
- 2021: Introduction of advanced vacuum insulation panel (VIP) technology in commercial specimen transport boxes, significantly extending temperature hold times.
- 2022: Growing emphasis on sustainable and eco-friendly packaging materials for specimen transport, with several manufacturers exploring biodegradable options.
- 2023: Key market players focus on expanding their product portfolios to include a wider range of temperature profiles and container sizes to cater to diverse application needs.
- 2024: Emergence of smart specimen transport boxes with IoT connectivity for real-time tracking and predictive maintenance alerts.
Strategic Outlook for Biological Specimen Transport Boxes Market
The strategic outlook for the Biological Specimen Transport Boxes market remains highly optimistic, driven by sustained demand from the expanding life sciences and healthcare sectors. Growth accelerators will include continued innovation in thermal insulation, the integration of smart technologies for enhanced traceability and data management, and a strong push towards sustainable packaging solutions. Companies that can offer a comprehensive suite of products catering to diverse temperature requirements and shipping durations, while also prioritizing regulatory compliance and end-user convenience, will be well-positioned for success. Strategic collaborations with diagnostic service providers and pharmaceutical companies will be crucial for expanding market penetration and developing tailored cold chain solutions.
Biological Specimen Transport Boxes Segmentation
-
1. Application
- 1.1. Sample Collection Center
- 1.2. Hospitals
- 1.3. Clinical and Research Laboratories
- 1.4. Others
-
2. Types
- 2.1. Insulation Thickness: Less than 35 MM
- 2.2. Insulation Thickness: 35MM~70MM
- 2.3. Insulation Thickness: More than 70 MM
Biological Specimen Transport Boxes Segmentation By Geography
-
1. North America
- 1.1. United States
- 1.2. Canada
- 1.3. Mexico
-
2. South America
- 2.1. Brazil
- 2.2. Argentina
- 2.3. Rest of South America
-
3. Europe
- 3.1. United Kingdom
- 3.2. Germany
- 3.3. France
- 3.4. Italy
- 3.5. Spain
- 3.6. Russia
- 3.7. Benelux
- 3.8. Nordics
- 3.9. Rest of Europe
-
4. Middle East & Africa
- 4.1. Turkey
- 4.2. Israel
- 4.3. GCC
- 4.4. North Africa
- 4.5. South Africa
- 4.6. Rest of Middle East & Africa
-
5. Asia Pacific
- 5.1. China
- 5.2. India
- 5.3. Japan
- 5.4. South Korea
- 5.5. ASEAN
- 5.6. Oceania
- 5.7. Rest of Asia Pacific
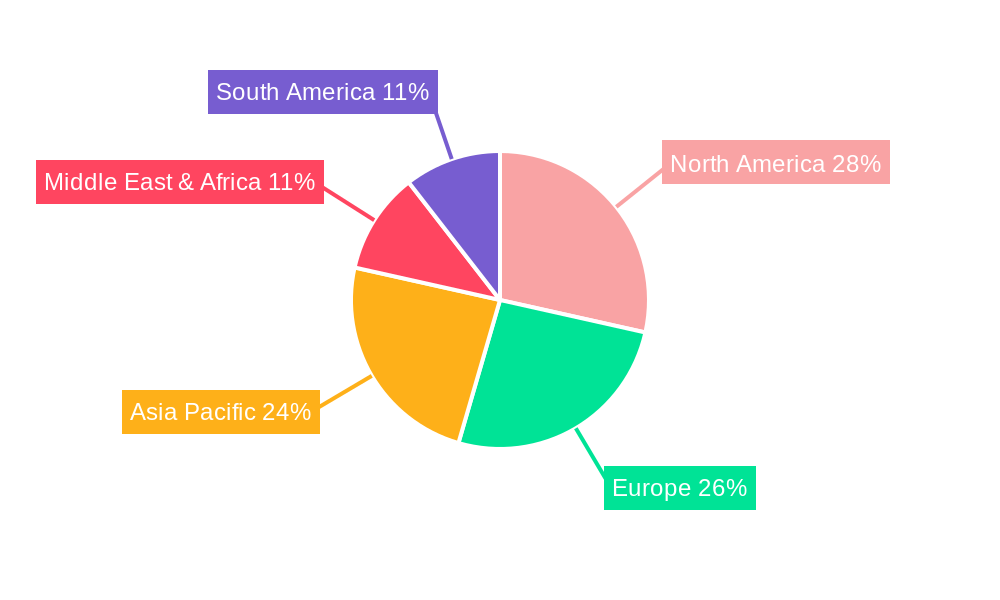
Biological Specimen Transport Boxes Regional Market Share
Geographic Coverage of Biological Specimen Transport Boxes
Biological Specimen Transport Boxes REPORT HIGHLIGHTS
| Aspects | Details |
|---|---|
| Study Period | 2020-2034 |
| Base Year | 2025 |
| Estimated Year | 2026 |
| Forecast Period | 2026-2034 |
| Historical Period | 2020-2025 |
| Growth Rate | CAGR of 6.1% from 2020-2034 |
| Segmentation |
|
Table of Contents
- 1. Introduction
- 1.1. Research Scope
- 1.2. Market Segmentation
- 1.3. Research Objective
- 1.4. Definitions and Assumptions
- 2. Executive Summary
- 2.1. Market Snapshot
- 3. Market Dynamics
- 3.1. Market Drivers
- 3.2. Market Restrains
- 3.3. Market Trends
- 3.4. Market Opportunities
- 4. Market Factor Analysis
- 4.1. Porters Five Forces
- 4.1.1. Bargaining Power of Suppliers
- 4.1.2. Bargaining Power of Buyers
- 4.1.3. Threat of New Entrants
- 4.1.4. Threat of Substitutes
- 4.1.5. Competitive Rivalry
- 4.2. PESTEL analysis
- 4.3. BCG Analysis
- 4.3.1. Stars (High Growth, High Market Share)
- 4.3.2. Cash Cows (Low Growth, High Market Share)
- 4.3.3. Question Mark (High Growth, Low Market Share)
- 4.3.4. Dogs (Low Growth, Low Market Share)
- 4.4. Ansoff Matrix Analysis
- 4.5. Supply Chain Analysis
- 4.6. Regulatory Landscape
- 4.7. Current Market Potential and Opportunity Assessment (TAM–SAM–SOM Framework)
- 4.8. MDP Analyst Note
- 4.1. Porters Five Forces
- 5. Market Analysis, Insights and Forecast 2021-2033
- 5.1. Market Analysis, Insights and Forecast - by Application
- 5.1.1. Sample Collection Center
- 5.1.2. Hospitals
- 5.1.3. Clinical and Research Laboratories
- 5.1.4. Others
- 5.2. Market Analysis, Insights and Forecast - by Types
- 5.2.1. Insulation Thickness: Less than 35 MM
- 5.2.2. Insulation Thickness: 35MM~70MM
- 5.2.3. Insulation Thickness: More than 70 MM
- 5.3. Market Analysis, Insights and Forecast - by Region
- 5.3.1. North America
- 5.3.2. South America
- 5.3.3. Europe
- 5.3.4. Middle East & Africa
- 5.3.5. Asia Pacific
- 5.1. Market Analysis, Insights and Forecast - by Application
- 6. Global Biological Specimen Transport Boxes Analysis, Insights and Forecast, 2021-2033
- 6.1. Market Analysis, Insights and Forecast - by Application
- 6.1.1. Sample Collection Center
- 6.1.2. Hospitals
- 6.1.3. Clinical and Research Laboratories
- 6.1.4. Others
- 6.2. Market Analysis, Insights and Forecast - by Types
- 6.2.1. Insulation Thickness: Less than 35 MM
- 6.2.2. Insulation Thickness: 35MM~70MM
- 6.2.3. Insulation Thickness: More than 70 MM
- 6.1. Market Analysis, Insights and Forecast - by Application
- 7. North America Biological Specimen Transport Boxes Analysis, Insights and Forecast, 2020-2032
- 7.1. Market Analysis, Insights and Forecast - by Application
- 7.1.1. Sample Collection Center
- 7.1.2. Hospitals
- 7.1.3. Clinical and Research Laboratories
- 7.1.4. Others
- 7.2. Market Analysis, Insights and Forecast - by Types
- 7.2.1. Insulation Thickness: Less than 35 MM
- 7.2.2. Insulation Thickness: 35MM~70MM
- 7.2.3. Insulation Thickness: More than 70 MM
- 7.1. Market Analysis, Insights and Forecast - by Application
- 8. South America Biological Specimen Transport Boxes Analysis, Insights and Forecast, 2020-2032
- 8.1. Market Analysis, Insights and Forecast - by Application
- 8.1.1. Sample Collection Center
- 8.1.2. Hospitals
- 8.1.3. Clinical and Research Laboratories
- 8.1.4. Others
- 8.2. Market Analysis, Insights and Forecast - by Types
- 8.2.1. Insulation Thickness: Less than 35 MM
- 8.2.2. Insulation Thickness: 35MM~70MM
- 8.2.3. Insulation Thickness: More than 70 MM
- 8.1. Market Analysis, Insights and Forecast - by Application
- 9. Europe Biological Specimen Transport Boxes Analysis, Insights and Forecast, 2020-2032
- 9.1. Market Analysis, Insights and Forecast - by Application
- 9.1.1. Sample Collection Center
- 9.1.2. Hospitals
- 9.1.3. Clinical and Research Laboratories
- 9.1.4. Others
- 9.2. Market Analysis, Insights and Forecast - by Types
- 9.2.1. Insulation Thickness: Less than 35 MM
- 9.2.2. Insulation Thickness: 35MM~70MM
- 9.2.3. Insulation Thickness: More than 70 MM
- 9.1. Market Analysis, Insights and Forecast - by Application
- 10. Middle East & Africa Biological Specimen Transport Boxes Analysis, Insights and Forecast, 2020-2032
- 10.1. Market Analysis, Insights and Forecast - by Application
- 10.1.1. Sample Collection Center
- 10.1.2. Hospitals
- 10.1.3. Clinical and Research Laboratories
- 10.1.4. Others
- 10.2. Market Analysis, Insights and Forecast - by Types
- 10.2.1. Insulation Thickness: Less than 35 MM
- 10.2.2. Insulation Thickness: 35MM~70MM
- 10.2.3. Insulation Thickness: More than 70 MM
- 10.1. Market Analysis, Insights and Forecast - by Application
- 11. Asia Pacific Biological Specimen Transport Boxes Analysis, Insights and Forecast, 2020-2032
- 11.1. Market Analysis, Insights and Forecast - by Application
- 11.1.1. Sample Collection Center
- 11.1.2. Hospitals
- 11.1.3. Clinical and Research Laboratories
- 11.1.4. Others
- 11.2. Market Analysis, Insights and Forecast - by Types
- 11.2.1. Insulation Thickness: Less than 35 MM
- 11.2.2. Insulation Thickness: 35MM~70MM
- 11.2.3. Insulation Thickness: More than 70 MM
- 11.1. Market Analysis, Insights and Forecast - by Application
- 12. Competitive Analysis
- 12.1. Company Profiles
- 12.1.1 Terumo BCT
- 12.1.1.1. Company Overview
- 12.1.1.2. Products
- 12.1.1.3. Company Financials
- 12.1.1.4. SWOT Analysis
- 12.1.2 Greiner Bio-One
- 12.1.2.1. Company Overview
- 12.1.2.2. Products
- 12.1.2.3. Company Financials
- 12.1.2.4. SWOT Analysis
- 12.1.3 Haier Bio-Medical
- 12.1.3.1. Company Overview
- 12.1.3.2. Products
- 12.1.3.3. Company Financials
- 12.1.3.4. SWOT Analysis
- 12.1.4 Sarstedt
- 12.1.4.1. Company Overview
- 12.1.4.2. Products
- 12.1.4.3. Company Financials
- 12.1.4.4. SWOT Analysis
- 12.1.5 Badu Technology
- 12.1.5.1. Company Overview
- 12.1.5.2. Products
- 12.1.5.3. Company Financials
- 12.1.5.4. SWOT Analysis
- 12.1.6 Thermo Fisher
- 12.1.6.1. Company Overview
- 12.1.6.2. Products
- 12.1.6.3. Company Financials
- 12.1.6.4. SWOT Analysis
- 12.1.7 Fresenius Kabi
- 12.1.7.1. Company Overview
- 12.1.7.2. Products
- 12.1.7.3. Company Financials
- 12.1.7.4. SWOT Analysis
- 12.1.8 Labcold
- 12.1.8.1. Company Overview
- 12.1.8.2. Products
- 12.1.8.3. Company Financials
- 12.1.8.4. SWOT Analysis
- 12.1.9 Heathrow Scientific
- 12.1.9.1. Company Overview
- 12.1.9.2. Products
- 12.1.9.3. Company Financials
- 12.1.9.4. SWOT Analysis
- 12.1.10 Medicus Health
- 12.1.10.1. Company Overview
- 12.1.10.2. Products
- 12.1.10.3. Company Financials
- 12.1.10.4. SWOT Analysis
- 12.1.11 Polar Thermal Packaging
- 12.1.11.1. Company Overview
- 12.1.11.2. Products
- 12.1.11.3. Company Financials
- 12.1.11.4. SWOT Analysis
- 12.1.12 Blowkings
- 12.1.12.1. Company Overview
- 12.1.12.2. Products
- 12.1.12.3. Company Financials
- 12.1.12.4. SWOT Analysis
- 12.1.13 Shenzhen Chunde Technology Co.
- 12.1.13.1. Company Overview
- 12.1.13.2. Products
- 12.1.13.3. Company Financials
- 12.1.13.4. SWOT Analysis
- 12.1.14 Ltd.
- 12.1.14.1. Company Overview
- 12.1.14.2. Products
- 12.1.14.3. Company Financials
- 12.1.14.4. SWOT Analysis
- 12.1.15 Shandong Sanjiang Medical Technology Co.
- 12.1.15.1. Company Overview
- 12.1.15.2. Products
- 12.1.15.3. Company Financials
- 12.1.15.4. SWOT Analysis
- 12.1.16 Ltd.
- 12.1.16.1. Company Overview
- 12.1.16.2. Products
- 12.1.16.3. Company Financials
- 12.1.16.4. SWOT Analysis
- 12.1.1 Terumo BCT
- 12.2. Market Entropy
- 12.2.1 Company's Key Areas Served
- 12.2.2 Recent Developments
- 12.3. Company Market Share Analysis 2025
- 12.3.1 Top 5 Companies Market Share Analysis
- 12.3.2 Top 3 Companies Market Share Analysis
- 12.4. List of Potential Customers
- 13. Research Methodology
List of Figures
- Figure 1: Global Biological Specimen Transport Boxes Revenue Breakdown (undefined, %) by Region 2025 & 2033
- Figure 2: Global Biological Specimen Transport Boxes Volume Breakdown (K, %) by Region 2025 & 2033
- Figure 3: North America Biological Specimen Transport Boxes Revenue (undefined), by Application 2025 & 2033
- Figure 4: North America Biological Specimen Transport Boxes Volume (K), by Application 2025 & 2033
- Figure 5: North America Biological Specimen Transport Boxes Revenue Share (%), by Application 2025 & 2033
- Figure 6: North America Biological Specimen Transport Boxes Volume Share (%), by Application 2025 & 2033
- Figure 7: North America Biological Specimen Transport Boxes Revenue (undefined), by Types 2025 & 2033
- Figure 8: North America Biological Specimen Transport Boxes Volume (K), by Types 2025 & 2033
- Figure 9: North America Biological Specimen Transport Boxes Revenue Share (%), by Types 2025 & 2033
- Figure 10: North America Biological Specimen Transport Boxes Volume Share (%), by Types 2025 & 2033
- Figure 11: North America Biological Specimen Transport Boxes Revenue (undefined), by Country 2025 & 2033
- Figure 12: North America Biological Specimen Transport Boxes Volume (K), by Country 2025 & 2033
- Figure 13: North America Biological Specimen Transport Boxes Revenue Share (%), by Country 2025 & 2033
- Figure 14: North America Biological Specimen Transport Boxes Volume Share (%), by Country 2025 & 2033
- Figure 15: South America Biological Specimen Transport Boxes Revenue (undefined), by Application 2025 & 2033
- Figure 16: South America Biological Specimen Transport Boxes Volume (K), by Application 2025 & 2033
- Figure 17: South America Biological Specimen Transport Boxes Revenue Share (%), by Application 2025 & 2033
- Figure 18: South America Biological Specimen Transport Boxes Volume Share (%), by Application 2025 & 2033
- Figure 19: South America Biological Specimen Transport Boxes Revenue (undefined), by Types 2025 & 2033
- Figure 20: South America Biological Specimen Transport Boxes Volume (K), by Types 2025 & 2033
- Figure 21: South America Biological Specimen Transport Boxes Revenue Share (%), by Types 2025 & 2033
- Figure 22: South America Biological Specimen Transport Boxes Volume Share (%), by Types 2025 & 2033
- Figure 23: South America Biological Specimen Transport Boxes Revenue (undefined), by Country 2025 & 2033
- Figure 24: South America Biological Specimen Transport Boxes Volume (K), by Country 2025 & 2033
- Figure 25: South America Biological Specimen Transport Boxes Revenue Share (%), by Country 2025 & 2033
- Figure 26: South America Biological Specimen Transport Boxes Volume Share (%), by Country 2025 & 2033
- Figure 27: Europe Biological Specimen Transport Boxes Revenue (undefined), by Application 2025 & 2033
- Figure 28: Europe Biological Specimen Transport Boxes Volume (K), by Application 2025 & 2033
- Figure 29: Europe Biological Specimen Transport Boxes Revenue Share (%), by Application 2025 & 2033
- Figure 30: Europe Biological Specimen Transport Boxes Volume Share (%), by Application 2025 & 2033
- Figure 31: Europe Biological Specimen Transport Boxes Revenue (undefined), by Types 2025 & 2033
- Figure 32: Europe Biological Specimen Transport Boxes Volume (K), by Types 2025 & 2033
- Figure 33: Europe Biological Specimen Transport Boxes Revenue Share (%), by Types 2025 & 2033
- Figure 34: Europe Biological Specimen Transport Boxes Volume Share (%), by Types 2025 & 2033
- Figure 35: Europe Biological Specimen Transport Boxes Revenue (undefined), by Country 2025 & 2033
- Figure 36: Europe Biological Specimen Transport Boxes Volume (K), by Country 2025 & 2033
- Figure 37: Europe Biological Specimen Transport Boxes Revenue Share (%), by Country 2025 & 2033
- Figure 38: Europe Biological Specimen Transport Boxes Volume Share (%), by Country 2025 & 2033
- Figure 39: Middle East & Africa Biological Specimen Transport Boxes Revenue (undefined), by Application 2025 & 2033
- Figure 40: Middle East & Africa Biological Specimen Transport Boxes Volume (K), by Application 2025 & 2033
- Figure 41: Middle East & Africa Biological Specimen Transport Boxes Revenue Share (%), by Application 2025 & 2033
- Figure 42: Middle East & Africa Biological Specimen Transport Boxes Volume Share (%), by Application 2025 & 2033
- Figure 43: Middle East & Africa Biological Specimen Transport Boxes Revenue (undefined), by Types 2025 & 2033
- Figure 44: Middle East & Africa Biological Specimen Transport Boxes Volume (K), by Types 2025 & 2033
- Figure 45: Middle East & Africa Biological Specimen Transport Boxes Revenue Share (%), by Types 2025 & 2033
- Figure 46: Middle East & Africa Biological Specimen Transport Boxes Volume Share (%), by Types 2025 & 2033
- Figure 47: Middle East & Africa Biological Specimen Transport Boxes Revenue (undefined), by Country 2025 & 2033
- Figure 48: Middle East & Africa Biological Specimen Transport Boxes Volume (K), by Country 2025 & 2033
- Figure 49: Middle East & Africa Biological Specimen Transport Boxes Revenue Share (%), by Country 2025 & 2033
- Figure 50: Middle East & Africa Biological Specimen Transport Boxes Volume Share (%), by Country 2025 & 2033
- Figure 51: Asia Pacific Biological Specimen Transport Boxes Revenue (undefined), by Application 2025 & 2033
- Figure 52: Asia Pacific Biological Specimen Transport Boxes Volume (K), by Application 2025 & 2033
- Figure 53: Asia Pacific Biological Specimen Transport Boxes Revenue Share (%), by Application 2025 & 2033
- Figure 54: Asia Pacific Biological Specimen Transport Boxes Volume Share (%), by Application 2025 & 2033
- Figure 55: Asia Pacific Biological Specimen Transport Boxes Revenue (undefined), by Types 2025 & 2033
- Figure 56: Asia Pacific Biological Specimen Transport Boxes Volume (K), by Types 2025 & 2033
- Figure 57: Asia Pacific Biological Specimen Transport Boxes Revenue Share (%), by Types 2025 & 2033
- Figure 58: Asia Pacific Biological Specimen Transport Boxes Volume Share (%), by Types 2025 & 2033
- Figure 59: Asia Pacific Biological Specimen Transport Boxes Revenue (undefined), by Country 2025 & 2033
- Figure 60: Asia Pacific Biological Specimen Transport Boxes Volume (K), by Country 2025 & 2033
- Figure 61: Asia Pacific Biological Specimen Transport Boxes Revenue Share (%), by Country 2025 & 2033
- Figure 62: Asia Pacific Biological Specimen Transport Boxes Volume Share (%), by Country 2025 & 2033
List of Tables
- Table 1: Global Biological Specimen Transport Boxes Revenue undefined Forecast, by Application 2020 & 2033
- Table 2: Global Biological Specimen Transport Boxes Volume K Forecast, by Application 2020 & 2033
- Table 3: Global Biological Specimen Transport Boxes Revenue undefined Forecast, by Types 2020 & 2033
- Table 4: Global Biological Specimen Transport Boxes Volume K Forecast, by Types 2020 & 2033
- Table 5: Global Biological Specimen Transport Boxes Revenue undefined Forecast, by Region 2020 & 2033
- Table 6: Global Biological Specimen Transport Boxes Volume K Forecast, by Region 2020 & 2033
- Table 7: Global Biological Specimen Transport Boxes Revenue undefined Forecast, by Application 2020 & 2033
- Table 8: Global Biological Specimen Transport Boxes Volume K Forecast, by Application 2020 & 2033
- Table 9: Global Biological Specimen Transport Boxes Revenue undefined Forecast, by Types 2020 & 2033
- Table 10: Global Biological Specimen Transport Boxes Volume K Forecast, by Types 2020 & 2033
- Table 11: Global Biological Specimen Transport Boxes Revenue undefined Forecast, by Country 2020 & 2033
- Table 12: Global Biological Specimen Transport Boxes Volume K Forecast, by Country 2020 & 2033
- Table 13: United States Biological Specimen Transport Boxes Revenue (undefined) Forecast, by Application 2020 & 2033
- Table 14: United States Biological Specimen Transport Boxes Volume (K) Forecast, by Application 2020 & 2033
- Table 15: Canada Biological Specimen Transport Boxes Revenue (undefined) Forecast, by Application 2020 & 2033
- Table 16: Canada Biological Specimen Transport Boxes Volume (K) Forecast, by Application 2020 & 2033
- Table 17: Mexico Biological Specimen Transport Boxes Revenue (undefined) Forecast, by Application 2020 & 2033
- Table 18: Mexico Biological Specimen Transport Boxes Volume (K) Forecast, by Application 2020 & 2033
- Table 19: Global Biological Specimen Transport Boxes Revenue undefined Forecast, by Application 2020 & 2033
- Table 20: Global Biological Specimen Transport Boxes Volume K Forecast, by Application 2020 & 2033
- Table 21: Global Biological Specimen Transport Boxes Revenue undefined Forecast, by Types 2020 & 2033
- Table 22: Global Biological Specimen Transport Boxes Volume K Forecast, by Types 2020 & 2033
- Table 23: Global Biological Specimen Transport Boxes Revenue undefined Forecast, by Country 2020 & 2033
- Table 24: Global Biological Specimen Transport Boxes Volume K Forecast, by Country 2020 & 2033
- Table 25: Brazil Biological Specimen Transport Boxes Revenue (undefined) Forecast, by Application 2020 & 2033
- Table 26: Brazil Biological Specimen Transport Boxes Volume (K) Forecast, by Application 2020 & 2033
- Table 27: Argentina Biological Specimen Transport Boxes Revenue (undefined) Forecast, by Application 2020 & 2033
- Table 28: Argentina Biological Specimen Transport Boxes Volume (K) Forecast, by Application 2020 & 2033
- Table 29: Rest of South America Biological Specimen Transport Boxes Revenue (undefined) Forecast, by Application 2020 & 2033
- Table 30: Rest of South America Biological Specimen Transport Boxes Volume (K) Forecast, by Application 2020 & 2033
- Table 31: Global Biological Specimen Transport Boxes Revenue undefined Forecast, by Application 2020 & 2033
- Table 32: Global Biological Specimen Transport Boxes Volume K Forecast, by Application 2020 & 2033
- Table 33: Global Biological Specimen Transport Boxes Revenue undefined Forecast, by Types 2020 & 2033
- Table 34: Global Biological Specimen Transport Boxes Volume K Forecast, by Types 2020 & 2033
- Table 35: Global Biological Specimen Transport Boxes Revenue undefined Forecast, by Country 2020 & 2033
- Table 36: Global Biological Specimen Transport Boxes Volume K Forecast, by Country 2020 & 2033
- Table 37: United Kingdom Biological Specimen Transport Boxes Revenue (undefined) Forecast, by Application 2020 & 2033
- Table 38: United Kingdom Biological Specimen Transport Boxes Volume (K) Forecast, by Application 2020 & 2033
- Table 39: Germany Biological Specimen Transport Boxes Revenue (undefined) Forecast, by Application 2020 & 2033
- Table 40: Germany Biological Specimen Transport Boxes Volume (K) Forecast, by Application 2020 & 2033
- Table 41: France Biological Specimen Transport Boxes Revenue (undefined) Forecast, by Application 2020 & 2033
- Table 42: France Biological Specimen Transport Boxes Volume (K) Forecast, by Application 2020 & 2033
- Table 43: Italy Biological Specimen Transport Boxes Revenue (undefined) Forecast, by Application 2020 & 2033
- Table 44: Italy Biological Specimen Transport Boxes Volume (K) Forecast, by Application 2020 & 2033
- Table 45: Spain Biological Specimen Transport Boxes Revenue (undefined) Forecast, by Application 2020 & 2033
- Table 46: Spain Biological Specimen Transport Boxes Volume (K) Forecast, by Application 2020 & 2033
- Table 47: Russia Biological Specimen Transport Boxes Revenue (undefined) Forecast, by Application 2020 & 2033
- Table 48: Russia Biological Specimen Transport Boxes Volume (K) Forecast, by Application 2020 & 2033
- Table 49: Benelux Biological Specimen Transport Boxes Revenue (undefined) Forecast, by Application 2020 & 2033
- Table 50: Benelux Biological Specimen Transport Boxes Volume (K) Forecast, by Application 2020 & 2033
- Table 51: Nordics Biological Specimen Transport Boxes Revenue (undefined) Forecast, by Application 2020 & 2033
- Table 52: Nordics Biological Specimen Transport Boxes Volume (K) Forecast, by Application 2020 & 2033
- Table 53: Rest of Europe Biological Specimen Transport Boxes Revenue (undefined) Forecast, by Application 2020 & 2033
- Table 54: Rest of Europe Biological Specimen Transport Boxes Volume (K) Forecast, by Application 2020 & 2033
- Table 55: Global Biological Specimen Transport Boxes Revenue undefined Forecast, by Application 2020 & 2033
- Table 56: Global Biological Specimen Transport Boxes Volume K Forecast, by Application 2020 & 2033
- Table 57: Global Biological Specimen Transport Boxes Revenue undefined Forecast, by Types 2020 & 2033
- Table 58: Global Biological Specimen Transport Boxes Volume K Forecast, by Types 2020 & 2033
- Table 59: Global Biological Specimen Transport Boxes Revenue undefined Forecast, by Country 2020 & 2033
- Table 60: Global Biological Specimen Transport Boxes Volume K Forecast, by Country 2020 & 2033
- Table 61: Turkey Biological Specimen Transport Boxes Revenue (undefined) Forecast, by Application 2020 & 2033
- Table 62: Turkey Biological Specimen Transport Boxes Volume (K) Forecast, by Application 2020 & 2033
- Table 63: Israel Biological Specimen Transport Boxes Revenue (undefined) Forecast, by Application 2020 & 2033
- Table 64: Israel Biological Specimen Transport Boxes Volume (K) Forecast, by Application 2020 & 2033
- Table 65: GCC Biological Specimen Transport Boxes Revenue (undefined) Forecast, by Application 2020 & 2033
- Table 66: GCC Biological Specimen Transport Boxes Volume (K) Forecast, by Application 2020 & 2033
- Table 67: North Africa Biological Specimen Transport Boxes Revenue (undefined) Forecast, by Application 2020 & 2033
- Table 68: North Africa Biological Specimen Transport Boxes Volume (K) Forecast, by Application 2020 & 2033
- Table 69: South Africa Biological Specimen Transport Boxes Revenue (undefined) Forecast, by Application 2020 & 2033
- Table 70: South Africa Biological Specimen Transport Boxes Volume (K) Forecast, by Application 2020 & 2033
- Table 71: Rest of Middle East & Africa Biological Specimen Transport Boxes Revenue (undefined) Forecast, by Application 2020 & 2033
- Table 72: Rest of Middle East & Africa Biological Specimen Transport Boxes Volume (K) Forecast, by Application 2020 & 2033
- Table 73: Global Biological Specimen Transport Boxes Revenue undefined Forecast, by Application 2020 & 2033
- Table 74: Global Biological Specimen Transport Boxes Volume K Forecast, by Application 2020 & 2033
- Table 75: Global Biological Specimen Transport Boxes Revenue undefined Forecast, by Types 2020 & 2033
- Table 76: Global Biological Specimen Transport Boxes Volume K Forecast, by Types 2020 & 2033
- Table 77: Global Biological Specimen Transport Boxes Revenue undefined Forecast, by Country 2020 & 2033
- Table 78: Global Biological Specimen Transport Boxes Volume K Forecast, by Country 2020 & 2033
- Table 79: China Biological Specimen Transport Boxes Revenue (undefined) Forecast, by Application 2020 & 2033
- Table 80: China Biological Specimen Transport Boxes Volume (K) Forecast, by Application 2020 & 2033
- Table 81: India Biological Specimen Transport Boxes Revenue (undefined) Forecast, by Application 2020 & 2033
- Table 82: India Biological Specimen Transport Boxes Volume (K) Forecast, by Application 2020 & 2033
- Table 83: Japan Biological Specimen Transport Boxes Revenue (undefined) Forecast, by Application 2020 & 2033
- Table 84: Japan Biological Specimen Transport Boxes Volume (K) Forecast, by Application 2020 & 2033
- Table 85: South Korea Biological Specimen Transport Boxes Revenue (undefined) Forecast, by Application 2020 & 2033
- Table 86: South Korea Biological Specimen Transport Boxes Volume (K) Forecast, by Application 2020 & 2033
- Table 87: ASEAN Biological Specimen Transport Boxes Revenue (undefined) Forecast, by Application 2020 & 2033
- Table 88: ASEAN Biological Specimen Transport Boxes Volume (K) Forecast, by Application 2020 & 2033
- Table 89: Oceania Biological Specimen Transport Boxes Revenue (undefined) Forecast, by Application 2020 & 2033
- Table 90: Oceania Biological Specimen Transport Boxes Volume (K) Forecast, by Application 2020 & 2033
- Table 91: Rest of Asia Pacific Biological Specimen Transport Boxes Revenue (undefined) Forecast, by Application 2020 & 2033
- Table 92: Rest of Asia Pacific Biological Specimen Transport Boxes Volume (K) Forecast, by Application 2020 & 2033
Frequently Asked Questions
1. What is the projected Compound Annual Growth Rate (CAGR) of the Biological Specimen Transport Boxes?
The projected CAGR is approximately 6.1%.
2. Which companies are prominent players in the Biological Specimen Transport Boxes?
Key companies in the market include Terumo BCT, Greiner Bio-One, Haier Bio-Medical, Sarstedt, Badu Technology, Thermo Fisher, Fresenius Kabi, Labcold, Heathrow Scientific, Medicus Health, Polar Thermal Packaging, Blowkings, Shenzhen Chunde Technology Co., Ltd., Shandong Sanjiang Medical Technology Co., Ltd..
3. What are the main segments of the Biological Specimen Transport Boxes?
The market segments include Application, Types.
4. Can you provide details about the market size?
The market size is estimated to be USD XXX N/A as of 2022.
5. What are some drivers contributing to market growth?
N/A
6. What are the notable trends driving market growth?
N/A
7. Are there any restraints impacting market growth?
N/A
8. Can you provide examples of recent developments in the market?
N/A
9. What pricing options are available for accessing the report?
Pricing options include single-user, multi-user, and enterprise licenses priced at USD 3950.00, USD 5925.00, and USD 7900.00 respectively.
10. Is the market size provided in terms of value or volume?
The market size is provided in terms of value, measured in N/A and volume, measured in K.
11. Are there any specific market keywords associated with the report?
Yes, the market keyword associated with the report is "Biological Specimen Transport Boxes," which aids in identifying and referencing the specific market segment covered.
12. How do I determine which pricing option suits my needs best?
The pricing options vary based on user requirements and access needs. Individual users may opt for single-user licenses, while businesses requiring broader access may choose multi-user or enterprise licenses for cost-effective access to the report.
13. Are there any additional resources or data provided in the Biological Specimen Transport Boxes report?
While the report offers comprehensive insights, it's advisable to review the specific contents or supplementary materials provided to ascertain if additional resources or data are available.
14. How can I stay updated on further developments or reports in the Biological Specimen Transport Boxes?
To stay informed about further developments, trends, and reports in the Biological Specimen Transport Boxes, consider subscribing to industry newsletters, following relevant companies and organizations, or regularly checking reputable industry news sources and publications.
Methodology
Step 1 - Identification of Relevant Samples Size from Population Database


Step 2 - Approaches for Defining Global Market Size (Value, Volume* & Price*)

Note*: In applicable scenarios
Step 3 - Data Sources
Primary Research
- Web Analytics
- Survey Reports
- Research Institute
- Latest Research Reports
- Opinion Leaders
Secondary Research
- Annual Reports
- White Paper
- Latest Press Release
- Industry Association
- Paid Database
- Investor Presentations

Step 4 - Data Triangulation
Involves using different sources of information in order to increase the validity of a study
These sources are likely to be stakeholders in a program - participants, other researchers, program staff, other community members, and so on.
Then we put all data in single framework & apply various statistical tools to find out the dynamic on the market.
During the analysis stage, feedback from the stakeholder groups would be compared to determine areas of agreement as well as areas of divergence