

Key Insights
The global B2B remittances market is poised for robust expansion, projected to reach an estimated $570 billion in 2025 with a substantial Compound Annual Growth Rate (CAGR) of 5.2% over the forecast period from 2025 to 2033. This significant growth is propelled by an increasing volume of cross-border transactions driven by globalization, the expansion of international trade, and the growing need for efficient payroll and supplier payments for multinational corporations and SMEs alike. The market is witnessing a surge in demand for digital solutions that offer faster, more cost-effective, and transparent remittance services. Key drivers include advancements in fintech, the adoption of cloud-based payment platforms, and regulatory initiatives aimed at streamlining cross-border financial flows. The ease of access provided by online platforms and digital wallets is further democratizing access to these services for businesses of all sizes.
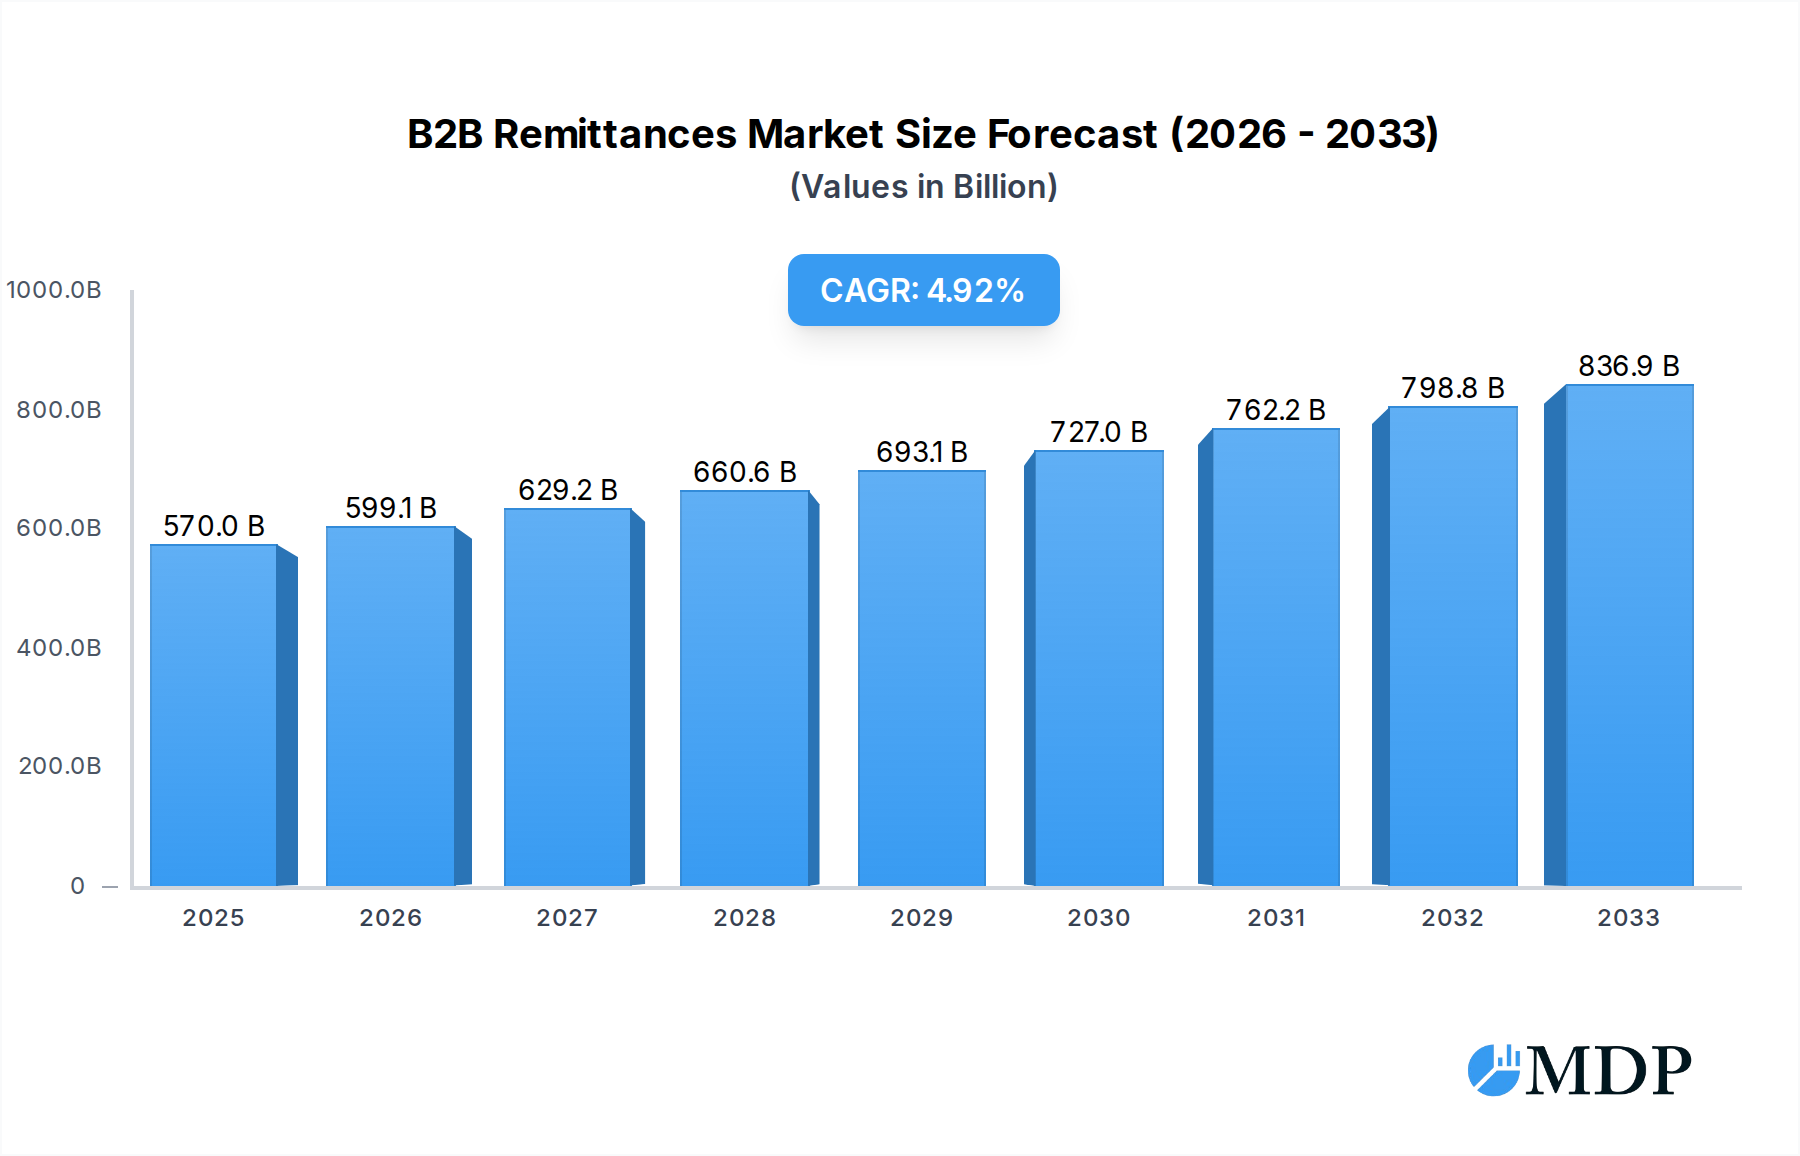
B2B Remittances Market Size (In Billion)
The B2B remittances landscape is characterized by evolving trends that are shaping its trajectory. A significant trend is the increasing integration of B2B payment solutions within broader enterprise resource planning (ERP) and accounting software, offering a seamless user experience. Furthermore, the focus on enhanced security features and compliance with Anti-Money Laundering (AML) and Know Your Customer (KYC) regulations is paramount, driving innovation in secure payment gateways and blockchain-based solutions for improved traceability. While the market benefits from strong growth drivers, it also faces certain restraints. These include the complexity of differing international regulations, currency fluctuations that can impact transaction values, and the persistent threat of cyber fraud. However, the continuous development of sophisticated fraud detection mechanisms and the ongoing efforts by financial institutions and fintech companies to simplify regulatory compliance are expected to mitigate these challenges, paving the way for sustained market growth.

B2B Remittances Company Market Share
B2B Remittances Market Analysis: Dominance, Innovation, and Future Growth (2019-2033)
This comprehensive report delves into the dynamic B2B remittances market, offering an in-depth analysis of its evolution, current landscape, and projected trajectory through 2033. With a study period spanning from 2019 to 2033, a base year of 2025, and a forecast period from 2025 to 2033, this report provides actionable insights for industry stakeholders. We examine key market players, technological advancements, regulatory frameworks, and emerging opportunities, all while focusing on critical segments like Large Corporations and SMEs, and types including Bank Transfers, Money Transfer Operators, and Online Platforms.
B2B Remittances Market Dynamics & Concentration
The B2B remittances market exhibits a moderate concentration, with a blend of established financial institutions and agile fintech innovators vying for market share. Innovation drivers include the relentless pursuit of faster, cheaper, and more transparent cross-border payment solutions, fueled by the increasing globalization of businesses. Regulatory frameworks, while often complex, are also a key dynamic, with evolving compliance requirements shaping market entry and operational strategies. Product substitutes, such as traditional correspondent banking and less digitized methods, continue to lose ground to more efficient digital channels. End-user trends reveal a strong demand for integrated payment solutions that streamline accounts payable and receivable processes, with SMEs increasingly seeking accessible and affordable alternatives to traditional banking. Mergers and acquisitions (M&A) activities are a significant indicator of market consolidation and strategic expansion. For instance, the historical period (2019-2024) saw an estimated xx billion in M&A deal value, with xx significant transactions involving key players looking to enhance their technological capabilities or expand their geographic reach. Market share distribution is evolving, with leading players like Wise and Nium Pte. Ltd. commanding significant portions of the digital B2B remittance space, estimated to be around xx% and xx% respectively in the base year of 2025.
B2B Remittances Industry Trends & Analysis
The B2B remittances industry is experiencing robust growth, projected to continue at a significant Compound Annual Growth Rate (CAGR) of xx% over the forecast period of 2025–2033. This expansion is propelled by several interconnected trends. Firstly, the increasing digitalization of global trade and commerce necessitates efficient and cost-effective cross-border payment solutions. Businesses, from large corporations to SMEs, are actively seeking to reduce transaction fees, improve settlement times, and gain greater visibility into their international payment flows. Technological disruptions are at the forefront, with the adoption of blockchain technology, artificial intelligence (AI) for fraud detection and process automation, and open banking APIs transforming the traditional remittance landscape. These innovations are making B2B remittances more secure, faster, and user-friendly than ever before. Consumer preferences, while often associated with P2P remittances, are indirectly influencing B2B, as businesses now expect a similar level of digital convenience and transparency in their business transactions. The competitive dynamics are intense, with both traditional financial institutions like JP Morgan and Western Union, and newer fintech disruptors such as Ripple and Stripe, innovating at a rapid pace. Market penetration for digital B2B remittance solutions is estimated to reach xx% by 2033, a substantial increase from xx% in 2019, indicating a clear shift away from legacy systems. The rise of embedded finance and BaaS (Banking as a Service) platforms is further accelerating this trend, allowing non-financial companies to integrate payment functionalities directly into their offerings. The focus on regulatory compliance and anti-money laundering (AML) measures is also driving demand for advanced, transparent, and auditable remittance systems.
Leading Markets & Segments in B2B Remittances
The B2B remittances market exhibits strong dominance in certain regions and segments, driven by distinct economic policies and robust infrastructure. North America and Europe currently lead in terms of transaction volume and value, owing to their mature economies and established international trade relationships. Within these regions, the Large Corporation segment represents a significant portion of the market, accounting for an estimated xx% of the total B2B remittance value in 2025. This dominance is attributed to their higher volume of international transactions and their capacity to invest in sophisticated payment solutions. Key drivers for their adoption include the need for reduced operational costs, enhanced treasury management, and seamless integration with enterprise resource planning (ERP) systems.
However, the SME segment is rapidly emerging as a critical growth area, projected to witness a CAGR of xx% between 2025 and 2033. Economic policies that support small business internationalization, coupled with the availability of more accessible and affordable digital platforms, are fueling this surge. Key drivers for SMEs include cost savings, improved cash flow management, and the ease of use offered by online platforms.
In terms of remittance types, Online Platforms are experiencing the most significant growth, projected to capture xx% of the market share by 2033. Their agility, competitive pricing, and user-friendly interfaces are highly attractive to businesses of all sizes. The continuous innovation in user experience and the integration of value-added services like currency hedging and payment reconciliation are further solidifying their position. While Bank Transfers remain a significant player, their market share is gradually being eroded by more specialized digital solutions. Money Transfer Operators are also adapting by enhancing their digital offerings and expanding their B2B services. The Others category, which includes emerging payment methods and custom solutions, is expected to grow as technology evolves.
B2B Remittances Product Developments
Product development in B2B remittances is primarily focused on enhancing speed, reducing costs, and improving security through technological innovation. Companies are actively developing platforms that leverage APIs for seamless integration with existing business systems, enabling real-time payment processing and reconciliation. Innovations include AI-powered fraud detection, blockchain for transparent and immutable transaction records, and advanced analytics for better treasury management. Competitive advantages are being built on offering multi-currency accounts, competitive exchange rates, and flexible payout options. The market is witnessing a trend towards bundled services, combining remittances with supply chain financing and working capital solutions.
Key Drivers of B2B Remittances Growth
Several key factors are propelling the growth of the B2B remittances market. Technological advancements, particularly in digital payment infrastructure, blockchain, and AI, are enabling faster, cheaper, and more secure transactions. The increasing globalization of trade and the rise of e-commerce are creating a continuous demand for efficient cross-border payment solutions. Furthermore, favorable regulatory changes in some regions, aimed at promoting financial inclusion and digital payments, are also contributing to market expansion. The growing recognition of cost savings and operational efficiencies offered by digital remittance platforms is a significant economic driver for businesses of all sizes.
Challenges in the B2B Remittances Market
Despite its growth, the B2B remittances market faces several challenges. Complex and varied regulatory landscapes across different jurisdictions can create compliance hurdles and increase operational costs. Cybersecurity threats and the risk of fraud remain significant concerns, requiring continuous investment in advanced security measures. Intense competition from both traditional financial institutions and agile fintech startups can lead to price wars and margin pressures. Additionally, interoperability issues between different payment systems and a lack of standardization can hinder seamless cross-border transactions. The historical period saw an estimated xx billion in potential losses due to fraudulent activities, underscoring the importance of robust security protocols.
Emerging Opportunities in B2B Remittances
Emerging opportunities in the B2B remittances market are largely driven by technological breakthroughs and strategic market expansion. The continued adoption of blockchain and distributed ledger technology (DLT) promises to further enhance transparency, security, and efficiency in cross-border payments. Strategic partnerships between fintech companies and traditional banks are creating innovative hybrid solutions that leverage the strengths of both. The underserved SME market in emerging economies presents a significant untapped opportunity for growth, as these businesses increasingly seek to engage in international trade. Furthermore, the development of embedded finance solutions and Banking-as-a-Service (BaaS) models offers novel ways to integrate remittance services directly into non-financial platforms, creating new revenue streams and customer touchpoints.
Leading Players in the B2B Remittances Sector
- Azimo
- Digital Wallet Corporation
- MoneyGram
- Nium Pte. Ltd.
- PayPal Holdings Inc
- Remitly Inc.
- Ria Financial
- Ripple
- TransferGo
- Convera
- Western Union
- Wise
- WorldRemit
- American Express
- JP Morgan
- Visa Inc.
- Mastercard
- Stripe
- Paystand
- Grab Inc.
- Gcash
- TrueMoney Co.Ltd
Key Milestones in B2B Remittances Industry
- 2019: Increased adoption of real-time payment systems in North America and Europe.
- 2020: Significant surge in digital remittance volumes due to pandemic-related travel restrictions and e-commerce growth.
- 2021: Major fintech companies secure substantial funding rounds to enhance their B2B remittance offerings.
- 2022: Expansion of open banking initiatives, facilitating API integrations for B2B payment solutions.
- 2023: Introduction of new blockchain-based payment solutions for cross-border B2B transactions.
- 2024: Increased focus on AI-driven fraud detection and compliance tools in the B2B remittance space.
Strategic Outlook for B2B Remittances Market
The strategic outlook for the B2B remittances market remains highly positive, driven by ongoing digital transformation and the increasing interconnectedness of the global economy. Growth accelerators will include the continued development and adoption of blockchain technology, enabling faster and more secure cross-border transactions. Strategic partnerships between fintechs and traditional financial institutions will continue to foster innovation and broaden market reach. There is a significant opportunity for market expansion into emerging economies, catering to the growing needs of SMEs engaging in international trade. The focus on providing integrated financial services beyond simple remittances, such as working capital solutions and supply chain finance, will be crucial for long-term success and competitive advantage.
B2B Remittances Segmentation
-
1. Application
- 1.1. Large Corporation
- 1.2. SMEs
-
2. Types
- 2.1. Bank Transfer
- 2.2. Money Transfer Operators
- 2.3. Online Platforms
- 2.4. Others
B2B Remittances Segmentation By Geography
-
1. North America
- 1.1. United States
- 1.2. Canada
- 1.3. Mexico
-
2. South America
- 2.1. Brazil
- 2.2. Argentina
- 2.3. Rest of South America
-
3. Europe
- 3.1. United Kingdom
- 3.2. Germany
- 3.3. France
- 3.4. Italy
- 3.5. Spain
- 3.6. Russia
- 3.7. Benelux
- 3.8. Nordics
- 3.9. Rest of Europe
-
4. Middle East & Africa
- 4.1. Turkey
- 4.2. Israel
- 4.3. GCC
- 4.4. North Africa
- 4.5. South Africa
- 4.6. Rest of Middle East & Africa
-
5. Asia Pacific
- 5.1. China
- 5.2. India
- 5.3. Japan
- 5.4. South Korea
- 5.5. ASEAN
- 5.6. Oceania
- 5.7. Rest of Asia Pacific
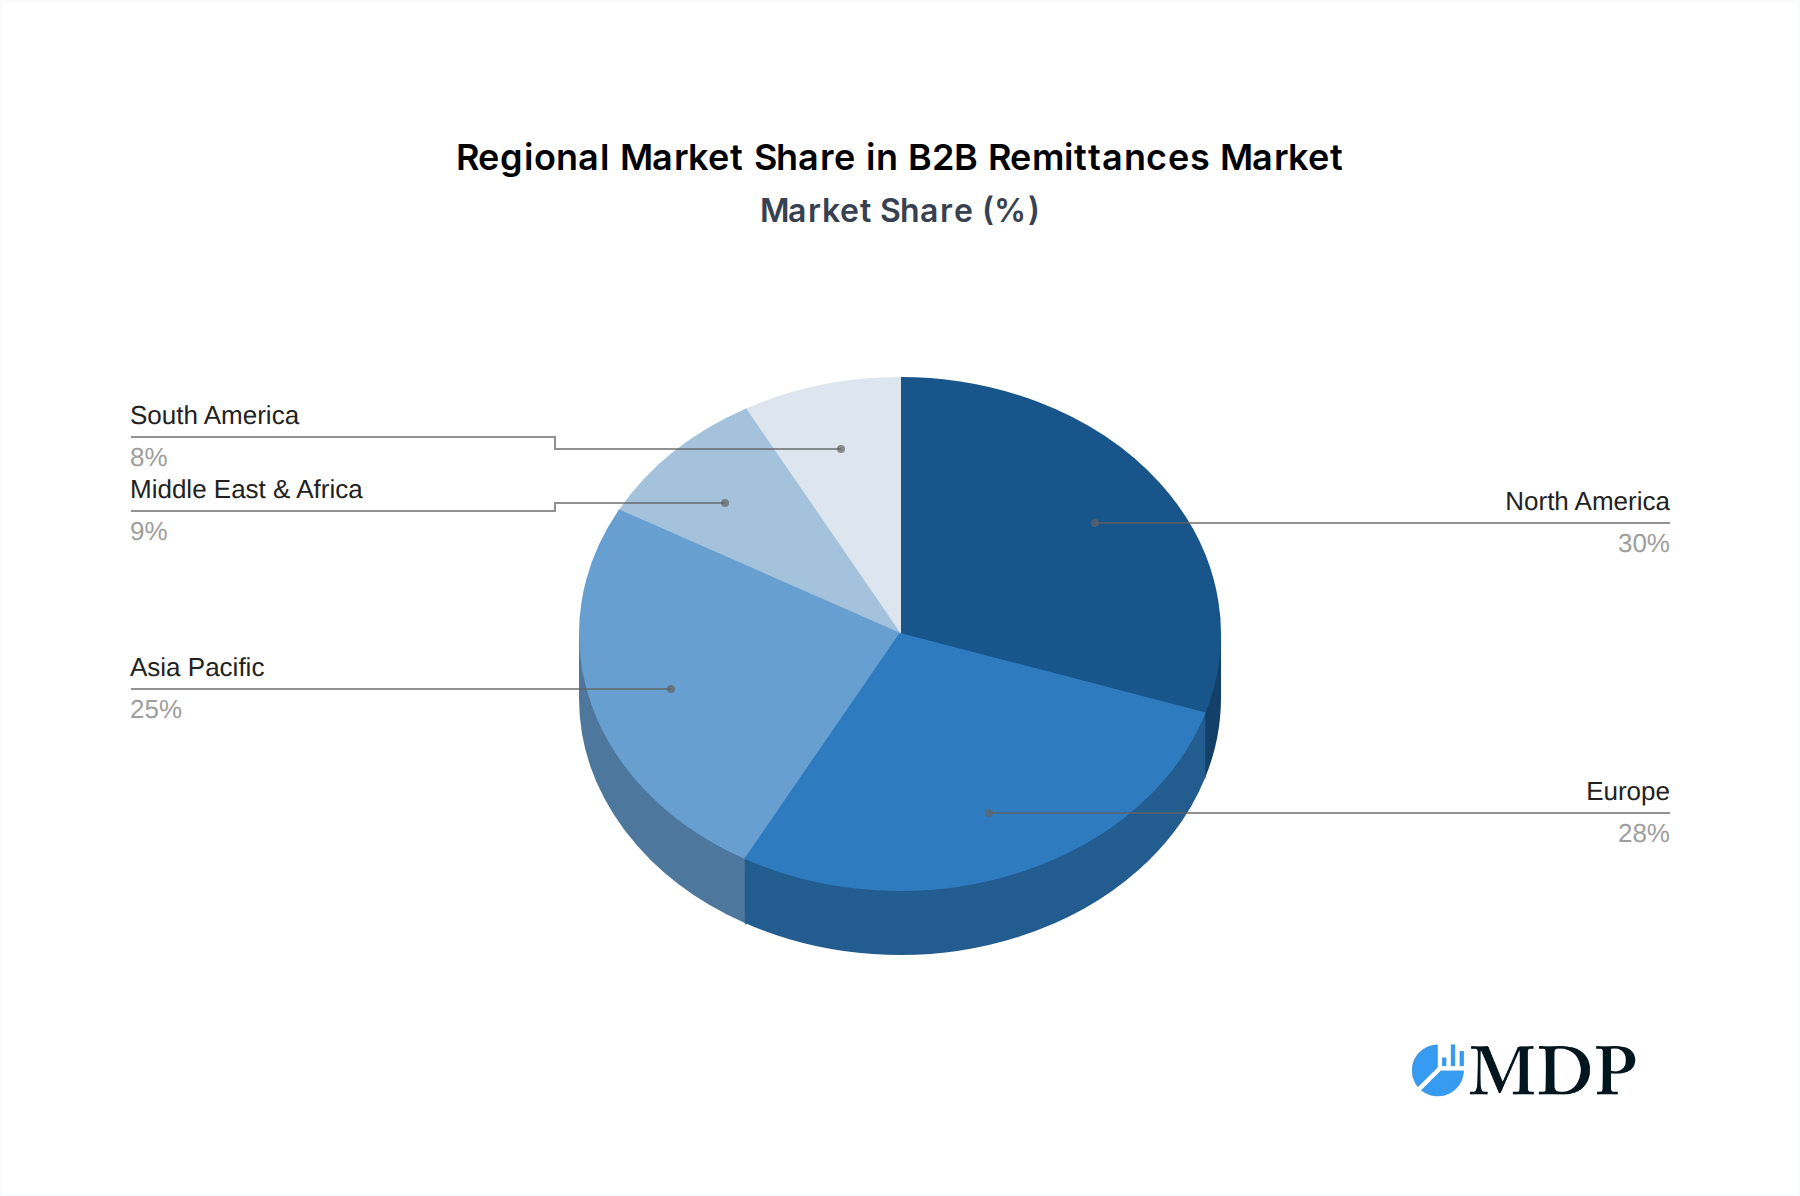
B2B Remittances Regional Market Share
Geographic Coverage of B2B Remittances
B2B Remittances REPORT HIGHLIGHTS
| Aspects | Details |
|---|---|
| Study Period | 2020-2034 |
| Base Year | 2025 |
| Estimated Year | 2026 |
| Forecast Period | 2026-2034 |
| Historical Period | 2020-2025 |
| Growth Rate | CAGR of 5.2% from 2020-2034 |
| Segmentation |
|
Table of Contents
- 1. Introduction
- 1.1. Research Scope
- 1.2. Market Segmentation
- 1.3. Research Methodology
- 1.4. Definitions and Assumptions
- 2. Executive Summary
- 2.1. Introduction
- 3. Market Dynamics
- 3.1. Introduction
- 3.2. Market Drivers
- 3.3. Market Restrains
- 3.4. Market Trends
- 4. Market Factor Analysis
- 4.1. Porters Five Forces
- 4.2. Supply/Value Chain
- 4.3. PESTEL analysis
- 4.4. Market Entropy
- 4.5. Patent/Trademark Analysis
- 5. Global B2B Remittances Analysis, Insights and Forecast, 2020-2032
- 5.1. Market Analysis, Insights and Forecast - by Application
- 5.1.1. Large Corporation
- 5.1.2. SMEs
- 5.2. Market Analysis, Insights and Forecast - by Types
- 5.2.1. Bank Transfer
- 5.2.2. Money Transfer Operators
- 5.2.3. Online Platforms
- 5.2.4. Others
- 5.3. Market Analysis, Insights and Forecast - by Region
- 5.3.1. North America
- 5.3.2. South America
- 5.3.3. Europe
- 5.3.4. Middle East & Africa
- 5.3.5. Asia Pacific
- 5.1. Market Analysis, Insights and Forecast - by Application
- 6. North America B2B Remittances Analysis, Insights and Forecast, 2020-2032
- 6.1. Market Analysis, Insights and Forecast - by Application
- 6.1.1. Large Corporation
- 6.1.2. SMEs
- 6.2. Market Analysis, Insights and Forecast - by Types
- 6.2.1. Bank Transfer
- 6.2.2. Money Transfer Operators
- 6.2.3. Online Platforms
- 6.2.4. Others
- 6.1. Market Analysis, Insights and Forecast - by Application
- 7. South America B2B Remittances Analysis, Insights and Forecast, 2020-2032
- 7.1. Market Analysis, Insights and Forecast - by Application
- 7.1.1. Large Corporation
- 7.1.2. SMEs
- 7.2. Market Analysis, Insights and Forecast - by Types
- 7.2.1. Bank Transfer
- 7.2.2. Money Transfer Operators
- 7.2.3. Online Platforms
- 7.2.4. Others
- 7.1. Market Analysis, Insights and Forecast - by Application
- 8. Europe B2B Remittances Analysis, Insights and Forecast, 2020-2032
- 8.1. Market Analysis, Insights and Forecast - by Application
- 8.1.1. Large Corporation
- 8.1.2. SMEs
- 8.2. Market Analysis, Insights and Forecast - by Types
- 8.2.1. Bank Transfer
- 8.2.2. Money Transfer Operators
- 8.2.3. Online Platforms
- 8.2.4. Others
- 8.1. Market Analysis, Insights and Forecast - by Application
- 9. Middle East & Africa B2B Remittances Analysis, Insights and Forecast, 2020-2032
- 9.1. Market Analysis, Insights and Forecast - by Application
- 9.1.1. Large Corporation
- 9.1.2. SMEs
- 9.2. Market Analysis, Insights and Forecast - by Types
- 9.2.1. Bank Transfer
- 9.2.2. Money Transfer Operators
- 9.2.3. Online Platforms
- 9.2.4. Others
- 9.1. Market Analysis, Insights and Forecast - by Application
- 10. Asia Pacific B2B Remittances Analysis, Insights and Forecast, 2020-2032
- 10.1. Market Analysis, Insights and Forecast - by Application
- 10.1.1. Large Corporation
- 10.1.2. SMEs
- 10.2. Market Analysis, Insights and Forecast - by Types
- 10.2.1. Bank Transfer
- 10.2.2. Money Transfer Operators
- 10.2.3. Online Platforms
- 10.2.4. Others
- 10.1. Market Analysis, Insights and Forecast - by Application
- 11. Competitive Analysis
- 11.1. Global Market Share Analysis 2025
- 11.2. Company Profiles
- 11.2.1 Azimo
- 11.2.1.1. Overview
- 11.2.1.2. Products
- 11.2.1.3. SWOT Analysis
- 11.2.1.4. Recent Developments
- 11.2.1.5. Financials (Based on Availability)
- 11.2.2 Digital Wallet Corporation
- 11.2.2.1. Overview
- 11.2.2.2. Products
- 11.2.2.3. SWOT Analysis
- 11.2.2.4. Recent Developments
- 11.2.2.5. Financials (Based on Availability)
- 11.2.3 MoneyGram
- 11.2.3.1. Overview
- 11.2.3.2. Products
- 11.2.3.3. SWOT Analysis
- 11.2.3.4. Recent Developments
- 11.2.3.5. Financials (Based on Availability)
- 11.2.4 Nium Pte. Ltd.
- 11.2.4.1. Overview
- 11.2.4.2. Products
- 11.2.4.3. SWOT Analysis
- 11.2.4.4. Recent Developments
- 11.2.4.5. Financials (Based on Availability)
- 11.2.5 PayPal Holdings Inc
- 11.2.5.1. Overview
- 11.2.5.2. Products
- 11.2.5.3. SWOT Analysis
- 11.2.5.4. Recent Developments
- 11.2.5.5. Financials (Based on Availability)
- 11.2.6 Remitly Inc.
- 11.2.6.1. Overview
- 11.2.6.2. Products
- 11.2.6.3. SWOT Analysis
- 11.2.6.4. Recent Developments
- 11.2.6.5. Financials (Based on Availability)
- 11.2.7 Ria Financial
- 11.2.7.1. Overview
- 11.2.7.2. Products
- 11.2.7.3. SWOT Analysis
- 11.2.7.4. Recent Developments
- 11.2.7.5. Financials (Based on Availability)
- 11.2.8 Ripple
- 11.2.8.1. Overview
- 11.2.8.2. Products
- 11.2.8.3. SWOT Analysis
- 11.2.8.4. Recent Developments
- 11.2.8.5. Financials (Based on Availability)
- 11.2.9 TransferGo
- 11.2.9.1. Overview
- 11.2.9.2. Products
- 11.2.9.3. SWOT Analysis
- 11.2.9.4. Recent Developments
- 11.2.9.5. Financials (Based on Availability)
- 11.2.10 Convera
- 11.2.10.1. Overview
- 11.2.10.2. Products
- 11.2.10.3. SWOT Analysis
- 11.2.10.4. Recent Developments
- 11.2.10.5. Financials (Based on Availability)
- 11.2.11 Western Union
- 11.2.11.1. Overview
- 11.2.11.2. Products
- 11.2.11.3. SWOT Analysis
- 11.2.11.4. Recent Developments
- 11.2.11.5. Financials (Based on Availability)
- 11.2.12 Wise
- 11.2.12.1. Overview
- 11.2.12.2. Products
- 11.2.12.3. SWOT Analysis
- 11.2.12.4. Recent Developments
- 11.2.12.5. Financials (Based on Availability)
- 11.2.13 WorldRemit
- 11.2.13.1. Overview
- 11.2.13.2. Products
- 11.2.13.3. SWOT Analysis
- 11.2.13.4. Recent Developments
- 11.2.13.5. Financials (Based on Availability)
- 11.2.14 American Express
- 11.2.14.1. Overview
- 11.2.14.2. Products
- 11.2.14.3. SWOT Analysis
- 11.2.14.4. Recent Developments
- 11.2.14.5. Financials (Based on Availability)
- 11.2.15 JP Morgan
- 11.2.15.1. Overview
- 11.2.15.2. Products
- 11.2.15.3. SWOT Analysis
- 11.2.15.4. Recent Developments
- 11.2.15.5. Financials (Based on Availability)
- 11.2.16 Visa Inc.
- 11.2.16.1. Overview
- 11.2.16.2. Products
- 11.2.16.3. SWOT Analysis
- 11.2.16.4. Recent Developments
- 11.2.16.5. Financials (Based on Availability)
- 11.2.17 Mastercard
- 11.2.17.1. Overview
- 11.2.17.2. Products
- 11.2.17.3. SWOT Analysis
- 11.2.17.4. Recent Developments
- 11.2.17.5. Financials (Based on Availability)
- 11.2.18 Stripe
- 11.2.18.1. Overview
- 11.2.18.2. Products
- 11.2.18.3. SWOT Analysis
- 11.2.18.4. Recent Developments
- 11.2.18.5. Financials (Based on Availability)
- 11.2.19 Paystand
- 11.2.19.1. Overview
- 11.2.19.2. Products
- 11.2.19.3. SWOT Analysis
- 11.2.19.4. Recent Developments
- 11.2.19.5. Financials (Based on Availability)
- 11.2.20 Grab Inc.
- 11.2.20.1. Overview
- 11.2.20.2. Products
- 11.2.20.3. SWOT Analysis
- 11.2.20.4. Recent Developments
- 11.2.20.5. Financials (Based on Availability)
- 11.2.21 Gcash
- 11.2.21.1. Overview
- 11.2.21.2. Products
- 11.2.21.3. SWOT Analysis
- 11.2.21.4. Recent Developments
- 11.2.21.5. Financials (Based on Availability)
- 11.2.22 TrueMoney Co.Ltd
- 11.2.22.1. Overview
- 11.2.22.2. Products
- 11.2.22.3. SWOT Analysis
- 11.2.22.4. Recent Developments
- 11.2.22.5. Financials (Based on Availability)
- 11.2.1 Azimo
List of Figures
- Figure 1: Global B2B Remittances Revenue Breakdown (undefined, %) by Region 2025 & 2033
- Figure 2: North America B2B Remittances Revenue (undefined), by Application 2025 & 2033
- Figure 3: North America B2B Remittances Revenue Share (%), by Application 2025 & 2033
- Figure 4: North America B2B Remittances Revenue (undefined), by Types 2025 & 2033
- Figure 5: North America B2B Remittances Revenue Share (%), by Types 2025 & 2033
- Figure 6: North America B2B Remittances Revenue (undefined), by Country 2025 & 2033
- Figure 7: North America B2B Remittances Revenue Share (%), by Country 2025 & 2033
- Figure 8: South America B2B Remittances Revenue (undefined), by Application 2025 & 2033
- Figure 9: South America B2B Remittances Revenue Share (%), by Application 2025 & 2033
- Figure 10: South America B2B Remittances Revenue (undefined), by Types 2025 & 2033
- Figure 11: South America B2B Remittances Revenue Share (%), by Types 2025 & 2033
- Figure 12: South America B2B Remittances Revenue (undefined), by Country 2025 & 2033
- Figure 13: South America B2B Remittances Revenue Share (%), by Country 2025 & 2033
- Figure 14: Europe B2B Remittances Revenue (undefined), by Application 2025 & 2033
- Figure 15: Europe B2B Remittances Revenue Share (%), by Application 2025 & 2033
- Figure 16: Europe B2B Remittances Revenue (undefined), by Types 2025 & 2033
- Figure 17: Europe B2B Remittances Revenue Share (%), by Types 2025 & 2033
- Figure 18: Europe B2B Remittances Revenue (undefined), by Country 2025 & 2033
- Figure 19: Europe B2B Remittances Revenue Share (%), by Country 2025 & 2033
- Figure 20: Middle East & Africa B2B Remittances Revenue (undefined), by Application 2025 & 2033
- Figure 21: Middle East & Africa B2B Remittances Revenue Share (%), by Application 2025 & 2033
- Figure 22: Middle East & Africa B2B Remittances Revenue (undefined), by Types 2025 & 2033
- Figure 23: Middle East & Africa B2B Remittances Revenue Share (%), by Types 2025 & 2033
- Figure 24: Middle East & Africa B2B Remittances Revenue (undefined), by Country 2025 & 2033
- Figure 25: Middle East & Africa B2B Remittances Revenue Share (%), by Country 2025 & 2033
- Figure 26: Asia Pacific B2B Remittances Revenue (undefined), by Application 2025 & 2033
- Figure 27: Asia Pacific B2B Remittances Revenue Share (%), by Application 2025 & 2033
- Figure 28: Asia Pacific B2B Remittances Revenue (undefined), by Types 2025 & 2033
- Figure 29: Asia Pacific B2B Remittances Revenue Share (%), by Types 2025 & 2033
- Figure 30: Asia Pacific B2B Remittances Revenue (undefined), by Country 2025 & 2033
- Figure 31: Asia Pacific B2B Remittances Revenue Share (%), by Country 2025 & 2033
List of Tables
- Table 1: Global B2B Remittances Revenue undefined Forecast, by Application 2020 & 2033
- Table 2: Global B2B Remittances Revenue undefined Forecast, by Types 2020 & 2033
- Table 3: Global B2B Remittances Revenue undefined Forecast, by Region 2020 & 2033
- Table 4: Global B2B Remittances Revenue undefined Forecast, by Application 2020 & 2033
- Table 5: Global B2B Remittances Revenue undefined Forecast, by Types 2020 & 2033
- Table 6: Global B2B Remittances Revenue undefined Forecast, by Country 2020 & 2033
- Table 7: United States B2B Remittances Revenue (undefined) Forecast, by Application 2020 & 2033
- Table 8: Canada B2B Remittances Revenue (undefined) Forecast, by Application 2020 & 2033
- Table 9: Mexico B2B Remittances Revenue (undefined) Forecast, by Application 2020 & 2033
- Table 10: Global B2B Remittances Revenue undefined Forecast, by Application 2020 & 2033
- Table 11: Global B2B Remittances Revenue undefined Forecast, by Types 2020 & 2033
- Table 12: Global B2B Remittances Revenue undefined Forecast, by Country 2020 & 2033
- Table 13: Brazil B2B Remittances Revenue (undefined) Forecast, by Application 2020 & 2033
- Table 14: Argentina B2B Remittances Revenue (undefined) Forecast, by Application 2020 & 2033
- Table 15: Rest of South America B2B Remittances Revenue (undefined) Forecast, by Application 2020 & 2033
- Table 16: Global B2B Remittances Revenue undefined Forecast, by Application 2020 & 2033
- Table 17: Global B2B Remittances Revenue undefined Forecast, by Types 2020 & 2033
- Table 18: Global B2B Remittances Revenue undefined Forecast, by Country 2020 & 2033
- Table 19: United Kingdom B2B Remittances Revenue (undefined) Forecast, by Application 2020 & 2033
- Table 20: Germany B2B Remittances Revenue (undefined) Forecast, by Application 2020 & 2033
- Table 21: France B2B Remittances Revenue (undefined) Forecast, by Application 2020 & 2033
- Table 22: Italy B2B Remittances Revenue (undefined) Forecast, by Application 2020 & 2033
- Table 23: Spain B2B Remittances Revenue (undefined) Forecast, by Application 2020 & 2033
- Table 24: Russia B2B Remittances Revenue (undefined) Forecast, by Application 2020 & 2033
- Table 25: Benelux B2B Remittances Revenue (undefined) Forecast, by Application 2020 & 2033
- Table 26: Nordics B2B Remittances Revenue (undefined) Forecast, by Application 2020 & 2033
- Table 27: Rest of Europe B2B Remittances Revenue (undefined) Forecast, by Application 2020 & 2033
- Table 28: Global B2B Remittances Revenue undefined Forecast, by Application 2020 & 2033
- Table 29: Global B2B Remittances Revenue undefined Forecast, by Types 2020 & 2033
- Table 30: Global B2B Remittances Revenue undefined Forecast, by Country 2020 & 2033
- Table 31: Turkey B2B Remittances Revenue (undefined) Forecast, by Application 2020 & 2033
- Table 32: Israel B2B Remittances Revenue (undefined) Forecast, by Application 2020 & 2033
- Table 33: GCC B2B Remittances Revenue (undefined) Forecast, by Application 2020 & 2033
- Table 34: North Africa B2B Remittances Revenue (undefined) Forecast, by Application 2020 & 2033
- Table 35: South Africa B2B Remittances Revenue (undefined) Forecast, by Application 2020 & 2033
- Table 36: Rest of Middle East & Africa B2B Remittances Revenue (undefined) Forecast, by Application 2020 & 2033
- Table 37: Global B2B Remittances Revenue undefined Forecast, by Application 2020 & 2033
- Table 38: Global B2B Remittances Revenue undefined Forecast, by Types 2020 & 2033
- Table 39: Global B2B Remittances Revenue undefined Forecast, by Country 2020 & 2033
- Table 40: China B2B Remittances Revenue (undefined) Forecast, by Application 2020 & 2033
- Table 41: India B2B Remittances Revenue (undefined) Forecast, by Application 2020 & 2033
- Table 42: Japan B2B Remittances Revenue (undefined) Forecast, by Application 2020 & 2033
- Table 43: South Korea B2B Remittances Revenue (undefined) Forecast, by Application 2020 & 2033
- Table 44: ASEAN B2B Remittances Revenue (undefined) Forecast, by Application 2020 & 2033
- Table 45: Oceania B2B Remittances Revenue (undefined) Forecast, by Application 2020 & 2033
- Table 46: Rest of Asia Pacific B2B Remittances Revenue (undefined) Forecast, by Application 2020 & 2033
Frequently Asked Questions
1. What is the projected Compound Annual Growth Rate (CAGR) of the B2B Remittances?
The projected CAGR is approximately 5.2%.
2. Which companies are prominent players in the B2B Remittances?
Key companies in the market include Azimo, Digital Wallet Corporation, MoneyGram, Nium Pte. Ltd., PayPal Holdings Inc, Remitly Inc., Ria Financial, Ripple, TransferGo, Convera, Western Union, Wise, WorldRemit, American Express, JP Morgan, Visa Inc., Mastercard, Stripe, Paystand, Grab Inc., Gcash, TrueMoney Co.Ltd.
3. What are the main segments of the B2B Remittances?
The market segments include Application, Types.
4. Can you provide details about the market size?
The market size is estimated to be USD XXX N/A as of 2022.
5. What are some drivers contributing to market growth?
N/A
6. What are the notable trends driving market growth?
N/A
7. Are there any restraints impacting market growth?
N/A
8. Can you provide examples of recent developments in the market?
N/A
9. What pricing options are available for accessing the report?
Pricing options include single-user, multi-user, and enterprise licenses priced at USD 3350.00, USD 5025.00, and USD 6700.00 respectively.
10. Is the market size provided in terms of value or volume?
The market size is provided in terms of value, measured in N/A.
11. Are there any specific market keywords associated with the report?
Yes, the market keyword associated with the report is "B2B Remittances," which aids in identifying and referencing the specific market segment covered.
12. How do I determine which pricing option suits my needs best?
The pricing options vary based on user requirements and access needs. Individual users may opt for single-user licenses, while businesses requiring broader access may choose multi-user or enterprise licenses for cost-effective access to the report.
13. Are there any additional resources or data provided in the B2B Remittances report?
While the report offers comprehensive insights, it's advisable to review the specific contents or supplementary materials provided to ascertain if additional resources or data are available.
14. How can I stay updated on further developments or reports in the B2B Remittances?
To stay informed about further developments, trends, and reports in the B2B Remittances, consider subscribing to industry newsletters, following relevant companies and organizations, or regularly checking reputable industry news sources and publications.
Methodology
Step 1 - Identification of Relevant Samples Size from Population Database


Step 2 - Approaches for Defining Global Market Size (Value, Volume* & Price*)

Note*: In applicable scenarios
Step 3 - Data Sources
Primary Research
- Web Analytics
- Survey Reports
- Research Institute
- Latest Research Reports
- Opinion Leaders
Secondary Research
- Annual Reports
- White Paper
- Latest Press Release
- Industry Association
- Paid Database
- Investor Presentations

Step 4 - Data Triangulation
Involves using different sources of information in order to increase the validity of a study
These sources are likely to be stakeholders in a program - participants, other researchers, program staff, other community members, and so on.
Then we put all data in single framework & apply various statistical tools to find out the dynamic on the market.
During the analysis stage, feedback from the stakeholder groups would be compared to determine areas of agreement as well as areas of divergence