

Key Insights
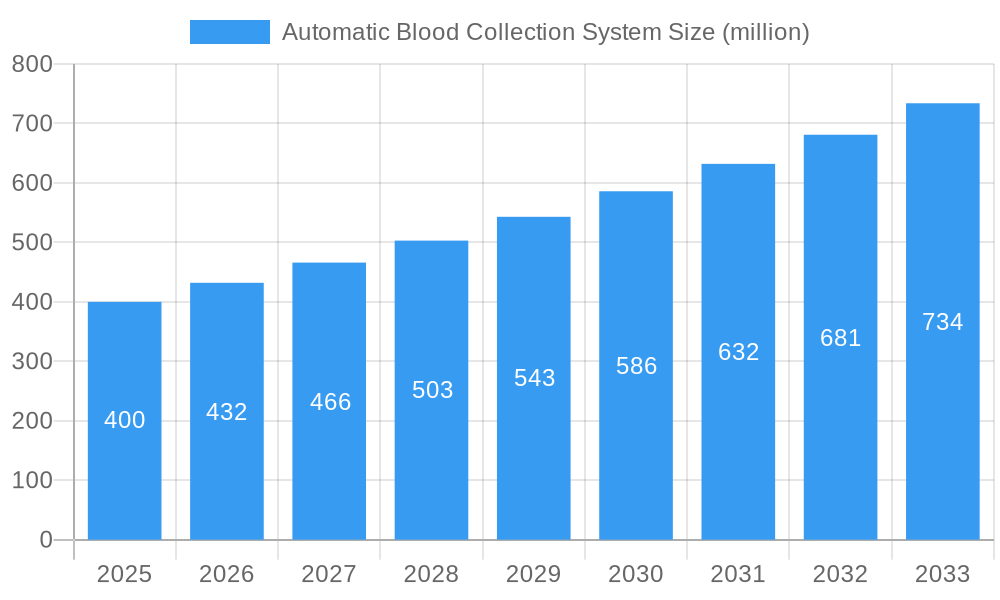
The global automatic blood collection system market is poised for substantial expansion, propelled by increasing healthcare automation, a growing burden of chronic diseases necessitating frequent diagnostics, and a heightened demand for streamlined, standardized blood collection protocols. Advancements in technology are further accelerating this growth, leading to enhanced accuracy, reduced processing times, and improved patient safety. The market is projected to reach $2.15 billion by 2025, with an estimated compound annual growth rate (CAGR) of 7.5%. This upward trend is expected to persist through the forecast period, with significant contributions anticipated from emerging economies in Asia-Pacific and Latin America as healthcare infrastructure develops and the adoption of sophisticated technologies increases.
Automatic Blood Collection System Market Size (In Billion)
However, market expansion is tempered by certain challenges. The substantial upfront investment required for automatic blood collection systems may pose a barrier for smaller healthcare facilities. Additionally, navigating regulatory landscapes and ensuring the availability of skilled personnel for operation and maintenance could influence market penetration in specific geographies. The market is segmented by product type, including fully automated and semi-automated systems; by end-user, such as hospitals, diagnostic laboratories, and blood banks; and by region. Leading market participants, including RWD, Terumo, Basi, Instech, OMEGA, Verutech, Eastern Group, and Winnoz, are prioritizing product innovation, strategic collaborations, and global market reach to solidify their competitive positions and capitalize on escalating demand. Ongoing technological innovations, such as seamless integration with Laboratory Information Systems (LIS) and advanced data analytics, will continue to redefine the automatic blood collection system landscape, fostering continued market development.
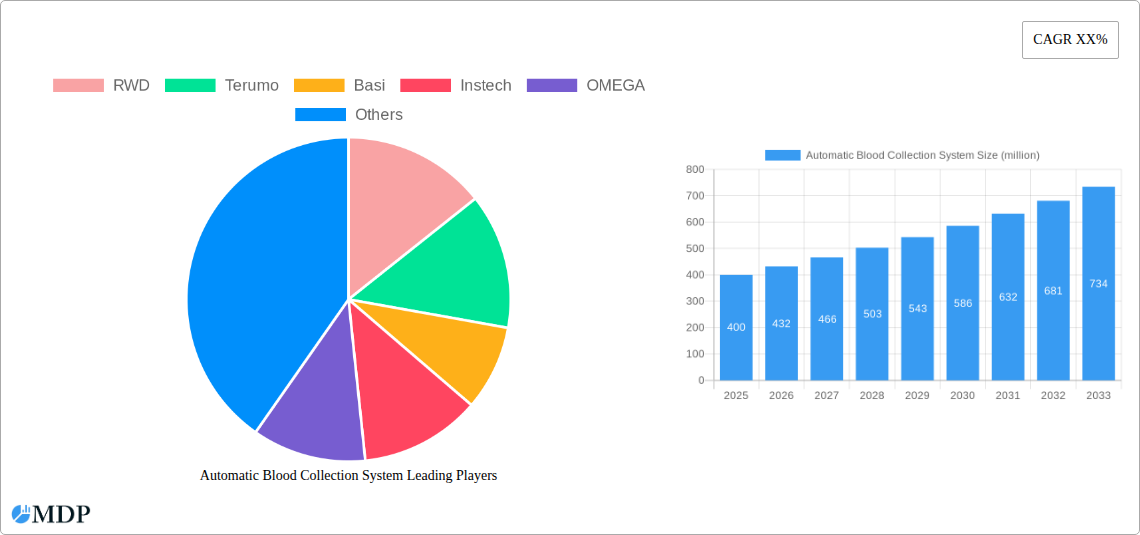
Automatic Blood Collection System Company Market Share
Automatic Blood Collection System Market Report: 2019-2033
This comprehensive report provides an in-depth analysis of the global Automatic Blood Collection System market, offering invaluable insights for stakeholders across the healthcare and medical technology sectors. Covering the period from 2019 to 2033, with a focus on 2025, this report analyzes market dynamics, industry trends, leading players, and future growth opportunities. The market is projected to reach millions of dollars by 2033, presenting significant investment potential.
Automatic Blood Collection System Market Dynamics & Concentration
The global Automatic Blood Collection System market exhibits a moderately consolidated structure, with key players like RWD, Terumo, Basi, Instech, OMEGA, Verutech, Eastern Group, and Winnoz holding significant market share. Market concentration is influenced by factors such as technological innovation, stringent regulatory frameworks (e.g., FDA approvals), and the presence of substitute technologies. End-user trends, particularly the increasing demand for efficient and accurate blood collection in hospitals and diagnostic labs, are significant drivers. Mergers and acquisitions (M&A) activities have played a role in shaping the market landscape, with an estimated xx M&A deals recorded between 2019 and 2024. While precise market share figures for each company are proprietary, RWD and Terumo are estimated to be among the leading players, collectively holding an estimated xx% market share in 2025. The market is characterized by ongoing innovation, with companies continuously striving to improve the accuracy, speed, and safety of their systems.
- Market Concentration: Moderately consolidated.
- Innovation Drivers: Automation, miniaturization, improved accuracy.
- Regulatory Frameworks: Stringent approvals (FDA, etc.).
- Product Substitutes: Manual blood collection methods.
- End-User Trends: Increasing demand from hospitals and diagnostic labs.
- M&A Activity: xx deals between 2019-2024.
Automatic Blood Collection System Industry Trends & Analysis
The Automatic Blood Collection System market is experiencing robust growth, driven by a number of factors. Technological advancements, such as the integration of AI and robotics for improved precision and efficiency, are significantly impacting the market. Consumer preferences are shifting towards automated systems due to their enhanced speed, accuracy, and reduced risk of human error. The market is characterized by intense competition among established players and emerging entrants. The global market is projected to register a CAGR of xx% during the forecast period (2025-2033), driven by increasing prevalence of chronic diseases requiring frequent blood tests, rising healthcare expenditure, and expanding healthcare infrastructure, especially in developing economies. Market penetration is expected to increase from xx% in 2025 to xx% by 2033.
Leading Markets & Segments in Automatic Blood Collection System
North America currently dominates the Automatic Blood Collection System market, driven by factors such as advanced healthcare infrastructure, high adoption rates of advanced technologies, and robust regulatory support.
- Key Drivers in North America:
- Advanced healthcare infrastructure.
- High adoption rates of advanced technologies.
- Strong regulatory support (FDA).
- High healthcare expenditure.
Europe and Asia-Pacific are also experiencing significant growth, although at a slightly slower pace compared to North America. The market is segmented by product type (e.g., fully automated systems, semi-automated systems), application (e.g., hospitals, diagnostic labs), and end-user (e.g., hospitals, clinics, research centers). The fully automated segment holds the largest market share due to its efficiency and reduced risk of errors.
Automatic Blood Collection System Product Developments
Recent advancements in Automatic Blood Collection Systems include the incorporation of advanced sensors for improved accuracy, miniaturized devices for easier handling and portability, and integrated data management systems for efficient record-keeping. These innovations address key market needs by increasing efficiency, reducing errors, and improving overall patient care. The integration of artificial intelligence and machine learning algorithms is also gaining traction, promising further improvements in accuracy and automation. The market is seeing a growing focus on systems that offer enhanced safety features, minimizing the risk of needle-stick injuries and other hazards.
Key Drivers of Automatic Blood Collection System Growth
The Automatic Blood Collection System market is propelled by several key growth drivers. Technological advancements leading to increased efficiency and accuracy are a major factor. The rising prevalence of chronic diseases necessitates frequent blood testing, boosting demand. Increasing healthcare expenditure globally and expanding healthcare infrastructure in emerging markets also contribute to market expansion. Favorable regulatory environments and government initiatives promoting technological adoption further enhance market growth.
Challenges in the Automatic Blood Collection System Market
Despite its significant growth potential, the Automatic Blood Collection System market faces several challenges. High initial investment costs can hinder adoption, especially in resource-constrained settings. Stringent regulatory approvals and compliance requirements add complexity and increase time to market. Competition from established players and emerging entrants creates pressure on pricing and margins. Supply chain disruptions can also impact the availability and affordability of systems.
Emerging Opportunities in Automatic Blood Collection System
The future of the Automatic Blood Collection System market holds promising opportunities. Technological breakthroughs in areas like AI-powered diagnostics and point-of-care testing will drive innovation. Strategic partnerships between manufacturers and healthcare providers can enhance market penetration and access. Expansion into underserved markets, particularly in developing countries, presents significant untapped potential for growth.
Leading Players in the Automatic Blood Collection System Sector
- RWD
- Terumo
- Basi
- Instech
- OMEGA
- Verutech
- Eastern Group
- Winnoz
Key Milestones in Automatic Blood Collection System Industry
- 2020: Launch of a new fully automated system by RWD incorporating AI-powered error detection.
- 2022: Acquisition of a smaller competitor by Terumo, expanding its market share.
- 2023: FDA approval of a novel blood collection technology by Instech.
- 2024: Launch of a portable, battery-operated system by Basi targeting remote healthcare settings.
Strategic Outlook for Automatic Blood Collection System Market
The Automatic Blood Collection System market is poised for continued robust growth, driven by technological innovation, increasing healthcare expenditure, and expanding global healthcare infrastructure. Strategic opportunities lie in developing cost-effective, portable, and user-friendly systems to cater to a wider range of healthcare settings. Focus on integration with existing laboratory information management systems (LIMS) and electronic health records (EHRs) will further enhance market appeal. Companies that invest in research and development, strategic partnerships, and global market expansion will be best positioned to capitalize on the significant growth potential of this market.
Automatic Blood Collection System Segmentation
-
1. Application
- 1.1. Hospital
- 1.2. Clinic
- 1.3. Others
-
2. Types
- 2.1. Fingertip Blood Collection System
- 2.2. Venous Blood Collection System
Automatic Blood Collection System Segmentation By Geography
-
1. North America
- 1.1. United States
- 1.2. Canada
- 1.3. Mexico
-
2. South America
- 2.1. Brazil
- 2.2. Argentina
- 2.3. Rest of South America
-
3. Europe
- 3.1. United Kingdom
- 3.2. Germany
- 3.3. France
- 3.4. Italy
- 3.5. Spain
- 3.6. Russia
- 3.7. Benelux
- 3.8. Nordics
- 3.9. Rest of Europe
-
4. Middle East & Africa
- 4.1. Turkey
- 4.2. Israel
- 4.3. GCC
- 4.4. North Africa
- 4.5. South Africa
- 4.6. Rest of Middle East & Africa
-
5. Asia Pacific
- 5.1. China
- 5.2. India
- 5.3. Japan
- 5.4. South Korea
- 5.5. ASEAN
- 5.6. Oceania
- 5.7. Rest of Asia Pacific
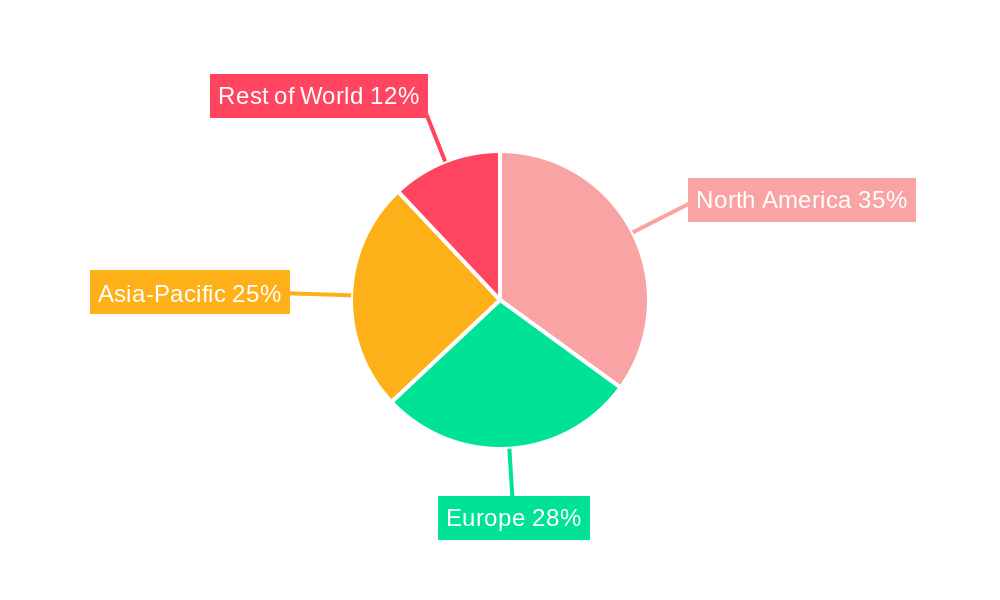
Automatic Blood Collection System Regional Market Share
Geographic Coverage of Automatic Blood Collection System
Automatic Blood Collection System REPORT HIGHLIGHTS
| Aspects | Details |
|---|---|
| Study Period | 2020-2034 |
| Base Year | 2025 |
| Estimated Year | 2026 |
| Forecast Period | 2026-2034 |
| Historical Period | 2020-2025 |
| Growth Rate | CAGR of 7.5% from 2020-2034 |
| Segmentation |
|
Table of Contents
- 1. Introduction
- 1.1. Research Scope
- 1.2. Market Segmentation
- 1.3. Research Objective
- 1.4. Definitions and Assumptions
- 2. Executive Summary
- 2.1. Market Snapshot
- 3. Market Dynamics
- 3.1. Market Drivers
- 3.2. Market Restrains
- 3.3. Market Trends
- 3.4. Market Opportunities
- 4. Market Factor Analysis
- 4.1. Porters Five Forces
- 4.1.1. Bargaining Power of Suppliers
- 4.1.2. Bargaining Power of Buyers
- 4.1.3. Threat of New Entrants
- 4.1.4. Threat of Substitutes
- 4.1.5. Competitive Rivalry
- 4.2. PESTEL analysis
- 4.3. BCG Analysis
- 4.3.1. Stars (High Growth, High Market Share)
- 4.3.2. Cash Cows (Low Growth, High Market Share)
- 4.3.3. Question Mark (High Growth, Low Market Share)
- 4.3.4. Dogs (Low Growth, Low Market Share)
- 4.4. Ansoff Matrix Analysis
- 4.5. Supply Chain Analysis
- 4.6. Regulatory Landscape
- 4.7. Current Market Potential and Opportunity Assessment (TAM–SAM–SOM Framework)
- 4.8. MDP Analyst Note
- 4.1. Porters Five Forces
- 5. Market Analysis, Insights and Forecast 2021-2033
- 5.1. Market Analysis, Insights and Forecast - by Application
- 5.1.1. Hospital
- 5.1.2. Clinic
- 5.1.3. Others
- 5.2. Market Analysis, Insights and Forecast - by Types
- 5.2.1. Fingertip Blood Collection System
- 5.2.2. Venous Blood Collection System
- 5.3. Market Analysis, Insights and Forecast - by Region
- 5.3.1. North America
- 5.3.2. South America
- 5.3.3. Europe
- 5.3.4. Middle East & Africa
- 5.3.5. Asia Pacific
- 5.1. Market Analysis, Insights and Forecast - by Application
- 6. Global Automatic Blood Collection System Analysis, Insights and Forecast, 2021-2033
- 6.1. Market Analysis, Insights and Forecast - by Application
- 6.1.1. Hospital
- 6.1.2. Clinic
- 6.1.3. Others
- 6.2. Market Analysis, Insights and Forecast - by Types
- 6.2.1. Fingertip Blood Collection System
- 6.2.2. Venous Blood Collection System
- 6.1. Market Analysis, Insights and Forecast - by Application
- 7. North America Automatic Blood Collection System Analysis, Insights and Forecast, 2020-2032
- 7.1. Market Analysis, Insights and Forecast - by Application
- 7.1.1. Hospital
- 7.1.2. Clinic
- 7.1.3. Others
- 7.2. Market Analysis, Insights and Forecast - by Types
- 7.2.1. Fingertip Blood Collection System
- 7.2.2. Venous Blood Collection System
- 7.1. Market Analysis, Insights and Forecast - by Application
- 8. South America Automatic Blood Collection System Analysis, Insights and Forecast, 2020-2032
- 8.1. Market Analysis, Insights and Forecast - by Application
- 8.1.1. Hospital
- 8.1.2. Clinic
- 8.1.3. Others
- 8.2. Market Analysis, Insights and Forecast - by Types
- 8.2.1. Fingertip Blood Collection System
- 8.2.2. Venous Blood Collection System
- 8.1. Market Analysis, Insights and Forecast - by Application
- 9. Europe Automatic Blood Collection System Analysis, Insights and Forecast, 2020-2032
- 9.1. Market Analysis, Insights and Forecast - by Application
- 9.1.1. Hospital
- 9.1.2. Clinic
- 9.1.3. Others
- 9.2. Market Analysis, Insights and Forecast - by Types
- 9.2.1. Fingertip Blood Collection System
- 9.2.2. Venous Blood Collection System
- 9.1. Market Analysis, Insights and Forecast - by Application
- 10. Middle East & Africa Automatic Blood Collection System Analysis, Insights and Forecast, 2020-2032
- 10.1. Market Analysis, Insights and Forecast - by Application
- 10.1.1. Hospital
- 10.1.2. Clinic
- 10.1.3. Others
- 10.2. Market Analysis, Insights and Forecast - by Types
- 10.2.1. Fingertip Blood Collection System
- 10.2.2. Venous Blood Collection System
- 10.1. Market Analysis, Insights and Forecast - by Application
- 11. Asia Pacific Automatic Blood Collection System Analysis, Insights and Forecast, 2020-2032
- 11.1. Market Analysis, Insights and Forecast - by Application
- 11.1.1. Hospital
- 11.1.2. Clinic
- 11.1.3. Others
- 11.2. Market Analysis, Insights and Forecast - by Types
- 11.2.1. Fingertip Blood Collection System
- 11.2.2. Venous Blood Collection System
- 11.1. Market Analysis, Insights and Forecast - by Application
- 12. Competitive Analysis
- 12.1. Company Profiles
- 12.1.1 RWD
- 12.1.1.1. Company Overview
- 12.1.1.2. Products
- 12.1.1.3. Company Financials
- 12.1.1.4. SWOT Analysis
- 12.1.2 Terumo
- 12.1.2.1. Company Overview
- 12.1.2.2. Products
- 12.1.2.3. Company Financials
- 12.1.2.4. SWOT Analysis
- 12.1.3 Basi
- 12.1.3.1. Company Overview
- 12.1.3.2. Products
- 12.1.3.3. Company Financials
- 12.1.3.4. SWOT Analysis
- 12.1.4 Instech
- 12.1.4.1. Company Overview
- 12.1.4.2. Products
- 12.1.4.3. Company Financials
- 12.1.4.4. SWOT Analysis
- 12.1.5 OMEGA
- 12.1.5.1. Company Overview
- 12.1.5.2. Products
- 12.1.5.3. Company Financials
- 12.1.5.4. SWOT Analysis
- 12.1.6 Verutech
- 12.1.6.1. Company Overview
- 12.1.6.2. Products
- 12.1.6.3. Company Financials
- 12.1.6.4. SWOT Analysis
- 12.1.7 Eastern Group
- 12.1.7.1. Company Overview
- 12.1.7.2. Products
- 12.1.7.3. Company Financials
- 12.1.7.4. SWOT Analysis
- 12.1.8 Winnoz
- 12.1.8.1. Company Overview
- 12.1.8.2. Products
- 12.1.8.3. Company Financials
- 12.1.8.4. SWOT Analysis
- 12.1.1 RWD
- 12.2. Market Entropy
- 12.2.1 Company's Key Areas Served
- 12.2.2 Recent Developments
- 12.3. Company Market Share Analysis 2025
- 12.3.1 Top 5 Companies Market Share Analysis
- 12.3.2 Top 3 Companies Market Share Analysis
- 12.4. List of Potential Customers
- 13. Research Methodology
List of Figures
- Figure 1: Global Automatic Blood Collection System Revenue Breakdown (billion, %) by Region 2025 & 2033
- Figure 2: North America Automatic Blood Collection System Revenue (billion), by Application 2025 & 2033
- Figure 3: North America Automatic Blood Collection System Revenue Share (%), by Application 2025 & 2033
- Figure 4: North America Automatic Blood Collection System Revenue (billion), by Types 2025 & 2033
- Figure 5: North America Automatic Blood Collection System Revenue Share (%), by Types 2025 & 2033
- Figure 6: North America Automatic Blood Collection System Revenue (billion), by Country 2025 & 2033
- Figure 7: North America Automatic Blood Collection System Revenue Share (%), by Country 2025 & 2033
- Figure 8: South America Automatic Blood Collection System Revenue (billion), by Application 2025 & 2033
- Figure 9: South America Automatic Blood Collection System Revenue Share (%), by Application 2025 & 2033
- Figure 10: South America Automatic Blood Collection System Revenue (billion), by Types 2025 & 2033
- Figure 11: South America Automatic Blood Collection System Revenue Share (%), by Types 2025 & 2033
- Figure 12: South America Automatic Blood Collection System Revenue (billion), by Country 2025 & 2033
- Figure 13: South America Automatic Blood Collection System Revenue Share (%), by Country 2025 & 2033
- Figure 14: Europe Automatic Blood Collection System Revenue (billion), by Application 2025 & 2033
- Figure 15: Europe Automatic Blood Collection System Revenue Share (%), by Application 2025 & 2033
- Figure 16: Europe Automatic Blood Collection System Revenue (billion), by Types 2025 & 2033
- Figure 17: Europe Automatic Blood Collection System Revenue Share (%), by Types 2025 & 2033
- Figure 18: Europe Automatic Blood Collection System Revenue (billion), by Country 2025 & 2033
- Figure 19: Europe Automatic Blood Collection System Revenue Share (%), by Country 2025 & 2033
- Figure 20: Middle East & Africa Automatic Blood Collection System Revenue (billion), by Application 2025 & 2033
- Figure 21: Middle East & Africa Automatic Blood Collection System Revenue Share (%), by Application 2025 & 2033
- Figure 22: Middle East & Africa Automatic Blood Collection System Revenue (billion), by Types 2025 & 2033
- Figure 23: Middle East & Africa Automatic Blood Collection System Revenue Share (%), by Types 2025 & 2033
- Figure 24: Middle East & Africa Automatic Blood Collection System Revenue (billion), by Country 2025 & 2033
- Figure 25: Middle East & Africa Automatic Blood Collection System Revenue Share (%), by Country 2025 & 2033
- Figure 26: Asia Pacific Automatic Blood Collection System Revenue (billion), by Application 2025 & 2033
- Figure 27: Asia Pacific Automatic Blood Collection System Revenue Share (%), by Application 2025 & 2033
- Figure 28: Asia Pacific Automatic Blood Collection System Revenue (billion), by Types 2025 & 2033
- Figure 29: Asia Pacific Automatic Blood Collection System Revenue Share (%), by Types 2025 & 2033
- Figure 30: Asia Pacific Automatic Blood Collection System Revenue (billion), by Country 2025 & 2033
- Figure 31: Asia Pacific Automatic Blood Collection System Revenue Share (%), by Country 2025 & 2033
List of Tables
- Table 1: Global Automatic Blood Collection System Revenue billion Forecast, by Application 2020 & 2033
- Table 2: Global Automatic Blood Collection System Revenue billion Forecast, by Types 2020 & 2033
- Table 3: Global Automatic Blood Collection System Revenue billion Forecast, by Region 2020 & 2033
- Table 4: Global Automatic Blood Collection System Revenue billion Forecast, by Application 2020 & 2033
- Table 5: Global Automatic Blood Collection System Revenue billion Forecast, by Types 2020 & 2033
- Table 6: Global Automatic Blood Collection System Revenue billion Forecast, by Country 2020 & 2033
- Table 7: United States Automatic Blood Collection System Revenue (billion) Forecast, by Application 2020 & 2033
- Table 8: Canada Automatic Blood Collection System Revenue (billion) Forecast, by Application 2020 & 2033
- Table 9: Mexico Automatic Blood Collection System Revenue (billion) Forecast, by Application 2020 & 2033
- Table 10: Global Automatic Blood Collection System Revenue billion Forecast, by Application 2020 & 2033
- Table 11: Global Automatic Blood Collection System Revenue billion Forecast, by Types 2020 & 2033
- Table 12: Global Automatic Blood Collection System Revenue billion Forecast, by Country 2020 & 2033
- Table 13: Brazil Automatic Blood Collection System Revenue (billion) Forecast, by Application 2020 & 2033
- Table 14: Argentina Automatic Blood Collection System Revenue (billion) Forecast, by Application 2020 & 2033
- Table 15: Rest of South America Automatic Blood Collection System Revenue (billion) Forecast, by Application 2020 & 2033
- Table 16: Global Automatic Blood Collection System Revenue billion Forecast, by Application 2020 & 2033
- Table 17: Global Automatic Blood Collection System Revenue billion Forecast, by Types 2020 & 2033
- Table 18: Global Automatic Blood Collection System Revenue billion Forecast, by Country 2020 & 2033
- Table 19: United Kingdom Automatic Blood Collection System Revenue (billion) Forecast, by Application 2020 & 2033
- Table 20: Germany Automatic Blood Collection System Revenue (billion) Forecast, by Application 2020 & 2033
- Table 21: France Automatic Blood Collection System Revenue (billion) Forecast, by Application 2020 & 2033
- Table 22: Italy Automatic Blood Collection System Revenue (billion) Forecast, by Application 2020 & 2033
- Table 23: Spain Automatic Blood Collection System Revenue (billion) Forecast, by Application 2020 & 2033
- Table 24: Russia Automatic Blood Collection System Revenue (billion) Forecast, by Application 2020 & 2033
- Table 25: Benelux Automatic Blood Collection System Revenue (billion) Forecast, by Application 2020 & 2033
- Table 26: Nordics Automatic Blood Collection System Revenue (billion) Forecast, by Application 2020 & 2033
- Table 27: Rest of Europe Automatic Blood Collection System Revenue (billion) Forecast, by Application 2020 & 2033
- Table 28: Global Automatic Blood Collection System Revenue billion Forecast, by Application 2020 & 2033
- Table 29: Global Automatic Blood Collection System Revenue billion Forecast, by Types 2020 & 2033
- Table 30: Global Automatic Blood Collection System Revenue billion Forecast, by Country 2020 & 2033
- Table 31: Turkey Automatic Blood Collection System Revenue (billion) Forecast, by Application 2020 & 2033
- Table 32: Israel Automatic Blood Collection System Revenue (billion) Forecast, by Application 2020 & 2033
- Table 33: GCC Automatic Blood Collection System Revenue (billion) Forecast, by Application 2020 & 2033
- Table 34: North Africa Automatic Blood Collection System Revenue (billion) Forecast, by Application 2020 & 2033
- Table 35: South Africa Automatic Blood Collection System Revenue (billion) Forecast, by Application 2020 & 2033
- Table 36: Rest of Middle East & Africa Automatic Blood Collection System Revenue (billion) Forecast, by Application 2020 & 2033
- Table 37: Global Automatic Blood Collection System Revenue billion Forecast, by Application 2020 & 2033
- Table 38: Global Automatic Blood Collection System Revenue billion Forecast, by Types 2020 & 2033
- Table 39: Global Automatic Blood Collection System Revenue billion Forecast, by Country 2020 & 2033
- Table 40: China Automatic Blood Collection System Revenue (billion) Forecast, by Application 2020 & 2033
- Table 41: India Automatic Blood Collection System Revenue (billion) Forecast, by Application 2020 & 2033
- Table 42: Japan Automatic Blood Collection System Revenue (billion) Forecast, by Application 2020 & 2033
- Table 43: South Korea Automatic Blood Collection System Revenue (billion) Forecast, by Application 2020 & 2033
- Table 44: ASEAN Automatic Blood Collection System Revenue (billion) Forecast, by Application 2020 & 2033
- Table 45: Oceania Automatic Blood Collection System Revenue (billion) Forecast, by Application 2020 & 2033
- Table 46: Rest of Asia Pacific Automatic Blood Collection System Revenue (billion) Forecast, by Application 2020 & 2033
Frequently Asked Questions
1. What is the projected Compound Annual Growth Rate (CAGR) of the Automatic Blood Collection System?
The projected CAGR is approximately 7.5%.
2. Which companies are prominent players in the Automatic Blood Collection System?
Key companies in the market include RWD, Terumo, Basi, Instech, OMEGA, Verutech, Eastern Group, Winnoz.
3. What are the main segments of the Automatic Blood Collection System?
The market segments include Application, Types.
4. Can you provide details about the market size?
The market size is estimated to be USD 2.15 billion as of 2022.
5. What are some drivers contributing to market growth?
N/A
6. What are the notable trends driving market growth?
N/A
7. Are there any restraints impacting market growth?
N/A
8. Can you provide examples of recent developments in the market?
N/A
9. What pricing options are available for accessing the report?
Pricing options include single-user, multi-user, and enterprise licenses priced at USD 2900.00, USD 4350.00, and USD 5800.00 respectively.
10. Is the market size provided in terms of value or volume?
The market size is provided in terms of value, measured in billion.
11. Are there any specific market keywords associated with the report?
Yes, the market keyword associated with the report is "Automatic Blood Collection System," which aids in identifying and referencing the specific market segment covered.
12. How do I determine which pricing option suits my needs best?
The pricing options vary based on user requirements and access needs. Individual users may opt for single-user licenses, while businesses requiring broader access may choose multi-user or enterprise licenses for cost-effective access to the report.
13. Are there any additional resources or data provided in the Automatic Blood Collection System report?
While the report offers comprehensive insights, it's advisable to review the specific contents or supplementary materials provided to ascertain if additional resources or data are available.
14. How can I stay updated on further developments or reports in the Automatic Blood Collection System?
To stay informed about further developments, trends, and reports in the Automatic Blood Collection System, consider subscribing to industry newsletters, following relevant companies and organizations, or regularly checking reputable industry news sources and publications.
Methodology
Step 1 - Identification of Relevant Samples Size from Population Database


Step 2 - Approaches for Defining Global Market Size (Value, Volume* & Price*)

Note*: In applicable scenarios
Step 3 - Data Sources
Primary Research
- Web Analytics
- Survey Reports
- Research Institute
- Latest Research Reports
- Opinion Leaders
Secondary Research
- Annual Reports
- White Paper
- Latest Press Release
- Industry Association
- Paid Database
- Investor Presentations

Step 4 - Data Triangulation
Involves using different sources of information in order to increase the validity of a study
These sources are likely to be stakeholders in a program - participants, other researchers, program staff, other community members, and so on.
Then we put all data in single framework & apply various statistical tools to find out the dynamic on the market.
During the analysis stage, feedback from the stakeholder groups would be compared to determine areas of agreement as well as areas of divergence