

Key Insights
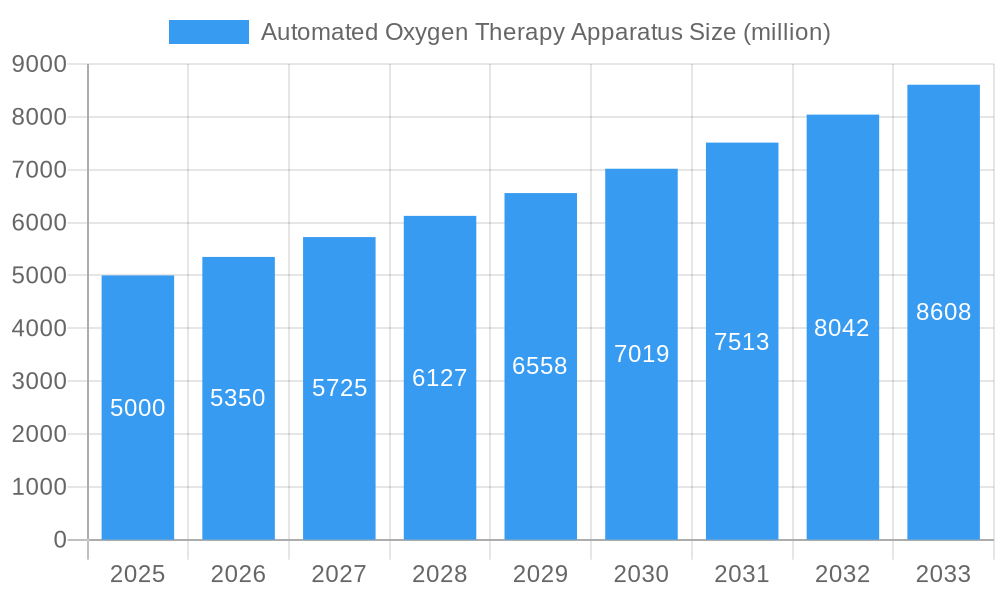
The automated oxygen therapy apparatus market is experiencing robust growth, driven by increasing prevalence of respiratory illnesses, aging populations globally, and technological advancements leading to more efficient and user-friendly devices. The market is segmented by device type (e.g., stationary concentrators, portable concentrators, ventilators with oxygen delivery), end-user (hospitals, home care settings, long-term care facilities), and geography. Key players like Vygon, Allied Healthcare Products, Inc., and Philips are investing heavily in research and development, introducing innovative products with improved features such as enhanced portability, quieter operation, and advanced monitoring capabilities. This competitive landscape is fueling market expansion, with companies focusing on strategic partnerships, mergers, and acquisitions to expand their market reach and product portfolios. The rising adoption of home healthcare services, coupled with increasing patient awareness and demand for convenient oxygen therapy solutions, is further boosting market growth. However, high initial costs associated with these devices and the need for skilled personnel for proper operation and maintenance pose certain challenges to market penetration, especially in developing economies. We estimate the market to be valued at approximately $5 billion in 2025, with a Compound Annual Growth Rate (CAGR) of 7% projected through 2033. This growth is anticipated to be consistent across major regions, although North America and Europe are likely to maintain a significant market share owing to higher healthcare expenditure and technological advancements.
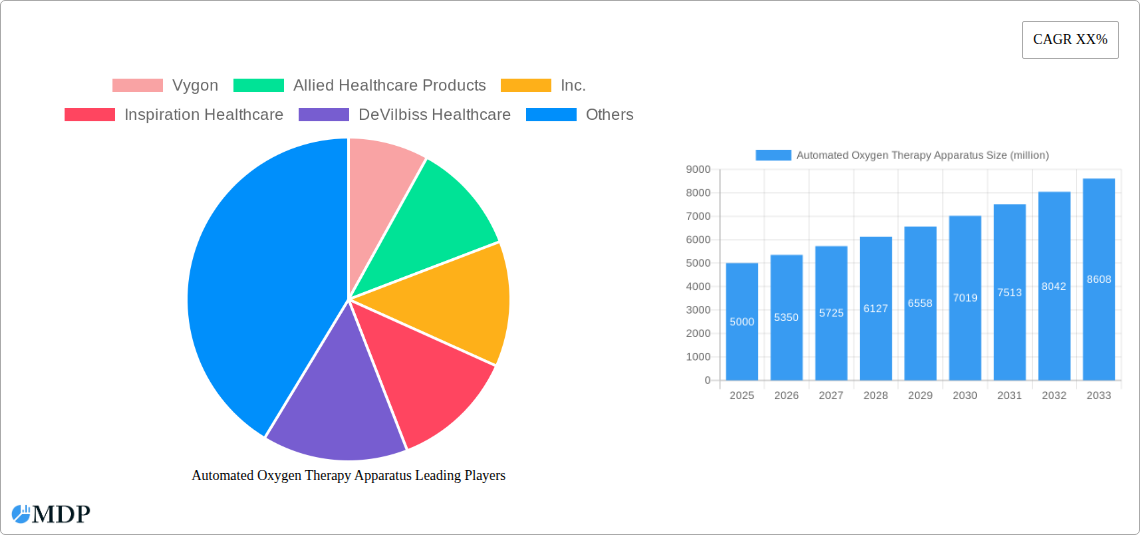
Automated Oxygen Therapy Apparatus Market Size (In Billion)
Future growth will be significantly impacted by factors such as the introduction of innovative, cost-effective devices, regulatory approvals for new technologies, and government initiatives to promote home healthcare. The market will likely witness increased consolidation amongst key players through mergers and acquisitions. Technological advancements focused on improving device portability, reducing noise levels, and incorporating smart features will remain critical drivers of market growth. The increasing prevalence of chronic respiratory diseases, such as COPD and asthma, will contribute to continued demand, while the integration of telehealth and remote patient monitoring systems will expand the market’s reach and improve patient outcomes. This combined effect will drive innovation and increase market competition, ultimately benefitting patients and healthcare providers alike.
Automated Oxygen Therapy Apparatus Company Market Share
Automated Oxygen Therapy Apparatus Market Report: 2019-2033
This comprehensive report provides a detailed analysis of the global Automated Oxygen Therapy Apparatus market, offering invaluable insights for industry stakeholders, investors, and strategic decision-makers. The report covers the period 2019-2033, with a base year of 2025 and a forecast period of 2025-2033. The market is projected to reach xx million by 2033, exhibiting a CAGR of xx% during the forecast period. This in-depth analysis examines market dynamics, leading players, technological advancements, and future growth opportunities.
Automated Oxygen Therapy Apparatus Market Dynamics & Concentration
The global Automated Oxygen Therapy Apparatus market exhibits a moderately concentrated landscape, with several key players holding significant market share. In 2024, the top five companies – Fisher & Paykel Healthcare, Philips, Invacare, Smiths Medical, and GE Healthcare – collectively accounted for approximately xx% of the market. Market concentration is influenced by factors such as economies of scale, technological innovation, and regulatory approvals.
Innovation Drivers: The market is driven by continuous innovation in areas like sensor technology, portable device design, and data analytics integration. These improvements lead to better patient outcomes and increased user convenience.
Regulatory Frameworks: Stringent regulatory approvals and safety standards significantly impact market entry and product development. Compliance with global health regulations is crucial for market players.
Product Substitutes: While alternatives exist, Automated Oxygen Therapy Apparatus offers superior convenience and efficacy, ensuring its sustained demand.
End-User Trends: Growing geriatric populations and increasing prevalence of respiratory diseases are major end-user trends driving market expansion.
M&A Activities: The market has witnessed xx M&A deals between 2019 and 2024, primarily driven by strategic expansions and technological acquisitions. This activity further shapes market concentration.
Automated Oxygen Therapy Apparatus Industry Trends & Analysis
The Automated Oxygen Therapy Apparatus market is experiencing robust growth, fueled by several key factors. The rising prevalence of chronic respiratory illnesses like COPD and asthma globally is a significant driver. Technological advancements, such as the incorporation of smart features and remote monitoring capabilities, enhance patient care and contribute to market expansion. Consumer preference is shifting towards portable and user-friendly devices, creating demand for smaller, lighter, and more efficient apparatus.
The market's competitive landscape is characterized by intense rivalry among established players and emerging entrants. These companies focus on product differentiation, technological innovation, and strategic partnerships to gain a competitive edge. The market witnessed a CAGR of xx% during the historical period (2019-2024) and is expected to maintain strong growth momentum in the forecast period (2025-2033), achieving a market penetration rate of xx% by 2033.
Leading Markets & Segments in Automated Oxygen Therapy Apparatus
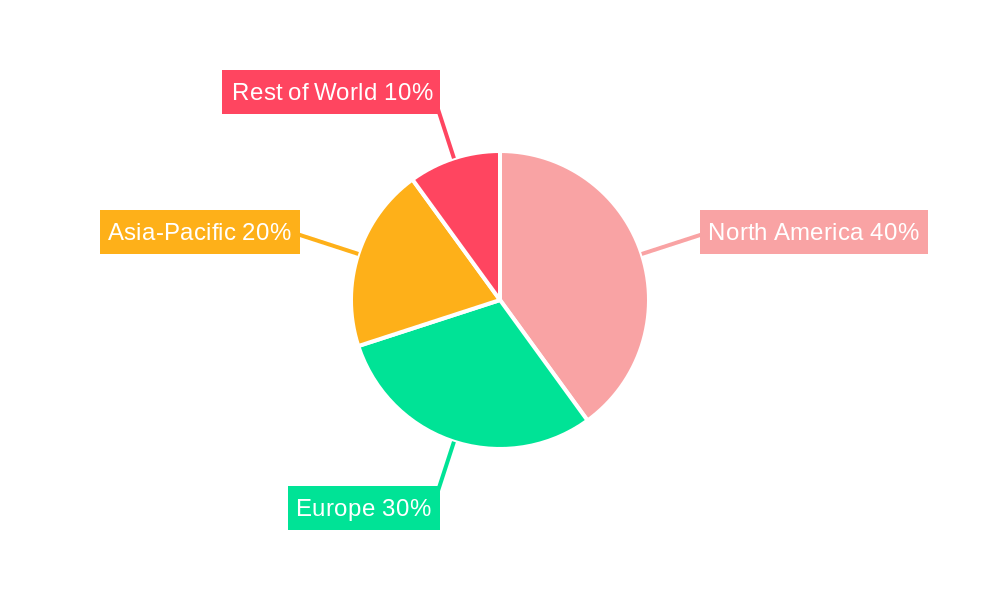
North America currently dominates the Automated Oxygen Therapy Apparatus market, driven by factors such as high healthcare expenditure, advanced healthcare infrastructure, and a significant aging population.
- Key Drivers in North America:
- High healthcare expenditure and insurance coverage
- Well-established healthcare infrastructure
- Growing prevalence of chronic respiratory diseases
- Technological advancements and early adoption of new technologies
- Favorable regulatory environment
Europe holds a substantial market share, followed by Asia Pacific, which exhibits high growth potential due to rising healthcare awareness and economic development. The home healthcare segment holds the largest market share, driven by the increasing preference for convenient and cost-effective home-based treatments.
Automated Oxygen Therapy Apparatus Product Developments
Recent product innovations focus on improving portability, ease of use, and integration with remote monitoring systems. Miniaturization, enhanced battery life, and improved oxygen delivery mechanisms are key trends. These advancements are expanding the applications of automated oxygen therapy apparatus, making it accessible to a wider range of patients. The competitive advantage lies in delivering superior performance, user-friendliness, and cost-effectiveness.
Key Drivers of Automated Oxygen Therapy Apparatus Growth
Several factors contribute to the market's growth trajectory. Technological advancements, including miniaturization and smart features, are making the apparatus more user-friendly and efficient. The aging global population and rising prevalence of chronic respiratory diseases fuel demand. Favorable government regulations and reimbursement policies further support market expansion.
Challenges in the Automated Oxygen Therapy Apparatus Market
The market faces challenges including high manufacturing costs, stringent regulatory compliance requirements, and intense competition among established players and new entrants. Supply chain disruptions and fluctuations in raw material prices can also impact market growth. These factors can influence profitability and market access for companies operating in this sector.
Emerging Opportunities in Automated Oxygen Therapy Apparatus
The market presents significant opportunities driven by technological breakthroughs in sensor technology, data analytics, and artificial intelligence. Strategic partnerships and collaborations between manufacturers and healthcare providers can enhance market penetration. Expansion into emerging economies with a growing need for respiratory care solutions also holds considerable potential.
Leading Players in the Automated Oxygen Therapy Apparatus Sector
- Vygon
- Allied Healthcare Products, Inc.
- Inspiration Healthcare
- DeVilbiss Healthcare
- Fisher & Paykel Healthcare
- Invacare
- Philips
- CareFusion
- GCE Healthcare
- GE Healthcare
- Inogen
- Smiths Medical
Key Milestones in Automated Oxygen Therapy Apparatus Industry
- 2020: Launch of a new portable oxygen concentrator with advanced features by Fisher & Paykel Healthcare.
- 2021: Acquisition of a smaller oxygen therapy company by Philips, expanding its product portfolio.
- 2022: Introduction of a smart oxygen therapy device with remote monitoring capabilities by GE Healthcare.
- 2023: Approval of a new oxygen therapy technology by the FDA.
- 2024: Strategic partnership between Invacare and a leading telehealth provider to improve patient care.
Strategic Outlook for Automated Oxygen Therapy Apparatus Market
The Automated Oxygen Therapy Apparatus market is poised for continued growth, driven by technological innovation, expanding applications, and an aging population. Strategic investments in research and development, focusing on enhanced portability, connectivity, and user-friendliness, will be crucial for market success. Companies that can effectively navigate regulatory hurdles and establish strong distribution networks will be best positioned to capture significant market share in the coming years.
Automated Oxygen Therapy Apparatus Segmentation
-
1. Application
- 1.1. Hospital
- 1.2. Clinic
- 1.3. Other
-
2. Types
- 2.1. Portable
- 2.2. Benchtop
Automated Oxygen Therapy Apparatus Segmentation By Geography
-
1. North America
- 1.1. United States
- 1.2. Canada
- 1.3. Mexico
-
2. South America
- 2.1. Brazil
- 2.2. Argentina
- 2.3. Rest of South America
-
3. Europe
- 3.1. United Kingdom
- 3.2. Germany
- 3.3. France
- 3.4. Italy
- 3.5. Spain
- 3.6. Russia
- 3.7. Benelux
- 3.8. Nordics
- 3.9. Rest of Europe
-
4. Middle East & Africa
- 4.1. Turkey
- 4.2. Israel
- 4.3. GCC
- 4.4. North Africa
- 4.5. South Africa
- 4.6. Rest of Middle East & Africa
-
5. Asia Pacific
- 5.1. China
- 5.2. India
- 5.3. Japan
- 5.4. South Korea
- 5.5. ASEAN
- 5.6. Oceania
- 5.7. Rest of Asia Pacific
Automated Oxygen Therapy Apparatus Regional Market Share
Geographic Coverage of Automated Oxygen Therapy Apparatus
Automated Oxygen Therapy Apparatus REPORT HIGHLIGHTS
| Aspects | Details |
|---|---|
| Study Period | 2020-2034 |
| Base Year | 2025 |
| Estimated Year | 2026 |
| Forecast Period | 2026-2034 |
| Historical Period | 2020-2025 |
| Growth Rate | CAGR of 7.89% from 2020-2034 |
| Segmentation |
|
Table of Contents
- 1. Introduction
- 1.1. Research Scope
- 1.2. Market Segmentation
- 1.3. Research Objective
- 1.4. Definitions and Assumptions
- 2. Executive Summary
- 2.1. Market Snapshot
- 3. Market Dynamics
- 3.1. Market Drivers
- 3.2. Market Restrains
- 3.3. Market Trends
- 3.4. Market Opportunities
- 4. Market Factor Analysis
- 4.1. Porters Five Forces
- 4.1.1. Bargaining Power of Suppliers
- 4.1.2. Bargaining Power of Buyers
- 4.1.3. Threat of New Entrants
- 4.1.4. Threat of Substitutes
- 4.1.5. Competitive Rivalry
- 4.2. PESTEL analysis
- 4.3. BCG Analysis
- 4.3.1. Stars (High Growth, High Market Share)
- 4.3.2. Cash Cows (Low Growth, High Market Share)
- 4.3.3. Question Mark (High Growth, Low Market Share)
- 4.3.4. Dogs (Low Growth, Low Market Share)
- 4.4. Ansoff Matrix Analysis
- 4.5. Supply Chain Analysis
- 4.6. Regulatory Landscape
- 4.7. Current Market Potential and Opportunity Assessment (TAM–SAM–SOM Framework)
- 4.8. MDP Analyst Note
- 4.1. Porters Five Forces
- 5. Market Analysis, Insights and Forecast 2021-2033
- 5.1. Market Analysis, Insights and Forecast - by Application
- 5.1.1. Hospital
- 5.1.2. Clinic
- 5.1.3. Other
- 5.2. Market Analysis, Insights and Forecast - by Types
- 5.2.1. Portable
- 5.2.2. Benchtop
- 5.3. Market Analysis, Insights and Forecast - by Region
- 5.3.1. North America
- 5.3.2. South America
- 5.3.3. Europe
- 5.3.4. Middle East & Africa
- 5.3.5. Asia Pacific
- 5.1. Market Analysis, Insights and Forecast - by Application
- 6. Global Automated Oxygen Therapy Apparatus Analysis, Insights and Forecast, 2021-2033
- 6.1. Market Analysis, Insights and Forecast - by Application
- 6.1.1. Hospital
- 6.1.2. Clinic
- 6.1.3. Other
- 6.2. Market Analysis, Insights and Forecast - by Types
- 6.2.1. Portable
- 6.2.2. Benchtop
- 6.1. Market Analysis, Insights and Forecast - by Application
- 7. North America Automated Oxygen Therapy Apparatus Analysis, Insights and Forecast, 2020-2032
- 7.1. Market Analysis, Insights and Forecast - by Application
- 7.1.1. Hospital
- 7.1.2. Clinic
- 7.1.3. Other
- 7.2. Market Analysis, Insights and Forecast - by Types
- 7.2.1. Portable
- 7.2.2. Benchtop
- 7.1. Market Analysis, Insights and Forecast - by Application
- 8. South America Automated Oxygen Therapy Apparatus Analysis, Insights and Forecast, 2020-2032
- 8.1. Market Analysis, Insights and Forecast - by Application
- 8.1.1. Hospital
- 8.1.2. Clinic
- 8.1.3. Other
- 8.2. Market Analysis, Insights and Forecast - by Types
- 8.2.1. Portable
- 8.2.2. Benchtop
- 8.1. Market Analysis, Insights and Forecast - by Application
- 9. Europe Automated Oxygen Therapy Apparatus Analysis, Insights and Forecast, 2020-2032
- 9.1. Market Analysis, Insights and Forecast - by Application
- 9.1.1. Hospital
- 9.1.2. Clinic
- 9.1.3. Other
- 9.2. Market Analysis, Insights and Forecast - by Types
- 9.2.1. Portable
- 9.2.2. Benchtop
- 9.1. Market Analysis, Insights and Forecast - by Application
- 10. Middle East & Africa Automated Oxygen Therapy Apparatus Analysis, Insights and Forecast, 2020-2032
- 10.1. Market Analysis, Insights and Forecast - by Application
- 10.1.1. Hospital
- 10.1.2. Clinic
- 10.1.3. Other
- 10.2. Market Analysis, Insights and Forecast - by Types
- 10.2.1. Portable
- 10.2.2. Benchtop
- 10.1. Market Analysis, Insights and Forecast - by Application
- 11. Asia Pacific Automated Oxygen Therapy Apparatus Analysis, Insights and Forecast, 2020-2032
- 11.1. Market Analysis, Insights and Forecast - by Application
- 11.1.1. Hospital
- 11.1.2. Clinic
- 11.1.3. Other
- 11.2. Market Analysis, Insights and Forecast - by Types
- 11.2.1. Portable
- 11.2.2. Benchtop
- 11.1. Market Analysis, Insights and Forecast - by Application
- 12. Competitive Analysis
- 12.1. Company Profiles
- 12.1.1 Vygon
- 12.1.1.1. Company Overview
- 12.1.1.2. Products
- 12.1.1.3. Company Financials
- 12.1.1.4. SWOT Analysis
- 12.1.2 Allied Healthcare Products
- 12.1.2.1. Company Overview
- 12.1.2.2. Products
- 12.1.2.3. Company Financials
- 12.1.2.4. SWOT Analysis
- 12.1.3 Inc.
- 12.1.3.1. Company Overview
- 12.1.3.2. Products
- 12.1.3.3. Company Financials
- 12.1.3.4. SWOT Analysis
- 12.1.4 Inspiration Healthcare
- 12.1.4.1. Company Overview
- 12.1.4.2. Products
- 12.1.4.3. Company Financials
- 12.1.4.4. SWOT Analysis
- 12.1.5 DeVilbiss Healthcare
- 12.1.5.1. Company Overview
- 12.1.5.2. Products
- 12.1.5.3. Company Financials
- 12.1.5.4. SWOT Analysis
- 12.1.6 Fisher & Paykel Healthcare
- 12.1.6.1. Company Overview
- 12.1.6.2. Products
- 12.1.6.3. Company Financials
- 12.1.6.4. SWOT Analysis
- 12.1.7 Invacare
- 12.1.7.1. Company Overview
- 12.1.7.2. Products
- 12.1.7.3. Company Financials
- 12.1.7.4. SWOT Analysis
- 12.1.8 Philips
- 12.1.8.1. Company Overview
- 12.1.8.2. Products
- 12.1.8.3. Company Financials
- 12.1.8.4. SWOT Analysis
- 12.1.9 CareFusion
- 12.1.9.1. Company Overview
- 12.1.9.2. Products
- 12.1.9.3. Company Financials
- 12.1.9.4. SWOT Analysis
- 12.1.10 GCE Healthcare
- 12.1.10.1. Company Overview
- 12.1.10.2. Products
- 12.1.10.3. Company Financials
- 12.1.10.4. SWOT Analysis
- 12.1.11 GE Healthcare
- 12.1.11.1. Company Overview
- 12.1.11.2. Products
- 12.1.11.3. Company Financials
- 12.1.11.4. SWOT Analysis
- 12.1.12 Inogen
- 12.1.12.1. Company Overview
- 12.1.12.2. Products
- 12.1.12.3. Company Financials
- 12.1.12.4. SWOT Analysis
- 12.1.13 Smiths Medical
- 12.1.13.1. Company Overview
- 12.1.13.2. Products
- 12.1.13.3. Company Financials
- 12.1.13.4. SWOT Analysis
- 12.1.1 Vygon
- 12.2. Market Entropy
- 12.2.1 Company's Key Areas Served
- 12.2.2 Recent Developments
- 12.3. Company Market Share Analysis 2025
- 12.3.1 Top 5 Companies Market Share Analysis
- 12.3.2 Top 3 Companies Market Share Analysis
- 12.4. List of Potential Customers
- 13. Research Methodology
List of Figures
- Figure 1: Global Automated Oxygen Therapy Apparatus Revenue Breakdown (undefined, %) by Region 2025 & 2033
- Figure 2: Global Automated Oxygen Therapy Apparatus Volume Breakdown (K, %) by Region 2025 & 2033
- Figure 3: North America Automated Oxygen Therapy Apparatus Revenue (undefined), by Application 2025 & 2033
- Figure 4: North America Automated Oxygen Therapy Apparatus Volume (K), by Application 2025 & 2033
- Figure 5: North America Automated Oxygen Therapy Apparatus Revenue Share (%), by Application 2025 & 2033
- Figure 6: North America Automated Oxygen Therapy Apparatus Volume Share (%), by Application 2025 & 2033
- Figure 7: North America Automated Oxygen Therapy Apparatus Revenue (undefined), by Types 2025 & 2033
- Figure 8: North America Automated Oxygen Therapy Apparatus Volume (K), by Types 2025 & 2033
- Figure 9: North America Automated Oxygen Therapy Apparatus Revenue Share (%), by Types 2025 & 2033
- Figure 10: North America Automated Oxygen Therapy Apparatus Volume Share (%), by Types 2025 & 2033
- Figure 11: North America Automated Oxygen Therapy Apparatus Revenue (undefined), by Country 2025 & 2033
- Figure 12: North America Automated Oxygen Therapy Apparatus Volume (K), by Country 2025 & 2033
- Figure 13: North America Automated Oxygen Therapy Apparatus Revenue Share (%), by Country 2025 & 2033
- Figure 14: North America Automated Oxygen Therapy Apparatus Volume Share (%), by Country 2025 & 2033
- Figure 15: South America Automated Oxygen Therapy Apparatus Revenue (undefined), by Application 2025 & 2033
- Figure 16: South America Automated Oxygen Therapy Apparatus Volume (K), by Application 2025 & 2033
- Figure 17: South America Automated Oxygen Therapy Apparatus Revenue Share (%), by Application 2025 & 2033
- Figure 18: South America Automated Oxygen Therapy Apparatus Volume Share (%), by Application 2025 & 2033
- Figure 19: South America Automated Oxygen Therapy Apparatus Revenue (undefined), by Types 2025 & 2033
- Figure 20: South America Automated Oxygen Therapy Apparatus Volume (K), by Types 2025 & 2033
- Figure 21: South America Automated Oxygen Therapy Apparatus Revenue Share (%), by Types 2025 & 2033
- Figure 22: South America Automated Oxygen Therapy Apparatus Volume Share (%), by Types 2025 & 2033
- Figure 23: South America Automated Oxygen Therapy Apparatus Revenue (undefined), by Country 2025 & 2033
- Figure 24: South America Automated Oxygen Therapy Apparatus Volume (K), by Country 2025 & 2033
- Figure 25: South America Automated Oxygen Therapy Apparatus Revenue Share (%), by Country 2025 & 2033
- Figure 26: South America Automated Oxygen Therapy Apparatus Volume Share (%), by Country 2025 & 2033
- Figure 27: Europe Automated Oxygen Therapy Apparatus Revenue (undefined), by Application 2025 & 2033
- Figure 28: Europe Automated Oxygen Therapy Apparatus Volume (K), by Application 2025 & 2033
- Figure 29: Europe Automated Oxygen Therapy Apparatus Revenue Share (%), by Application 2025 & 2033
- Figure 30: Europe Automated Oxygen Therapy Apparatus Volume Share (%), by Application 2025 & 2033
- Figure 31: Europe Automated Oxygen Therapy Apparatus Revenue (undefined), by Types 2025 & 2033
- Figure 32: Europe Automated Oxygen Therapy Apparatus Volume (K), by Types 2025 & 2033
- Figure 33: Europe Automated Oxygen Therapy Apparatus Revenue Share (%), by Types 2025 & 2033
- Figure 34: Europe Automated Oxygen Therapy Apparatus Volume Share (%), by Types 2025 & 2033
- Figure 35: Europe Automated Oxygen Therapy Apparatus Revenue (undefined), by Country 2025 & 2033
- Figure 36: Europe Automated Oxygen Therapy Apparatus Volume (K), by Country 2025 & 2033
- Figure 37: Europe Automated Oxygen Therapy Apparatus Revenue Share (%), by Country 2025 & 2033
- Figure 38: Europe Automated Oxygen Therapy Apparatus Volume Share (%), by Country 2025 & 2033
- Figure 39: Middle East & Africa Automated Oxygen Therapy Apparatus Revenue (undefined), by Application 2025 & 2033
- Figure 40: Middle East & Africa Automated Oxygen Therapy Apparatus Volume (K), by Application 2025 & 2033
- Figure 41: Middle East & Africa Automated Oxygen Therapy Apparatus Revenue Share (%), by Application 2025 & 2033
- Figure 42: Middle East & Africa Automated Oxygen Therapy Apparatus Volume Share (%), by Application 2025 & 2033
- Figure 43: Middle East & Africa Automated Oxygen Therapy Apparatus Revenue (undefined), by Types 2025 & 2033
- Figure 44: Middle East & Africa Automated Oxygen Therapy Apparatus Volume (K), by Types 2025 & 2033
- Figure 45: Middle East & Africa Automated Oxygen Therapy Apparatus Revenue Share (%), by Types 2025 & 2033
- Figure 46: Middle East & Africa Automated Oxygen Therapy Apparatus Volume Share (%), by Types 2025 & 2033
- Figure 47: Middle East & Africa Automated Oxygen Therapy Apparatus Revenue (undefined), by Country 2025 & 2033
- Figure 48: Middle East & Africa Automated Oxygen Therapy Apparatus Volume (K), by Country 2025 & 2033
- Figure 49: Middle East & Africa Automated Oxygen Therapy Apparatus Revenue Share (%), by Country 2025 & 2033
- Figure 50: Middle East & Africa Automated Oxygen Therapy Apparatus Volume Share (%), by Country 2025 & 2033
- Figure 51: Asia Pacific Automated Oxygen Therapy Apparatus Revenue (undefined), by Application 2025 & 2033
- Figure 52: Asia Pacific Automated Oxygen Therapy Apparatus Volume (K), by Application 2025 & 2033
- Figure 53: Asia Pacific Automated Oxygen Therapy Apparatus Revenue Share (%), by Application 2025 & 2033
- Figure 54: Asia Pacific Automated Oxygen Therapy Apparatus Volume Share (%), by Application 2025 & 2033
- Figure 55: Asia Pacific Automated Oxygen Therapy Apparatus Revenue (undefined), by Types 2025 & 2033
- Figure 56: Asia Pacific Automated Oxygen Therapy Apparatus Volume (K), by Types 2025 & 2033
- Figure 57: Asia Pacific Automated Oxygen Therapy Apparatus Revenue Share (%), by Types 2025 & 2033
- Figure 58: Asia Pacific Automated Oxygen Therapy Apparatus Volume Share (%), by Types 2025 & 2033
- Figure 59: Asia Pacific Automated Oxygen Therapy Apparatus Revenue (undefined), by Country 2025 & 2033
- Figure 60: Asia Pacific Automated Oxygen Therapy Apparatus Volume (K), by Country 2025 & 2033
- Figure 61: Asia Pacific Automated Oxygen Therapy Apparatus Revenue Share (%), by Country 2025 & 2033
- Figure 62: Asia Pacific Automated Oxygen Therapy Apparatus Volume Share (%), by Country 2025 & 2033
List of Tables
- Table 1: Global Automated Oxygen Therapy Apparatus Revenue undefined Forecast, by Application 2020 & 2033
- Table 2: Global Automated Oxygen Therapy Apparatus Volume K Forecast, by Application 2020 & 2033
- Table 3: Global Automated Oxygen Therapy Apparatus Revenue undefined Forecast, by Types 2020 & 2033
- Table 4: Global Automated Oxygen Therapy Apparatus Volume K Forecast, by Types 2020 & 2033
- Table 5: Global Automated Oxygen Therapy Apparatus Revenue undefined Forecast, by Region 2020 & 2033
- Table 6: Global Automated Oxygen Therapy Apparatus Volume K Forecast, by Region 2020 & 2033
- Table 7: Global Automated Oxygen Therapy Apparatus Revenue undefined Forecast, by Application 2020 & 2033
- Table 8: Global Automated Oxygen Therapy Apparatus Volume K Forecast, by Application 2020 & 2033
- Table 9: Global Automated Oxygen Therapy Apparatus Revenue undefined Forecast, by Types 2020 & 2033
- Table 10: Global Automated Oxygen Therapy Apparatus Volume K Forecast, by Types 2020 & 2033
- Table 11: Global Automated Oxygen Therapy Apparatus Revenue undefined Forecast, by Country 2020 & 2033
- Table 12: Global Automated Oxygen Therapy Apparatus Volume K Forecast, by Country 2020 & 2033
- Table 13: United States Automated Oxygen Therapy Apparatus Revenue (undefined) Forecast, by Application 2020 & 2033
- Table 14: United States Automated Oxygen Therapy Apparatus Volume (K) Forecast, by Application 2020 & 2033
- Table 15: Canada Automated Oxygen Therapy Apparatus Revenue (undefined) Forecast, by Application 2020 & 2033
- Table 16: Canada Automated Oxygen Therapy Apparatus Volume (K) Forecast, by Application 2020 & 2033
- Table 17: Mexico Automated Oxygen Therapy Apparatus Revenue (undefined) Forecast, by Application 2020 & 2033
- Table 18: Mexico Automated Oxygen Therapy Apparatus Volume (K) Forecast, by Application 2020 & 2033
- Table 19: Global Automated Oxygen Therapy Apparatus Revenue undefined Forecast, by Application 2020 & 2033
- Table 20: Global Automated Oxygen Therapy Apparatus Volume K Forecast, by Application 2020 & 2033
- Table 21: Global Automated Oxygen Therapy Apparatus Revenue undefined Forecast, by Types 2020 & 2033
- Table 22: Global Automated Oxygen Therapy Apparatus Volume K Forecast, by Types 2020 & 2033
- Table 23: Global Automated Oxygen Therapy Apparatus Revenue undefined Forecast, by Country 2020 & 2033
- Table 24: Global Automated Oxygen Therapy Apparatus Volume K Forecast, by Country 2020 & 2033
- Table 25: Brazil Automated Oxygen Therapy Apparatus Revenue (undefined) Forecast, by Application 2020 & 2033
- Table 26: Brazil Automated Oxygen Therapy Apparatus Volume (K) Forecast, by Application 2020 & 2033
- Table 27: Argentina Automated Oxygen Therapy Apparatus Revenue (undefined) Forecast, by Application 2020 & 2033
- Table 28: Argentina Automated Oxygen Therapy Apparatus Volume (K) Forecast, by Application 2020 & 2033
- Table 29: Rest of South America Automated Oxygen Therapy Apparatus Revenue (undefined) Forecast, by Application 2020 & 2033
- Table 30: Rest of South America Automated Oxygen Therapy Apparatus Volume (K) Forecast, by Application 2020 & 2033
- Table 31: Global Automated Oxygen Therapy Apparatus Revenue undefined Forecast, by Application 2020 & 2033
- Table 32: Global Automated Oxygen Therapy Apparatus Volume K Forecast, by Application 2020 & 2033
- Table 33: Global Automated Oxygen Therapy Apparatus Revenue undefined Forecast, by Types 2020 & 2033
- Table 34: Global Automated Oxygen Therapy Apparatus Volume K Forecast, by Types 2020 & 2033
- Table 35: Global Automated Oxygen Therapy Apparatus Revenue undefined Forecast, by Country 2020 & 2033
- Table 36: Global Automated Oxygen Therapy Apparatus Volume K Forecast, by Country 2020 & 2033
- Table 37: United Kingdom Automated Oxygen Therapy Apparatus Revenue (undefined) Forecast, by Application 2020 & 2033
- Table 38: United Kingdom Automated Oxygen Therapy Apparatus Volume (K) Forecast, by Application 2020 & 2033
- Table 39: Germany Automated Oxygen Therapy Apparatus Revenue (undefined) Forecast, by Application 2020 & 2033
- Table 40: Germany Automated Oxygen Therapy Apparatus Volume (K) Forecast, by Application 2020 & 2033
- Table 41: France Automated Oxygen Therapy Apparatus Revenue (undefined) Forecast, by Application 2020 & 2033
- Table 42: France Automated Oxygen Therapy Apparatus Volume (K) Forecast, by Application 2020 & 2033
- Table 43: Italy Automated Oxygen Therapy Apparatus Revenue (undefined) Forecast, by Application 2020 & 2033
- Table 44: Italy Automated Oxygen Therapy Apparatus Volume (K) Forecast, by Application 2020 & 2033
- Table 45: Spain Automated Oxygen Therapy Apparatus Revenue (undefined) Forecast, by Application 2020 & 2033
- Table 46: Spain Automated Oxygen Therapy Apparatus Volume (K) Forecast, by Application 2020 & 2033
- Table 47: Russia Automated Oxygen Therapy Apparatus Revenue (undefined) Forecast, by Application 2020 & 2033
- Table 48: Russia Automated Oxygen Therapy Apparatus Volume (K) Forecast, by Application 2020 & 2033
- Table 49: Benelux Automated Oxygen Therapy Apparatus Revenue (undefined) Forecast, by Application 2020 & 2033
- Table 50: Benelux Automated Oxygen Therapy Apparatus Volume (K) Forecast, by Application 2020 & 2033
- Table 51: Nordics Automated Oxygen Therapy Apparatus Revenue (undefined) Forecast, by Application 2020 & 2033
- Table 52: Nordics Automated Oxygen Therapy Apparatus Volume (K) Forecast, by Application 2020 & 2033
- Table 53: Rest of Europe Automated Oxygen Therapy Apparatus Revenue (undefined) Forecast, by Application 2020 & 2033
- Table 54: Rest of Europe Automated Oxygen Therapy Apparatus Volume (K) Forecast, by Application 2020 & 2033
- Table 55: Global Automated Oxygen Therapy Apparatus Revenue undefined Forecast, by Application 2020 & 2033
- Table 56: Global Automated Oxygen Therapy Apparatus Volume K Forecast, by Application 2020 & 2033
- Table 57: Global Automated Oxygen Therapy Apparatus Revenue undefined Forecast, by Types 2020 & 2033
- Table 58: Global Automated Oxygen Therapy Apparatus Volume K Forecast, by Types 2020 & 2033
- Table 59: Global Automated Oxygen Therapy Apparatus Revenue undefined Forecast, by Country 2020 & 2033
- Table 60: Global Automated Oxygen Therapy Apparatus Volume K Forecast, by Country 2020 & 2033
- Table 61: Turkey Automated Oxygen Therapy Apparatus Revenue (undefined) Forecast, by Application 2020 & 2033
- Table 62: Turkey Automated Oxygen Therapy Apparatus Volume (K) Forecast, by Application 2020 & 2033
- Table 63: Israel Automated Oxygen Therapy Apparatus Revenue (undefined) Forecast, by Application 2020 & 2033
- Table 64: Israel Automated Oxygen Therapy Apparatus Volume (K) Forecast, by Application 2020 & 2033
- Table 65: GCC Automated Oxygen Therapy Apparatus Revenue (undefined) Forecast, by Application 2020 & 2033
- Table 66: GCC Automated Oxygen Therapy Apparatus Volume (K) Forecast, by Application 2020 & 2033
- Table 67: North Africa Automated Oxygen Therapy Apparatus Revenue (undefined) Forecast, by Application 2020 & 2033
- Table 68: North Africa Automated Oxygen Therapy Apparatus Volume (K) Forecast, by Application 2020 & 2033
- Table 69: South Africa Automated Oxygen Therapy Apparatus Revenue (undefined) Forecast, by Application 2020 & 2033
- Table 70: South Africa Automated Oxygen Therapy Apparatus Volume (K) Forecast, by Application 2020 & 2033
- Table 71: Rest of Middle East & Africa Automated Oxygen Therapy Apparatus Revenue (undefined) Forecast, by Application 2020 & 2033
- Table 72: Rest of Middle East & Africa Automated Oxygen Therapy Apparatus Volume (K) Forecast, by Application 2020 & 2033
- Table 73: Global Automated Oxygen Therapy Apparatus Revenue undefined Forecast, by Application 2020 & 2033
- Table 74: Global Automated Oxygen Therapy Apparatus Volume K Forecast, by Application 2020 & 2033
- Table 75: Global Automated Oxygen Therapy Apparatus Revenue undefined Forecast, by Types 2020 & 2033
- Table 76: Global Automated Oxygen Therapy Apparatus Volume K Forecast, by Types 2020 & 2033
- Table 77: Global Automated Oxygen Therapy Apparatus Revenue undefined Forecast, by Country 2020 & 2033
- Table 78: Global Automated Oxygen Therapy Apparatus Volume K Forecast, by Country 2020 & 2033
- Table 79: China Automated Oxygen Therapy Apparatus Revenue (undefined) Forecast, by Application 2020 & 2033
- Table 80: China Automated Oxygen Therapy Apparatus Volume (K) Forecast, by Application 2020 & 2033
- Table 81: India Automated Oxygen Therapy Apparatus Revenue (undefined) Forecast, by Application 2020 & 2033
- Table 82: India Automated Oxygen Therapy Apparatus Volume (K) Forecast, by Application 2020 & 2033
- Table 83: Japan Automated Oxygen Therapy Apparatus Revenue (undefined) Forecast, by Application 2020 & 2033
- Table 84: Japan Automated Oxygen Therapy Apparatus Volume (K) Forecast, by Application 2020 & 2033
- Table 85: South Korea Automated Oxygen Therapy Apparatus Revenue (undefined) Forecast, by Application 2020 & 2033
- Table 86: South Korea Automated Oxygen Therapy Apparatus Volume (K) Forecast, by Application 2020 & 2033
- Table 87: ASEAN Automated Oxygen Therapy Apparatus Revenue (undefined) Forecast, by Application 2020 & 2033
- Table 88: ASEAN Automated Oxygen Therapy Apparatus Volume (K) Forecast, by Application 2020 & 2033
- Table 89: Oceania Automated Oxygen Therapy Apparatus Revenue (undefined) Forecast, by Application 2020 & 2033
- Table 90: Oceania Automated Oxygen Therapy Apparatus Volume (K) Forecast, by Application 2020 & 2033
- Table 91: Rest of Asia Pacific Automated Oxygen Therapy Apparatus Revenue (undefined) Forecast, by Application 2020 & 2033
- Table 92: Rest of Asia Pacific Automated Oxygen Therapy Apparatus Volume (K) Forecast, by Application 2020 & 2033
Frequently Asked Questions
1. What is the projected Compound Annual Growth Rate (CAGR) of the Automated Oxygen Therapy Apparatus?
The projected CAGR is approximately 7.89%.
2. Which companies are prominent players in the Automated Oxygen Therapy Apparatus?
Key companies in the market include Vygon, Allied Healthcare Products, Inc., Inspiration Healthcare, DeVilbiss Healthcare, Fisher & Paykel Healthcare, Invacare, Philips, CareFusion, GCE Healthcare, GE Healthcare, Inogen, Smiths Medical.
3. What are the main segments of the Automated Oxygen Therapy Apparatus?
The market segments include Application, Types.
4. Can you provide details about the market size?
The market size is estimated to be USD XXX N/A as of 2022.
5. What are some drivers contributing to market growth?
N/A
6. What are the notable trends driving market growth?
N/A
7. Are there any restraints impacting market growth?
N/A
8. Can you provide examples of recent developments in the market?
N/A
9. What pricing options are available for accessing the report?
Pricing options include single-user, multi-user, and enterprise licenses priced at USD 3950.00, USD 5925.00, and USD 7900.00 respectively.
10. Is the market size provided in terms of value or volume?
The market size is provided in terms of value, measured in N/A and volume, measured in K.
11. Are there any specific market keywords associated with the report?
Yes, the market keyword associated with the report is "Automated Oxygen Therapy Apparatus," which aids in identifying and referencing the specific market segment covered.
12. How do I determine which pricing option suits my needs best?
The pricing options vary based on user requirements and access needs. Individual users may opt for single-user licenses, while businesses requiring broader access may choose multi-user or enterprise licenses for cost-effective access to the report.
13. Are there any additional resources or data provided in the Automated Oxygen Therapy Apparatus report?
While the report offers comprehensive insights, it's advisable to review the specific contents or supplementary materials provided to ascertain if additional resources or data are available.
14. How can I stay updated on further developments or reports in the Automated Oxygen Therapy Apparatus?
To stay informed about further developments, trends, and reports in the Automated Oxygen Therapy Apparatus, consider subscribing to industry newsletters, following relevant companies and organizations, or regularly checking reputable industry news sources and publications.
Methodology
Step 1 - Identification of Relevant Samples Size from Population Database


Step 2 - Approaches for Defining Global Market Size (Value, Volume* & Price*)

Note*: In applicable scenarios
Step 3 - Data Sources
Primary Research
- Web Analytics
- Survey Reports
- Research Institute
- Latest Research Reports
- Opinion Leaders
Secondary Research
- Annual Reports
- White Paper
- Latest Press Release
- Industry Association
- Paid Database
- Investor Presentations

Step 4 - Data Triangulation
Involves using different sources of information in order to increase the validity of a study
These sources are likely to be stakeholders in a program - participants, other researchers, program staff, other community members, and so on.
Then we put all data in single framework & apply various statistical tools to find out the dynamic on the market.
During the analysis stage, feedback from the stakeholder groups would be compared to determine areas of agreement as well as areas of divergence