

Key Insights
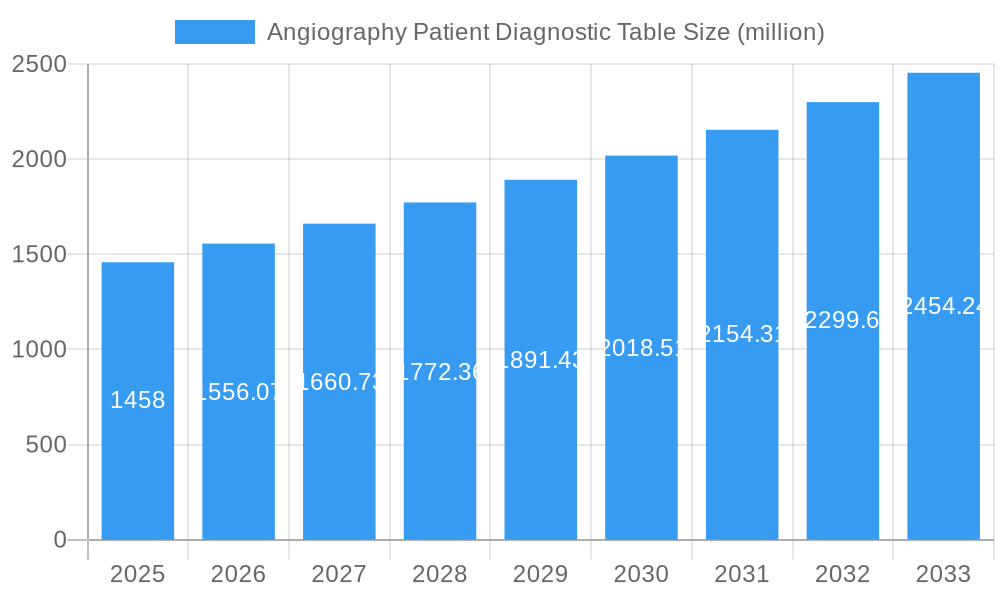
The Angiography Patient Diagnostic Table market, valued at $1458 million in 2025, is projected to experience robust growth, driven by several key factors. The increasing prevalence of cardiovascular diseases globally necessitates advanced diagnostic procedures, fueling demand for high-quality angiography tables. Technological advancements, such as integration of advanced imaging technologies and improved patient comfort features, are also significantly contributing to market expansion. Furthermore, the rising number of minimally invasive procedures and a growing preference for advanced diagnostic techniques within healthcare facilities are creating lucrative growth opportunities. The market is segmented by product type (e.g., fixed, mobile), application (e.g., cardiac catheterization, neurovascular interventions), and end-user (hospitals, ambulatory surgical centers). Competitive rivalry is moderate, with established players like STERIS and companies like AADCO Medical, Infimed, and Medifa contributing to market innovation. However, high initial investment costs and the need for skilled professionals to operate these sophisticated tables could potentially restrain market growth to some extent. The forecast period of 2025-2033 anticipates a sustained CAGR of 6.5%, indicating a promising outlook for market participants.
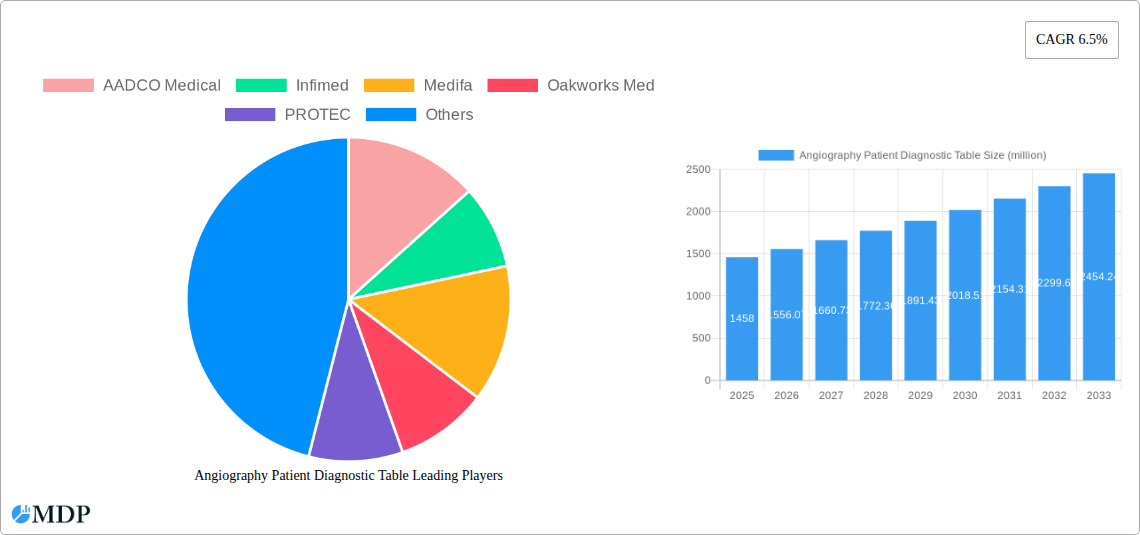
Angiography Patient Diagnostic Table Market Size (In Billion)
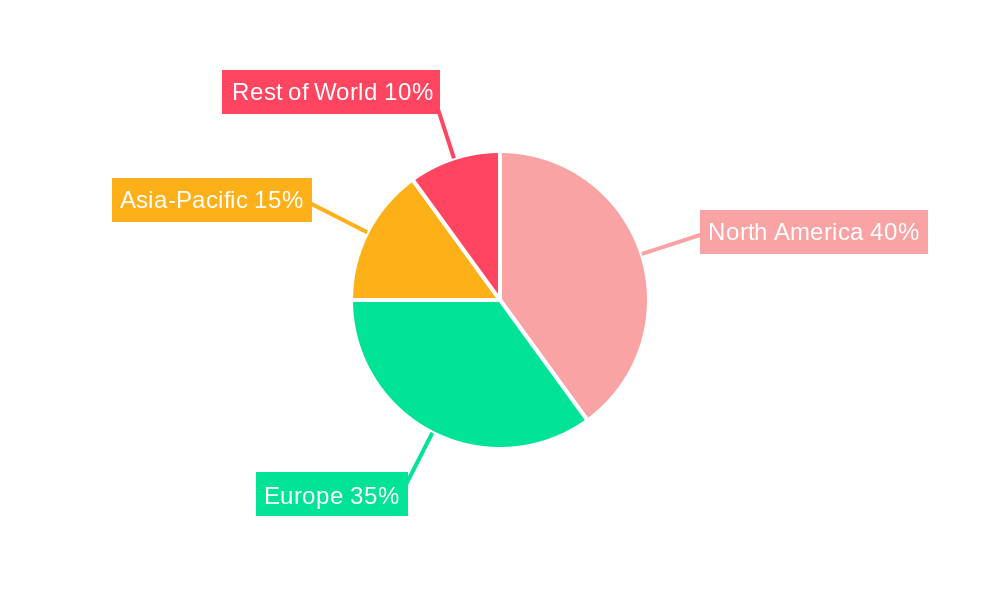
Continued growth in the Angiography Patient Diagnostic Table market is expected to be geographically diverse, with North America and Europe likely to maintain significant market shares due to their well-established healthcare infrastructure and high adoption rates of advanced medical technologies. However, emerging economies in Asia-Pacific and Latin America are projected to exhibit faster growth rates due to increasing healthcare expenditure and rising awareness of cardiovascular health. The focus on improving patient outcomes through enhanced table design, improved ergonomics, and advanced imaging capabilities will continue to drive product innovation and market expansion. Strategic collaborations and mergers and acquisitions are likely to shape the competitive landscape, leading to further consolidation in the coming years. Furthermore, the increasing adoption of telehealth and remote patient monitoring technologies may indirectly influence market dynamics through enhanced data integration and improved diagnostic accuracy.
Angiography Patient Diagnostic Table Company Market Share
Angiography Patient Diagnostic Table Market Report: 2019-2033
This comprehensive report provides a detailed analysis of the Angiography Patient Diagnostic Table market, offering invaluable insights for industry stakeholders, investors, and strategic decision-makers. The study covers the period from 2019 to 2033, with a focus on the estimated year 2025 and a forecast period of 2025-2033. The report utilizes millions as the unit for all values.
Angiography Patient Diagnostic Table Market Dynamics & Concentration
This section analyzes the competitive landscape of the Angiography Patient Diagnostic Table market, examining market concentration, innovation drivers, regulatory frameworks, product substitutes, end-user trends, and M&A activities. The global market size in 2025 is estimated at $XX million. Market concentration is currently moderate, with the top 5 players holding approximately XX% of the market share.
Key Dynamics:
- Innovation Drivers: Advancements in imaging technology, miniaturization of components, and improved ergonomics are driving innovation.
- Regulatory Frameworks: Stringent regulatory approvals and safety standards influence market growth and entry barriers.
- Product Substitutes: The market faces competition from alternative diagnostic techniques, impacting market penetration.
- End-User Trends: Increasing prevalence of cardiovascular diseases and a rising elderly population are key growth drivers.
- M&A Activities: Over the historical period (2019-2024), approximately XX M&A deals were recorded, indicating consolidation within the market. These deals primarily focused on expanding product portfolios and geographical reach.
Angiography Patient Diagnostic Table Industry Trends & Analysis
The Angiography Patient Diagnostic Table market exhibits robust growth, with a projected Compound Annual Growth Rate (CAGR) of XX% during the forecast period (2025-2033). This growth is fueled by several factors:
- Technological Disruptions: The integration of AI and machine learning in image analysis is revolutionizing diagnostic accuracy and efficiency.
- Market Growth Drivers: Rising prevalence of cardiovascular diseases, increasing demand for minimally invasive procedures, and improved healthcare infrastructure are key drivers.
- Consumer Preferences: Patients increasingly prefer less invasive procedures with faster recovery times, driving market demand.
- Competitive Dynamics: The market is characterized by intense competition among established players and emerging entrants, fostering innovation and price optimization. Market penetration is expected to reach XX% by 2033.
Leading Markets & Segments in Angiography Patient Diagnostic Table
The North American region dominates the Angiography Patient Diagnostic Table market, accounting for approximately XX% of the global market in 2025. This dominance is attributed to several factors:
- Key Drivers:
- Advanced healthcare infrastructure
- High adoption rate of advanced medical technologies
- Favorable reimbursement policies
- Strong research and development activities
The analysis indicates that the segment of tables designed for specific angiography procedures (e.g., coronary angiography) represents a significant portion of the market, projected at $XX million in 2025.
Angiography Patient Diagnostic Table Product Developments
Recent advancements include the integration of advanced imaging capabilities, improved patient comfort features, and enhanced durability. These innovations provide competitive advantages by improving diagnostic accuracy, reducing procedural time, and enhancing patient experience. The focus on modular designs and customizable features caters to diverse clinical needs.
Key Drivers of Angiography Patient Diagnostic Table Growth
Technological advancements, economic factors, and regulatory changes are key growth accelerators:
- Technological Advancements: AI-powered image analysis and improved imaging sensors are enhancing diagnostic capabilities.
- Economic Factors: Increasing healthcare expenditure and favorable reimbursement policies support market growth.
- Regulatory Changes: Supportive regulatory frameworks encourage innovation and market expansion.
Challenges in the Angiography Patient Diagnostic Table Market
Several factors hinder market growth:
- Regulatory Hurdles: Stringent regulatory approvals and compliance requirements increase the cost and time to market for new products. This adds approximately $XX million annually in compliance costs for manufacturers.
- Supply Chain Issues: Disruptions to global supply chains can impact product availability and pricing. This has caused an estimated XX% increase in production costs over the last year.
- Competitive Pressures: Intense competition among established players and new entrants leads to price pressure and reduced profit margins.
Emerging Opportunities in Angiography Patient Diagnostic Table
Long-term growth is fueled by:
- Technological Breakthroughs: The development of advanced imaging technologies and AI-driven diagnostic tools offers significant growth potential.
- Strategic Partnerships: Collaborations between manufacturers and healthcare providers are driving market expansion.
- Market Expansion: Penetration in emerging markets with growing healthcare infrastructure offers untapped opportunities.
Leading Players in the Angiography Patient Diagnostic Table Sector
- AADCO Medical
- Infimed
- Medifa
- Oakworks Med
- PROTEC
- Schaerer Medical
- STERIS
- STILLE
- Technix
- Young Il M
- ALVO Medical
- BIODEX
- CONTROL-X Medical
- Creomedical
- EMD Medical Technologies
- Eurocolumbus
Key Milestones in Angiography Patient Diagnostic Table Industry
- 2020: Introduction of AI-powered image analysis software by a major player.
- 2022: Launch of a new, ergonomically designed angiography table by a leading manufacturer.
- 2023: Acquisition of a smaller company specializing in angiography accessories by a large multinational corporation.
- 2024: Publication of key clinical trials demonstrating the efficacy of advanced imaging technologies.
Strategic Outlook for Angiography Patient Diagnostic Table Market
The Angiography Patient Diagnostic Table market is poised for significant growth, driven by technological innovation, favorable regulatory environments, and the increasing demand for advanced diagnostic solutions. Strategic partnerships, focused product development, and expansion into emerging markets will be key success factors for players in this dynamic sector. The market is expected to reach $XX million by 2033, representing significant growth opportunities for industry participants.
Angiography Patient Diagnostic Table Segmentation
-
1. Application
- 1.1. Hospital
- 1.2. Research Center
- 1.3. Clinic
-
2. Types
- 2.1. Mobile
- 2.2. Floor-Standing
Angiography Patient Diagnostic Table Segmentation By Geography
-
1. North America
- 1.1. United States
- 1.2. Canada
- 1.3. Mexico
-
2. South America
- 2.1. Brazil
- 2.2. Argentina
- 2.3. Rest of South America
-
3. Europe
- 3.1. United Kingdom
- 3.2. Germany
- 3.3. France
- 3.4. Italy
- 3.5. Spain
- 3.6. Russia
- 3.7. Benelux
- 3.8. Nordics
- 3.9. Rest of Europe
-
4. Middle East & Africa
- 4.1. Turkey
- 4.2. Israel
- 4.3. GCC
- 4.4. North Africa
- 4.5. South Africa
- 4.6. Rest of Middle East & Africa
-
5. Asia Pacific
- 5.1. China
- 5.2. India
- 5.3. Japan
- 5.4. South Korea
- 5.5. ASEAN
- 5.6. Oceania
- 5.7. Rest of Asia Pacific
Angiography Patient Diagnostic Table Regional Market Share
Geographic Coverage of Angiography Patient Diagnostic Table
Angiography Patient Diagnostic Table REPORT HIGHLIGHTS
| Aspects | Details |
|---|---|
| Study Period | 2020-2034 |
| Base Year | 2025 |
| Estimated Year | 2026 |
| Forecast Period | 2026-2034 |
| Historical Period | 2020-2025 |
| Growth Rate | CAGR of 6.5% from 2020-2034 |
| Segmentation |
|
Table of Contents
- 1. Introduction
- 1.1. Research Scope
- 1.2. Market Segmentation
- 1.3. Research Objective
- 1.4. Definitions and Assumptions
- 2. Executive Summary
- 2.1. Market Snapshot
- 3. Market Dynamics
- 3.1. Market Drivers
- 3.2. Market Restrains
- 3.3. Market Trends
- 3.4. Market Opportunities
- 4. Market Factor Analysis
- 4.1. Porters Five Forces
- 4.1.1. Bargaining Power of Suppliers
- 4.1.2. Bargaining Power of Buyers
- 4.1.3. Threat of New Entrants
- 4.1.4. Threat of Substitutes
- 4.1.5. Competitive Rivalry
- 4.2. PESTEL analysis
- 4.3. BCG Analysis
- 4.3.1. Stars (High Growth, High Market Share)
- 4.3.2. Cash Cows (Low Growth, High Market Share)
- 4.3.3. Question Mark (High Growth, Low Market Share)
- 4.3.4. Dogs (Low Growth, Low Market Share)
- 4.4. Ansoff Matrix Analysis
- 4.5. Supply Chain Analysis
- 4.6. Regulatory Landscape
- 4.7. Current Market Potential and Opportunity Assessment (TAM–SAM–SOM Framework)
- 4.8. MDP Analyst Note
- 4.1. Porters Five Forces
- 5. Market Analysis, Insights and Forecast 2021-2033
- 5.1. Market Analysis, Insights and Forecast - by Application
- 5.1.1. Hospital
- 5.1.2. Research Center
- 5.1.3. Clinic
- 5.2. Market Analysis, Insights and Forecast - by Types
- 5.2.1. Mobile
- 5.2.2. Floor-Standing
- 5.3. Market Analysis, Insights and Forecast - by Region
- 5.3.1. North America
- 5.3.2. South America
- 5.3.3. Europe
- 5.3.4. Middle East & Africa
- 5.3.5. Asia Pacific
- 5.1. Market Analysis, Insights and Forecast - by Application
- 6. Global Angiography Patient Diagnostic Table Analysis, Insights and Forecast, 2021-2033
- 6.1. Market Analysis, Insights and Forecast - by Application
- 6.1.1. Hospital
- 6.1.2. Research Center
- 6.1.3. Clinic
- 6.2. Market Analysis, Insights and Forecast - by Types
- 6.2.1. Mobile
- 6.2.2. Floor-Standing
- 6.1. Market Analysis, Insights and Forecast - by Application
- 7. North America Angiography Patient Diagnostic Table Analysis, Insights and Forecast, 2020-2032
- 7.1. Market Analysis, Insights and Forecast - by Application
- 7.1.1. Hospital
- 7.1.2. Research Center
- 7.1.3. Clinic
- 7.2. Market Analysis, Insights and Forecast - by Types
- 7.2.1. Mobile
- 7.2.2. Floor-Standing
- 7.1. Market Analysis, Insights and Forecast - by Application
- 8. South America Angiography Patient Diagnostic Table Analysis, Insights and Forecast, 2020-2032
- 8.1. Market Analysis, Insights and Forecast - by Application
- 8.1.1. Hospital
- 8.1.2. Research Center
- 8.1.3. Clinic
- 8.2. Market Analysis, Insights and Forecast - by Types
- 8.2.1. Mobile
- 8.2.2. Floor-Standing
- 8.1. Market Analysis, Insights and Forecast - by Application
- 9. Europe Angiography Patient Diagnostic Table Analysis, Insights and Forecast, 2020-2032
- 9.1. Market Analysis, Insights and Forecast - by Application
- 9.1.1. Hospital
- 9.1.2. Research Center
- 9.1.3. Clinic
- 9.2. Market Analysis, Insights and Forecast - by Types
- 9.2.1. Mobile
- 9.2.2. Floor-Standing
- 9.1. Market Analysis, Insights and Forecast - by Application
- 10. Middle East & Africa Angiography Patient Diagnostic Table Analysis, Insights and Forecast, 2020-2032
- 10.1. Market Analysis, Insights and Forecast - by Application
- 10.1.1. Hospital
- 10.1.2. Research Center
- 10.1.3. Clinic
- 10.2. Market Analysis, Insights and Forecast - by Types
- 10.2.1. Mobile
- 10.2.2. Floor-Standing
- 10.1. Market Analysis, Insights and Forecast - by Application
- 11. Asia Pacific Angiography Patient Diagnostic Table Analysis, Insights and Forecast, 2020-2032
- 11.1. Market Analysis, Insights and Forecast - by Application
- 11.1.1. Hospital
- 11.1.2. Research Center
- 11.1.3. Clinic
- 11.2. Market Analysis, Insights and Forecast - by Types
- 11.2.1. Mobile
- 11.2.2. Floor-Standing
- 11.1. Market Analysis, Insights and Forecast - by Application
- 12. Competitive Analysis
- 12.1. Company Profiles
- 12.1.1 AADCO Medical
- 12.1.1.1. Company Overview
- 12.1.1.2. Products
- 12.1.1.3. Company Financials
- 12.1.1.4. SWOT Analysis
- 12.1.2 Infimed
- 12.1.2.1. Company Overview
- 12.1.2.2. Products
- 12.1.2.3. Company Financials
- 12.1.2.4. SWOT Analysis
- 12.1.3 Medifa
- 12.1.3.1. Company Overview
- 12.1.3.2. Products
- 12.1.3.3. Company Financials
- 12.1.3.4. SWOT Analysis
- 12.1.4 Oakworks Med
- 12.1.4.1. Company Overview
- 12.1.4.2. Products
- 12.1.4.3. Company Financials
- 12.1.4.4. SWOT Analysis
- 12.1.5 PROTEC
- 12.1.5.1. Company Overview
- 12.1.5.2. Products
- 12.1.5.3. Company Financials
- 12.1.5.4. SWOT Analysis
- 12.1.6 Schaerer Medical
- 12.1.6.1. Company Overview
- 12.1.6.2. Products
- 12.1.6.3. Company Financials
- 12.1.6.4. SWOT Analysis
- 12.1.7 STERIS
- 12.1.7.1. Company Overview
- 12.1.7.2. Products
- 12.1.7.3. Company Financials
- 12.1.7.4. SWOT Analysis
- 12.1.8 STILLE
- 12.1.8.1. Company Overview
- 12.1.8.2. Products
- 12.1.8.3. Company Financials
- 12.1.8.4. SWOT Analysis
- 12.1.9 Technix
- 12.1.9.1. Company Overview
- 12.1.9.2. Products
- 12.1.9.3. Company Financials
- 12.1.9.4. SWOT Analysis
- 12.1.10 Young Il M
- 12.1.10.1. Company Overview
- 12.1.10.2. Products
- 12.1.10.3. Company Financials
- 12.1.10.4. SWOT Analysis
- 12.1.11 ALVO Medical
- 12.1.11.1. Company Overview
- 12.1.11.2. Products
- 12.1.11.3. Company Financials
- 12.1.11.4. SWOT Analysis
- 12.1.12 BIODEX
- 12.1.12.1. Company Overview
- 12.1.12.2. Products
- 12.1.12.3. Company Financials
- 12.1.12.4. SWOT Analysis
- 12.1.13 CONTROL-X Medical
- 12.1.13.1. Company Overview
- 12.1.13.2. Products
- 12.1.13.3. Company Financials
- 12.1.13.4. SWOT Analysis
- 12.1.14 Creomedical
- 12.1.14.1. Company Overview
- 12.1.14.2. Products
- 12.1.14.3. Company Financials
- 12.1.14.4. SWOT Analysis
- 12.1.15 EMD Medical Technologies
- 12.1.15.1. Company Overview
- 12.1.15.2. Products
- 12.1.15.3. Company Financials
- 12.1.15.4. SWOT Analysis
- 12.1.16 Eurocolumbus
- 12.1.16.1. Company Overview
- 12.1.16.2. Products
- 12.1.16.3. Company Financials
- 12.1.16.4. SWOT Analysis
- 12.1.1 AADCO Medical
- 12.2. Market Entropy
- 12.2.1 Company's Key Areas Served
- 12.2.2 Recent Developments
- 12.3. Company Market Share Analysis 2025
- 12.3.1 Top 5 Companies Market Share Analysis
- 12.3.2 Top 3 Companies Market Share Analysis
- 12.4. List of Potential Customers
- 13. Research Methodology
List of Figures
- Figure 1: Global Angiography Patient Diagnostic Table Revenue Breakdown (million, %) by Region 2025 & 2033
- Figure 2: North America Angiography Patient Diagnostic Table Revenue (million), by Application 2025 & 2033
- Figure 3: North America Angiography Patient Diagnostic Table Revenue Share (%), by Application 2025 & 2033
- Figure 4: North America Angiography Patient Diagnostic Table Revenue (million), by Types 2025 & 2033
- Figure 5: North America Angiography Patient Diagnostic Table Revenue Share (%), by Types 2025 & 2033
- Figure 6: North America Angiography Patient Diagnostic Table Revenue (million), by Country 2025 & 2033
- Figure 7: North America Angiography Patient Diagnostic Table Revenue Share (%), by Country 2025 & 2033
- Figure 8: South America Angiography Patient Diagnostic Table Revenue (million), by Application 2025 & 2033
- Figure 9: South America Angiography Patient Diagnostic Table Revenue Share (%), by Application 2025 & 2033
- Figure 10: South America Angiography Patient Diagnostic Table Revenue (million), by Types 2025 & 2033
- Figure 11: South America Angiography Patient Diagnostic Table Revenue Share (%), by Types 2025 & 2033
- Figure 12: South America Angiography Patient Diagnostic Table Revenue (million), by Country 2025 & 2033
- Figure 13: South America Angiography Patient Diagnostic Table Revenue Share (%), by Country 2025 & 2033
- Figure 14: Europe Angiography Patient Diagnostic Table Revenue (million), by Application 2025 & 2033
- Figure 15: Europe Angiography Patient Diagnostic Table Revenue Share (%), by Application 2025 & 2033
- Figure 16: Europe Angiography Patient Diagnostic Table Revenue (million), by Types 2025 & 2033
- Figure 17: Europe Angiography Patient Diagnostic Table Revenue Share (%), by Types 2025 & 2033
- Figure 18: Europe Angiography Patient Diagnostic Table Revenue (million), by Country 2025 & 2033
- Figure 19: Europe Angiography Patient Diagnostic Table Revenue Share (%), by Country 2025 & 2033
- Figure 20: Middle East & Africa Angiography Patient Diagnostic Table Revenue (million), by Application 2025 & 2033
- Figure 21: Middle East & Africa Angiography Patient Diagnostic Table Revenue Share (%), by Application 2025 & 2033
- Figure 22: Middle East & Africa Angiography Patient Diagnostic Table Revenue (million), by Types 2025 & 2033
- Figure 23: Middle East & Africa Angiography Patient Diagnostic Table Revenue Share (%), by Types 2025 & 2033
- Figure 24: Middle East & Africa Angiography Patient Diagnostic Table Revenue (million), by Country 2025 & 2033
- Figure 25: Middle East & Africa Angiography Patient Diagnostic Table Revenue Share (%), by Country 2025 & 2033
- Figure 26: Asia Pacific Angiography Patient Diagnostic Table Revenue (million), by Application 2025 & 2033
- Figure 27: Asia Pacific Angiography Patient Diagnostic Table Revenue Share (%), by Application 2025 & 2033
- Figure 28: Asia Pacific Angiography Patient Diagnostic Table Revenue (million), by Types 2025 & 2033
- Figure 29: Asia Pacific Angiography Patient Diagnostic Table Revenue Share (%), by Types 2025 & 2033
- Figure 30: Asia Pacific Angiography Patient Diagnostic Table Revenue (million), by Country 2025 & 2033
- Figure 31: Asia Pacific Angiography Patient Diagnostic Table Revenue Share (%), by Country 2025 & 2033
List of Tables
- Table 1: Global Angiography Patient Diagnostic Table Revenue million Forecast, by Application 2020 & 2033
- Table 2: Global Angiography Patient Diagnostic Table Revenue million Forecast, by Types 2020 & 2033
- Table 3: Global Angiography Patient Diagnostic Table Revenue million Forecast, by Region 2020 & 2033
- Table 4: Global Angiography Patient Diagnostic Table Revenue million Forecast, by Application 2020 & 2033
- Table 5: Global Angiography Patient Diagnostic Table Revenue million Forecast, by Types 2020 & 2033
- Table 6: Global Angiography Patient Diagnostic Table Revenue million Forecast, by Country 2020 & 2033
- Table 7: United States Angiography Patient Diagnostic Table Revenue (million) Forecast, by Application 2020 & 2033
- Table 8: Canada Angiography Patient Diagnostic Table Revenue (million) Forecast, by Application 2020 & 2033
- Table 9: Mexico Angiography Patient Diagnostic Table Revenue (million) Forecast, by Application 2020 & 2033
- Table 10: Global Angiography Patient Diagnostic Table Revenue million Forecast, by Application 2020 & 2033
- Table 11: Global Angiography Patient Diagnostic Table Revenue million Forecast, by Types 2020 & 2033
- Table 12: Global Angiography Patient Diagnostic Table Revenue million Forecast, by Country 2020 & 2033
- Table 13: Brazil Angiography Patient Diagnostic Table Revenue (million) Forecast, by Application 2020 & 2033
- Table 14: Argentina Angiography Patient Diagnostic Table Revenue (million) Forecast, by Application 2020 & 2033
- Table 15: Rest of South America Angiography Patient Diagnostic Table Revenue (million) Forecast, by Application 2020 & 2033
- Table 16: Global Angiography Patient Diagnostic Table Revenue million Forecast, by Application 2020 & 2033
- Table 17: Global Angiography Patient Diagnostic Table Revenue million Forecast, by Types 2020 & 2033
- Table 18: Global Angiography Patient Diagnostic Table Revenue million Forecast, by Country 2020 & 2033
- Table 19: United Kingdom Angiography Patient Diagnostic Table Revenue (million) Forecast, by Application 2020 & 2033
- Table 20: Germany Angiography Patient Diagnostic Table Revenue (million) Forecast, by Application 2020 & 2033
- Table 21: France Angiography Patient Diagnostic Table Revenue (million) Forecast, by Application 2020 & 2033
- Table 22: Italy Angiography Patient Diagnostic Table Revenue (million) Forecast, by Application 2020 & 2033
- Table 23: Spain Angiography Patient Diagnostic Table Revenue (million) Forecast, by Application 2020 & 2033
- Table 24: Russia Angiography Patient Diagnostic Table Revenue (million) Forecast, by Application 2020 & 2033
- Table 25: Benelux Angiography Patient Diagnostic Table Revenue (million) Forecast, by Application 2020 & 2033
- Table 26: Nordics Angiography Patient Diagnostic Table Revenue (million) Forecast, by Application 2020 & 2033
- Table 27: Rest of Europe Angiography Patient Diagnostic Table Revenue (million) Forecast, by Application 2020 & 2033
- Table 28: Global Angiography Patient Diagnostic Table Revenue million Forecast, by Application 2020 & 2033
- Table 29: Global Angiography Patient Diagnostic Table Revenue million Forecast, by Types 2020 & 2033
- Table 30: Global Angiography Patient Diagnostic Table Revenue million Forecast, by Country 2020 & 2033
- Table 31: Turkey Angiography Patient Diagnostic Table Revenue (million) Forecast, by Application 2020 & 2033
- Table 32: Israel Angiography Patient Diagnostic Table Revenue (million) Forecast, by Application 2020 & 2033
- Table 33: GCC Angiography Patient Diagnostic Table Revenue (million) Forecast, by Application 2020 & 2033
- Table 34: North Africa Angiography Patient Diagnostic Table Revenue (million) Forecast, by Application 2020 & 2033
- Table 35: South Africa Angiography Patient Diagnostic Table Revenue (million) Forecast, by Application 2020 & 2033
- Table 36: Rest of Middle East & Africa Angiography Patient Diagnostic Table Revenue (million) Forecast, by Application 2020 & 2033
- Table 37: Global Angiography Patient Diagnostic Table Revenue million Forecast, by Application 2020 & 2033
- Table 38: Global Angiography Patient Diagnostic Table Revenue million Forecast, by Types 2020 & 2033
- Table 39: Global Angiography Patient Diagnostic Table Revenue million Forecast, by Country 2020 & 2033
- Table 40: China Angiography Patient Diagnostic Table Revenue (million) Forecast, by Application 2020 & 2033
- Table 41: India Angiography Patient Diagnostic Table Revenue (million) Forecast, by Application 2020 & 2033
- Table 42: Japan Angiography Patient Diagnostic Table Revenue (million) Forecast, by Application 2020 & 2033
- Table 43: South Korea Angiography Patient Diagnostic Table Revenue (million) Forecast, by Application 2020 & 2033
- Table 44: ASEAN Angiography Patient Diagnostic Table Revenue (million) Forecast, by Application 2020 & 2033
- Table 45: Oceania Angiography Patient Diagnostic Table Revenue (million) Forecast, by Application 2020 & 2033
- Table 46: Rest of Asia Pacific Angiography Patient Diagnostic Table Revenue (million) Forecast, by Application 2020 & 2033
Frequently Asked Questions
1. What is the projected Compound Annual Growth Rate (CAGR) of the Angiography Patient Diagnostic Table?
The projected CAGR is approximately 6.5%.
2. Which companies are prominent players in the Angiography Patient Diagnostic Table?
Key companies in the market include AADCO Medical, Infimed, Medifa, Oakworks Med, PROTEC, Schaerer Medical, STERIS, STILLE, Technix, Young Il M, ALVO Medical, BIODEX, CONTROL-X Medical, Creomedical, EMD Medical Technologies, Eurocolumbus.
3. What are the main segments of the Angiography Patient Diagnostic Table?
The market segments include Application, Types.
4. Can you provide details about the market size?
The market size is estimated to be USD 1458 million as of 2022.
5. What are some drivers contributing to market growth?
N/A
6. What are the notable trends driving market growth?
N/A
7. Are there any restraints impacting market growth?
N/A
8. Can you provide examples of recent developments in the market?
N/A
9. What pricing options are available for accessing the report?
Pricing options include single-user, multi-user, and enterprise licenses priced at USD 2900.00, USD 4350.00, and USD 5800.00 respectively.
10. Is the market size provided in terms of value or volume?
The market size is provided in terms of value, measured in million.
11. Are there any specific market keywords associated with the report?
Yes, the market keyword associated with the report is "Angiography Patient Diagnostic Table," which aids in identifying and referencing the specific market segment covered.
12. How do I determine which pricing option suits my needs best?
The pricing options vary based on user requirements and access needs. Individual users may opt for single-user licenses, while businesses requiring broader access may choose multi-user or enterprise licenses for cost-effective access to the report.
13. Are there any additional resources or data provided in the Angiography Patient Diagnostic Table report?
While the report offers comprehensive insights, it's advisable to review the specific contents or supplementary materials provided to ascertain if additional resources or data are available.
14. How can I stay updated on further developments or reports in the Angiography Patient Diagnostic Table?
To stay informed about further developments, trends, and reports in the Angiography Patient Diagnostic Table, consider subscribing to industry newsletters, following relevant companies and organizations, or regularly checking reputable industry news sources and publications.
Methodology
Step 1 - Identification of Relevant Samples Size from Population Database


Step 2 - Approaches for Defining Global Market Size (Value, Volume* & Price*)

Note*: In applicable scenarios
Step 3 - Data Sources
Primary Research
- Web Analytics
- Survey Reports
- Research Institute
- Latest Research Reports
- Opinion Leaders
Secondary Research
- Annual Reports
- White Paper
- Latest Press Release
- Industry Association
- Paid Database
- Investor Presentations

Step 4 - Data Triangulation
Involves using different sources of information in order to increase the validity of a study
These sources are likely to be stakeholders in a program - participants, other researchers, program staff, other community members, and so on.
Then we put all data in single framework & apply various statistical tools to find out the dynamic on the market.
During the analysis stage, feedback from the stakeholder groups would be compared to determine areas of agreement as well as areas of divergence