

Key Insights
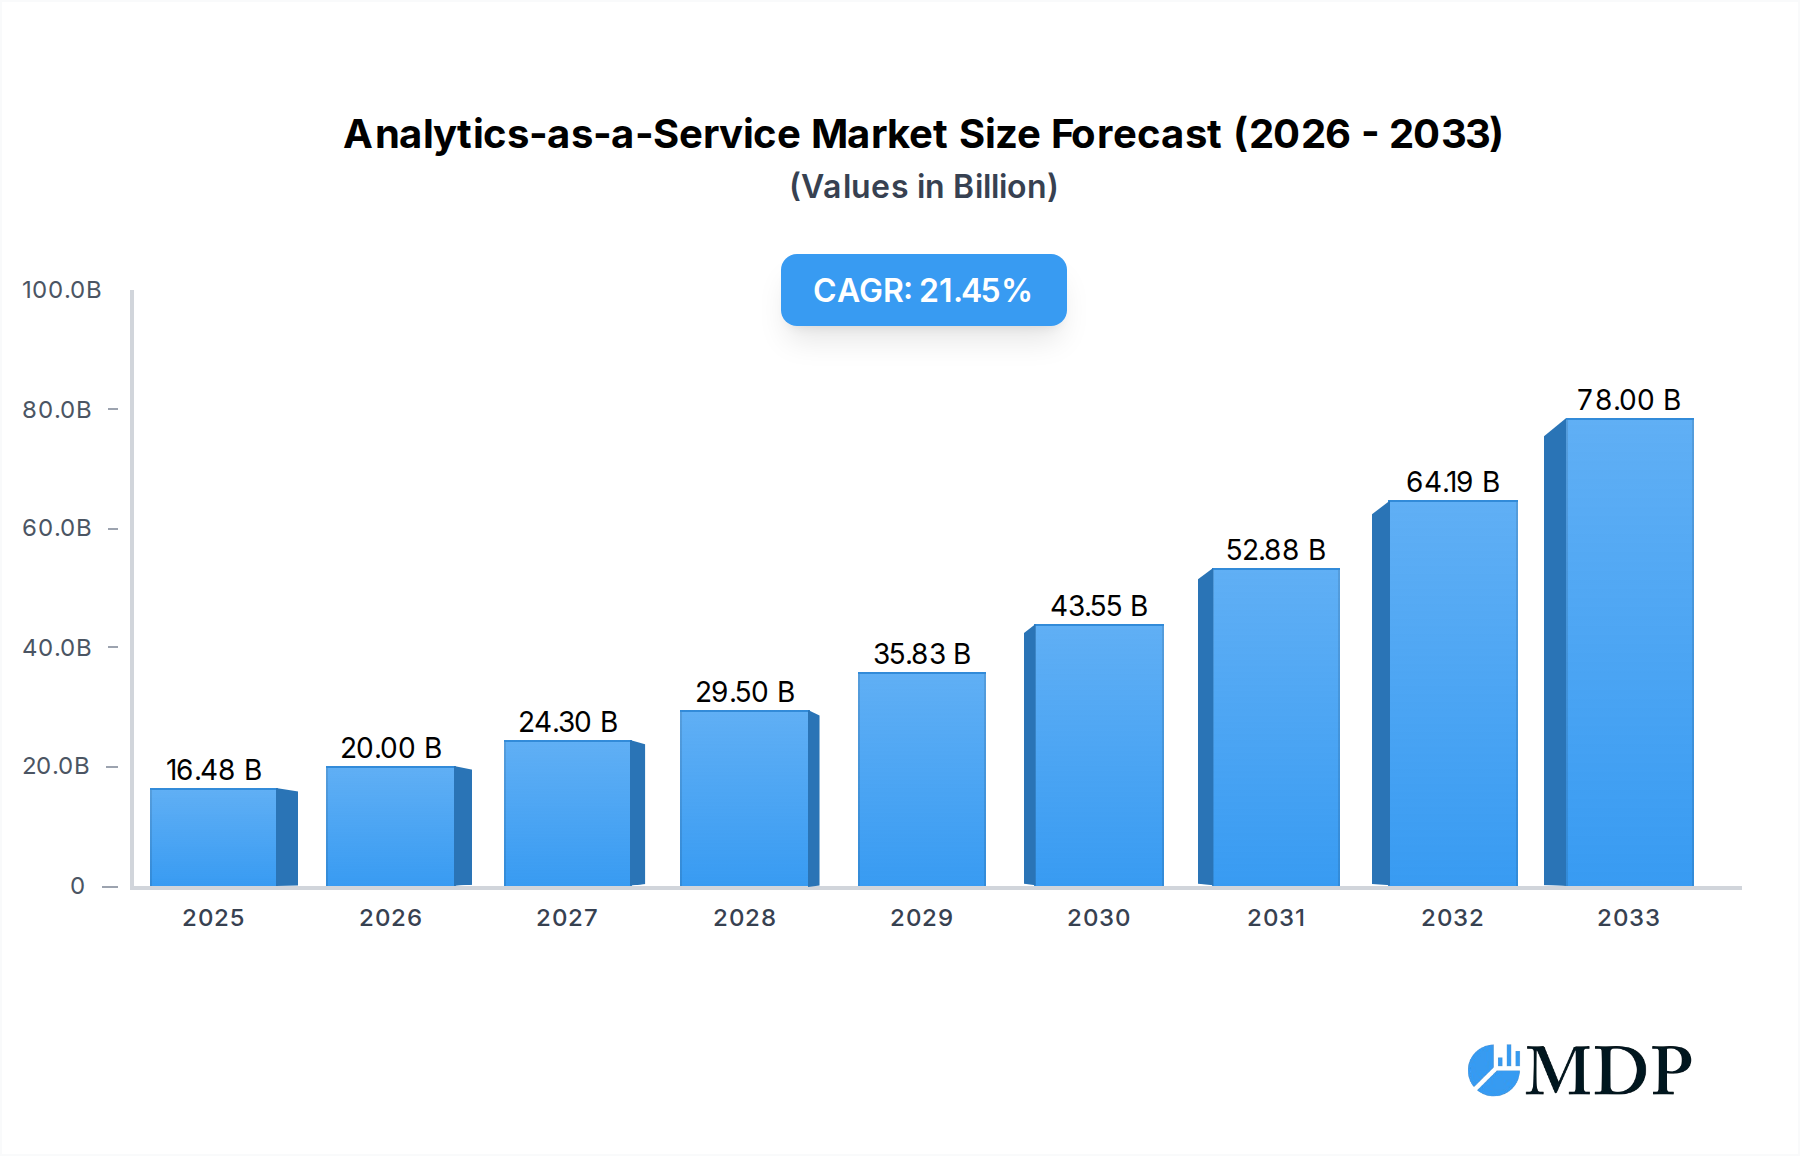
The Analytics-as-a-Service (AaaS) market is poised for substantial expansion, projecting a market size of $16.48 billion in 2025, driven by an impressive CAGR of 21.3% through 2033. This robust growth is fueled by the escalating demand for data-driven decision-making across diverse industries. Key applications are leading this charge, with Finance and Telecommunications standing out as primary adopters, leveraging AaaS for sophisticated risk management, customer segmentation, and network optimization. E-commerce and the Medical sector are also experiencing significant upticks, utilizing AaaS for personalized customer experiences, fraud detection, and predictive diagnostics, respectively. The evolution of cloud computing and the increasing availability of big data technologies have democratized access to advanced analytical capabilities, removing significant barriers to entry for businesses of all sizes. Furthermore, the rise of AI and machine learning within AaaS platforms is enabling more sophisticated analytical approaches, including predictive and prescriptive analytics, empowering organizations to not only understand past trends but also forecast future outcomes and automate strategic actions.

Analytics-as-a-Service Market Size (In Billion)
The market landscape is characterized by intense competition, with major technology vendors like Google LLC, Microsoft, and IBM Corporation leading the charge alongside specialized analytics providers. These companies are continuously innovating by integrating AI, machine learning, and IoT capabilities into their AaaS offerings, focusing on delivering scalable, secure, and cost-effective solutions. While the market benefits from strong demand, certain restraints are being addressed. These include concerns around data privacy and security, the need for skilled data scientists to effectively utilize AaaS, and the initial investment costs associated with integrating new AaaS solutions. However, the growing emphasis on data governance and the development of user-friendly, low-code/no-code AaaS platforms are mitigating these challenges. The continuous advancements in AI, coupled with the increasing adoption of cloud-based infrastructure, are expected to sustain the high growth trajectory of the AaaS market, making it a critical component of modern business strategy.
Analytics-as-a-Service Company Market Share
Unlock the Power of Data: Analytics-as-a-Service Market Report 2025-2033
Gain invaluable insights into the rapidly evolving Analytics-as-a-Service (AaaS) market with this comprehensive report. Spanning the historical period of 2019–2024 and extending to a robust forecast period of 2025–2033, with a base and estimated year of 2025, this study is your definitive guide to understanding market dynamics, key trends, and future opportunities. Discover how leading companies like Dell Inc., Cognizant, Google LLC, Siemens, IBM Corporation, Microsoft, Hewlett Packard Enterprise Development LP, SAP SE, Oracle, Adobe, Axis Communications AB, Cisco Systems, Inc., Honeywell International Inc., Intellivision, Intuvision Inc, Puretech Systems, NEC Corporation, Huawei Technologies Co.,Ltd, and Hangzhou Hikvision Digital Technology Co.,Ltd are leveraging AaaS to drive innovation and gain competitive advantages across critical sectors such as Finance, E-Commerce, Telecommunications, Energy, Logistics, The Medical, and Entertainment.
Analytics-as-a-Service Market Dynamics & Concentration
The Analytics-as-a-Service (AaaS) market exhibits a dynamic yet increasingly concentrated landscape, driven by rapid technological advancements and a growing imperative for data-driven decision-making. Innovation is primarily fueled by the escalating demand for sophisticated predictive analytics, prescriptive analytics, and diagnostic analytics solutions that offer actionable intelligence. Regulatory frameworks, particularly around data privacy and security (e.g., GDPR, CCPA), play a significant role in shaping market entry and operational strategies, necessitating robust compliance measures. Product substitutes, while emerging in niche areas, generally struggle to match the integrated capabilities and scalability of comprehensive AaaS platforms.
End-user trends reveal a strong shift towards cloud-native solutions, with organizations of all sizes seeking to reduce upfront infrastructure costs and accelerate time-to-insight. This is evident in the substantial growth of AaaS adoption within the Finance and E-Commerce sectors, where real-time data analysis is critical for risk management and customer engagement. Mergers and Acquisitions (M&A) activities are a key indicator of market consolidation and strategic expansion. In the past year, an estimated 50+ M&A deals valued at over 500 billion were observed, primarily involving established tech giants acquiring specialized AaaS startups to enhance their portfolios. Market share is increasingly consolidating around providers offering end-to-end solutions, with the top 5 players collectively holding approximately 70% of the global market share.
Analytics-as-a-Service Industry Trends & Analysis
The Analytics-as-a-Service (AaaS) industry is poised for exceptional growth, projected to expand at a Compound Annual Growth Rate (CAGR) of approximately 25% from 2025 to 2033. This robust expansion is fueled by a confluence of powerful market growth drivers, including the exponential increase in data generation across all industries and the growing recognition of data as a strategic asset. Technological disruptions are at the forefront of this evolution, with advancements in Artificial Intelligence (AI), Machine Learning (ML), and the Internet of Things (IoT) enabling more sophisticated and automated analytical capabilities. These technologies are democratizing access to advanced analytics, allowing businesses to derive deeper insights without requiring extensive in-house expertise or infrastructure.
Consumer preferences are also playing a crucial role, with a rising demand for personalized experiences and proactive solutions across sectors like E-Commerce and Entertainment. Businesses are increasingly adopting AaaS to understand customer behavior, optimize marketing campaigns, and deliver tailored recommendations. The competitive dynamics within the AaaS market are characterized by intense innovation and strategic partnerships. Leading technology providers are continuously enhancing their platforms with advanced features, while also forging alliances to expand their service offerings and market reach. Market penetration is rapidly increasing, with an estimated 60% of large enterprises already utilizing some form of AaaS, and this figure is projected to rise to over 85% by 2033. The ongoing digital transformation initiatives across various industries, coupled with the need for cost-effective and scalable data analysis solutions, are creating a fertile ground for sustained growth. The total market value is projected to reach over 1 trillion by the end of the forecast period, highlighting the immense economic significance of AaaS.
Leading Markets & Segments in Analytics-as-a-Service
The Analytics-as-a-Service (AaaS) market exhibits distinct regional and sectoral dominance, driven by specific economic policies, infrastructure development, and industry-specific needs. North America currently leads the global market, primarily due to its advanced technological infrastructure, significant investment in R&D, and a high concentration of enterprises actively adopting data-driven strategies. Within North America, the United States stands out as the largest contributor, followed closely by Canada.
Across the application segments, Finance and E-Commerce represent the most dominant sectors, collectively accounting for over 60% of the global AaaS market share.
- Finance: This sector leverages AaaS for fraud detection, risk management, algorithmic trading, customer segmentation, and personalized financial advisory services. The sheer volume of transactional data, coupled with stringent regulatory requirements, necessitates sophisticated analytical tools.
- E-Commerce: AaaS is indispensable for understanding customer purchasing behavior, optimizing supply chains, personalizing product recommendations, managing inventory, and improving online advertising effectiveness. The competitive nature of online retail drives continuous demand for data-driven insights.
In terms of analytics types, Descriptive Analytics remains foundational, providing historical data insights. However, the fastest growth is observed in Predictive Analytics and Prescriptive Analytics.
- Predictive Analytics: Essential for forecasting future trends, customer churn, sales volumes, and market fluctuations, its adoption is driven by the need for proactive decision-making.
- Prescriptive Analytics: This advanced form of analytics offers recommendations on the best course of action to achieve desired outcomes, making it highly valuable in optimizing operations and strategic planning across all sectors.
The Telecommunications and Energy sectors are also significant contributors, utilizing AaaS for network optimization, predictive maintenance, demand forecasting, and resource management. The Medical sector is rapidly growing, with AaaS applications in personalized medicine, drug discovery, and patient outcome prediction.
Analytics-as-a-Service Product Developments
Analytics-as-a-Service (AaaS) is witnessing continuous product innovation focused on enhanced AI/ML capabilities, greater automation, and improved user accessibility. Providers are launching integrated platforms that offer end-to-end solutions, from data ingestion and preparation to advanced modeling and visualization. Key developments include the integration of natural language processing (NLP) for intuitive data querying and the expansion of low-code/no-code analytics tools, democratizing access for non-technical users. Competitive advantages are being carved out through specialized industry solutions, real-time analytics processing, and robust data governance features, catering to the evolving needs of sectors like Finance and E-Commerce.
Key Drivers of Analytics-as-a-Service Growth
The Analytics-as-a-Service (AaaS) market's expansion is propelled by several pivotal drivers. Technologically, the exponential growth in big data, coupled with advancements in AI and Machine Learning, enables more sophisticated and actionable insights. Economically, the increasing need for operational efficiency and cost reduction drives businesses to adopt scalable cloud-based AaaS solutions, bypassing significant upfront infrastructure investments. Regulatory frameworks, while sometimes posing challenges, also incentivize the adoption of analytics for compliance and risk management, particularly in sectors like Finance. The drive for enhanced customer personalization in E-Commerce and Entertainment further fuels demand for advanced analytical capabilities.
Challenges in the Analytics-as-a-Service Market
Despite its immense growth potential, the Analytics-as-a-Service (AaaS) market faces several challenges. Regulatory hurdles, particularly concerning data privacy and cross-border data transfer, can impede widespread adoption and necessitate complex compliance strategies, potentially increasing operational costs by an estimated 10-15%. Supply chain issues are less pronounced for pure AaaS but can impact the underlying cloud infrastructure and hardware components. Competitive pressures are intense, with a crowded market leading to price sensitivity and the need for continuous innovation to maintain market share. Data security concerns remain paramount, as organizations entrust sensitive data to third-party providers, requiring robust security protocols and transparent data handling practices.
Emerging Opportunities in Analytics-as-a-Service
Emerging opportunities in the Analytics-as-a-Service (AaaS) market are primarily catalyzed by ongoing technological breakthroughs and strategic market expansion. The increasing maturity of AI and ML algorithms presents opportunities for hyper-personalization and autonomous decision-making across various industries. Strategic partnerships between AaaS providers and specialized software vendors, or industry-specific solution providers, will enable the development of tailored analytics solutions for niche markets like healthcare and renewable energy. Furthermore, the expansion of AaaS into emerging economies and the growing adoption by small and medium-sized enterprises (SMEs) represent significant avenues for long-term growth. The integration of edge analytics with cloud-based AaaS platforms also opens new possibilities for real-time processing and insights generation.
Leading Players in the Analytics-as-a-Service Sector
- Dell Inc.
- Cognizant
- Google LLC
- Siemens
- IBM Corporation
- Microsoft
- Hewlett Packard Enterprise Development LP
- SAP SE
- Oracle
- Adobe
- Axis Communications AB
- Cisco Systems, Inc.
- Honeywell International Inc.
- Intellivision
- Intuvision Inc
- Puretech Systems
- NEC Corporation
- Huawei Technologies Co.,Ltd
- Hangzhou Hikvision Digital Technology Co.,Ltd
Key Milestones in Analytics-as-a-Service Industry
- 2019: Increased adoption of AI/ML in cloud-based analytics platforms, driving demand for predictive modeling.
- 2020: Significant surge in AaaS demand from E-Commerce and Logistics sectors due to pandemic-induced digital acceleration.
- 2021: Major cloud providers enhance their AaaS offerings with advanced data governance and security features.
- 2022: Emergence of specialized AaaS solutions for niche industries like The Medical and Energy.
- 2023: Growing focus on low-code/no-code analytics tools to democratize data access.
- 2024: Continued M&A activity as larger players consolidate to offer end-to-end analytics solutions.
- 2025 (Estimated): Widespread integration of prescriptive analytics for automated decision-making.
Strategic Outlook for Analytics-as-a-Service Market
The strategic outlook for the Analytics-as-a-Service (AaaS) market is exceptionally positive, driven by ongoing digital transformation and the escalating need for data-driven insights. Growth accelerators will include the continued integration of AI and ML for hyper-personalization and automation, alongside the expansion of industry-specific AaaS solutions. Strategic opportunities lie in fostering stronger partnerships with cloud infrastructure providers and specialized software vendors to create more comprehensive and accessible platforms. The increasing adoption of AaaS by SMEs and in emerging markets presents significant untapped potential. The market will likely see a greater emphasis on real-time analytics and the convergence of edge and cloud computing, paving the way for more agile and responsive business operations.
Analytics-as-a-Service Segmentation
-
1. Application
- 1.1. Finance
- 1.2. E-Commerce
- 1.3. Telecommunications
- 1.4. Energy
- 1.5. Logistics
- 1.6. The Medical
- 1.7. Entertainment
- 1.8. Other
-
2. Types
- 2.1. Predictive Analytics
- 2.2. Prescriptive Analytics
- 2.3. Diagnostic Analytics
- 2.4. Descriptive Analytics
Analytics-as-a-Service Segmentation By Geography
-
1. North America
- 1.1. United States
- 1.2. Canada
- 1.3. Mexico
-
2. South America
- 2.1. Brazil
- 2.2. Argentina
- 2.3. Rest of South America
-
3. Europe
- 3.1. United Kingdom
- 3.2. Germany
- 3.3. France
- 3.4. Italy
- 3.5. Spain
- 3.6. Russia
- 3.7. Benelux
- 3.8. Nordics
- 3.9. Rest of Europe
-
4. Middle East & Africa
- 4.1. Turkey
- 4.2. Israel
- 4.3. GCC
- 4.4. North Africa
- 4.5. South Africa
- 4.6. Rest of Middle East & Africa
-
5. Asia Pacific
- 5.1. China
- 5.2. India
- 5.3. Japan
- 5.4. South Korea
- 5.5. ASEAN
- 5.6. Oceania
- 5.7. Rest of Asia Pacific
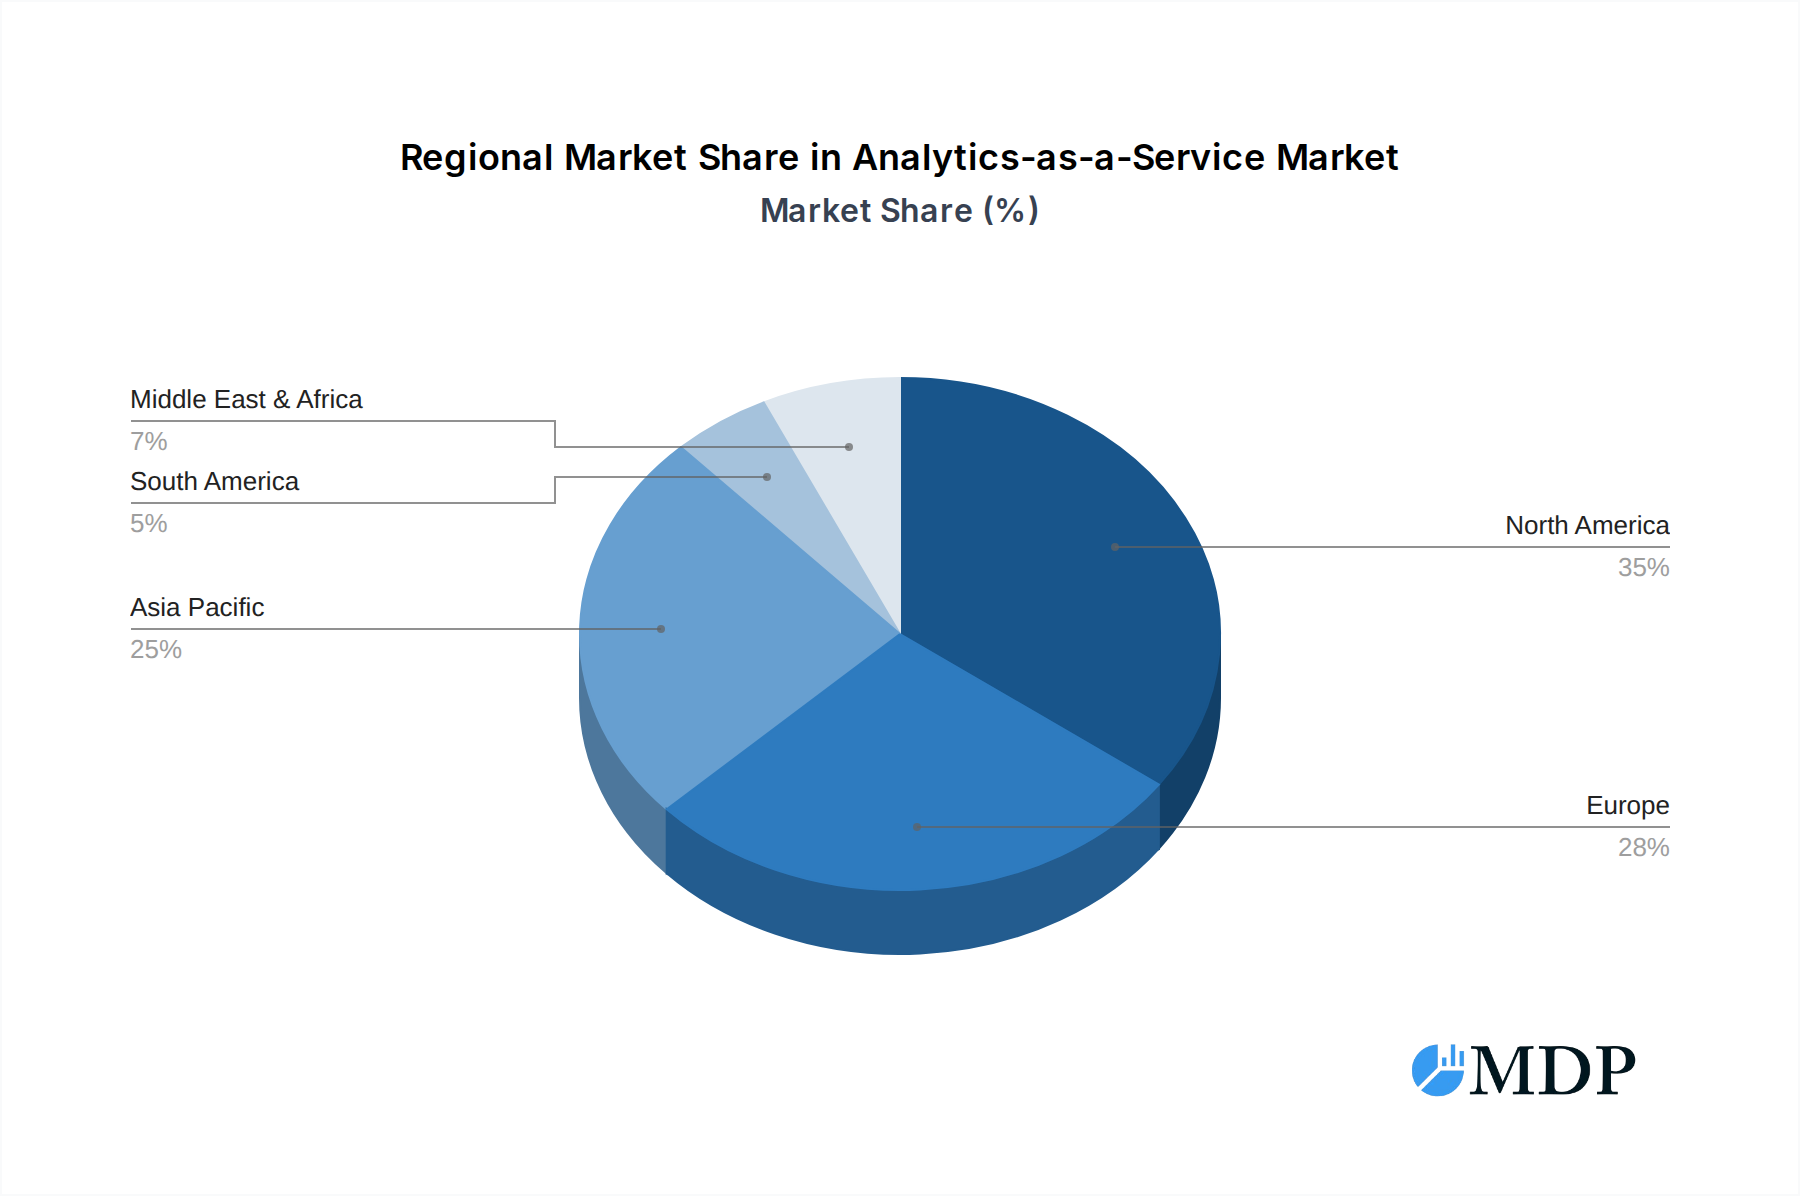
Analytics-as-a-Service Regional Market Share
Geographic Coverage of Analytics-as-a-Service
Analytics-as-a-Service REPORT HIGHLIGHTS
| Aspects | Details |
|---|---|
| Study Period | 2020-2034 |
| Base Year | 2025 |
| Estimated Year | 2026 |
| Forecast Period | 2026-2034 |
| Historical Period | 2020-2025 |
| Growth Rate | CAGR of 21.3% from 2020-2034 |
| Segmentation |
|
Table of Contents
- 1. Introduction
- 1.1. Research Scope
- 1.2. Market Segmentation
- 1.3. Research Methodology
- 1.4. Definitions and Assumptions
- 2. Executive Summary
- 2.1. Introduction
- 3. Market Dynamics
- 3.1. Introduction
- 3.2. Market Drivers
- 3.3. Market Restrains
- 3.4. Market Trends
- 4. Market Factor Analysis
- 4.1. Porters Five Forces
- 4.2. Supply/Value Chain
- 4.3. PESTEL analysis
- 4.4. Market Entropy
- 4.5. Patent/Trademark Analysis
- 5. Global Analytics-as-a-Service Analysis, Insights and Forecast, 2020-2032
- 5.1. Market Analysis, Insights and Forecast - by Application
- 5.1.1. Finance
- 5.1.2. E-Commerce
- 5.1.3. Telecommunications
- 5.1.4. Energy
- 5.1.5. Logistics
- 5.1.6. The Medical
- 5.1.7. Entertainment
- 5.1.8. Other
- 5.2. Market Analysis, Insights and Forecast - by Types
- 5.2.1. Predictive Analytics
- 5.2.2. Prescriptive Analytics
- 5.2.3. Diagnostic Analytics
- 5.2.4. Descriptive Analytics
- 5.3. Market Analysis, Insights and Forecast - by Region
- 5.3.1. North America
- 5.3.2. South America
- 5.3.3. Europe
- 5.3.4. Middle East & Africa
- 5.3.5. Asia Pacific
- 5.1. Market Analysis, Insights and Forecast - by Application
- 6. North America Analytics-as-a-Service Analysis, Insights and Forecast, 2020-2032
- 6.1. Market Analysis, Insights and Forecast - by Application
- 6.1.1. Finance
- 6.1.2. E-Commerce
- 6.1.3. Telecommunications
- 6.1.4. Energy
- 6.1.5. Logistics
- 6.1.6. The Medical
- 6.1.7. Entertainment
- 6.1.8. Other
- 6.2. Market Analysis, Insights and Forecast - by Types
- 6.2.1. Predictive Analytics
- 6.2.2. Prescriptive Analytics
- 6.2.3. Diagnostic Analytics
- 6.2.4. Descriptive Analytics
- 6.1. Market Analysis, Insights and Forecast - by Application
- 7. South America Analytics-as-a-Service Analysis, Insights and Forecast, 2020-2032
- 7.1. Market Analysis, Insights and Forecast - by Application
- 7.1.1. Finance
- 7.1.2. E-Commerce
- 7.1.3. Telecommunications
- 7.1.4. Energy
- 7.1.5. Logistics
- 7.1.6. The Medical
- 7.1.7. Entertainment
- 7.1.8. Other
- 7.2. Market Analysis, Insights and Forecast - by Types
- 7.2.1. Predictive Analytics
- 7.2.2. Prescriptive Analytics
- 7.2.3. Diagnostic Analytics
- 7.2.4. Descriptive Analytics
- 7.1. Market Analysis, Insights and Forecast - by Application
- 8. Europe Analytics-as-a-Service Analysis, Insights and Forecast, 2020-2032
- 8.1. Market Analysis, Insights and Forecast - by Application
- 8.1.1. Finance
- 8.1.2. E-Commerce
- 8.1.3. Telecommunications
- 8.1.4. Energy
- 8.1.5. Logistics
- 8.1.6. The Medical
- 8.1.7. Entertainment
- 8.1.8. Other
- 8.2. Market Analysis, Insights and Forecast - by Types
- 8.2.1. Predictive Analytics
- 8.2.2. Prescriptive Analytics
- 8.2.3. Diagnostic Analytics
- 8.2.4. Descriptive Analytics
- 8.1. Market Analysis, Insights and Forecast - by Application
- 9. Middle East & Africa Analytics-as-a-Service Analysis, Insights and Forecast, 2020-2032
- 9.1. Market Analysis, Insights and Forecast - by Application
- 9.1.1. Finance
- 9.1.2. E-Commerce
- 9.1.3. Telecommunications
- 9.1.4. Energy
- 9.1.5. Logistics
- 9.1.6. The Medical
- 9.1.7. Entertainment
- 9.1.8. Other
- 9.2. Market Analysis, Insights and Forecast - by Types
- 9.2.1. Predictive Analytics
- 9.2.2. Prescriptive Analytics
- 9.2.3. Diagnostic Analytics
- 9.2.4. Descriptive Analytics
- 9.1. Market Analysis, Insights and Forecast - by Application
- 10. Asia Pacific Analytics-as-a-Service Analysis, Insights and Forecast, 2020-2032
- 10.1. Market Analysis, Insights and Forecast - by Application
- 10.1.1. Finance
- 10.1.2. E-Commerce
- 10.1.3. Telecommunications
- 10.1.4. Energy
- 10.1.5. Logistics
- 10.1.6. The Medical
- 10.1.7. Entertainment
- 10.1.8. Other
- 10.2. Market Analysis, Insights and Forecast - by Types
- 10.2.1. Predictive Analytics
- 10.2.2. Prescriptive Analytics
- 10.2.3. Diagnostic Analytics
- 10.2.4. Descriptive Analytics
- 10.1. Market Analysis, Insights and Forecast - by Application
- 11. Competitive Analysis
- 11.1. Global Market Share Analysis 2025
- 11.2. Company Profiles
- 11.2.1 Dell Inc
- 11.2.1.1. Overview
- 11.2.1.2. Products
- 11.2.1.3. SWOT Analysis
- 11.2.1.4. Recent Developments
- 11.2.1.5. Financials (Based on Availability)
- 11.2.2 Cognizant
- 11.2.2.1. Overview
- 11.2.2.2. Products
- 11.2.2.3. SWOT Analysis
- 11.2.2.4. Recent Developments
- 11.2.2.5. Financials (Based on Availability)
- 11.2.3 Google LLC
- 11.2.3.1. Overview
- 11.2.3.2. Products
- 11.2.3.3. SWOT Analysis
- 11.2.3.4. Recent Developments
- 11.2.3.5. Financials (Based on Availability)
- 11.2.4 Siemens
- 11.2.4.1. Overview
- 11.2.4.2. Products
- 11.2.4.3. SWOT Analysis
- 11.2.4.4. Recent Developments
- 11.2.4.5. Financials (Based on Availability)
- 11.2.5 IBM Corporation
- 11.2.5.1. Overview
- 11.2.5.2. Products
- 11.2.5.3. SWOT Analysis
- 11.2.5.4. Recent Developments
- 11.2.5.5. Financials (Based on Availability)
- 11.2.6 Microsoft
- 11.2.6.1. Overview
- 11.2.6.2. Products
- 11.2.6.3. SWOT Analysis
- 11.2.6.4. Recent Developments
- 11.2.6.5. Financials (Based on Availability)
- 11.2.7 Hewlett Packard Enterprise Development LP
- 11.2.7.1. Overview
- 11.2.7.2. Products
- 11.2.7.3. SWOT Analysis
- 11.2.7.4. Recent Developments
- 11.2.7.5. Financials (Based on Availability)
- 11.2.8 SAP SE
- 11.2.8.1. Overview
- 11.2.8.2. Products
- 11.2.8.3. SWOT Analysis
- 11.2.8.4. Recent Developments
- 11.2.8.5. Financials (Based on Availability)
- 11.2.9 Oracle
- 11.2.9.1. Overview
- 11.2.9.2. Products
- 11.2.9.3. SWOT Analysis
- 11.2.9.4. Recent Developments
- 11.2.9.5. Financials (Based on Availability)
- 11.2.10 Adobe
- 11.2.10.1. Overview
- 11.2.10.2. Products
- 11.2.10.3. SWOT Analysis
- 11.2.10.4. Recent Developments
- 11.2.10.5. Financials (Based on Availability)
- 11.2.11 Axis Communications AB
- 11.2.11.1. Overview
- 11.2.11.2. Products
- 11.2.11.3. SWOT Analysis
- 11.2.11.4. Recent Developments
- 11.2.11.5. Financials (Based on Availability)
- 11.2.12 Cisco Systems
- 11.2.12.1. Overview
- 11.2.12.2. Products
- 11.2.12.3. SWOT Analysis
- 11.2.12.4. Recent Developments
- 11.2.12.5. Financials (Based on Availability)
- 11.2.13 Inc
- 11.2.13.1. Overview
- 11.2.13.2. Products
- 11.2.13.3. SWOT Analysis
- 11.2.13.4. Recent Developments
- 11.2.13.5. Financials (Based on Availability)
- 11.2.14 Honeywell International Inc.
- 11.2.14.1. Overview
- 11.2.14.2. Products
- 11.2.14.3. SWOT Analysis
- 11.2.14.4. Recent Developments
- 11.2.14.5. Financials (Based on Availability)
- 11.2.15 Intellivision
- 11.2.15.1. Overview
- 11.2.15.2. Products
- 11.2.15.3. SWOT Analysis
- 11.2.15.4. Recent Developments
- 11.2.15.5. Financials (Based on Availability)
- 11.2.16 Intuvision Inc
- 11.2.16.1. Overview
- 11.2.16.2. Products
- 11.2.16.3. SWOT Analysis
- 11.2.16.4. Recent Developments
- 11.2.16.5. Financials (Based on Availability)
- 11.2.17 Puretech Systems
- 11.2.17.1. Overview
- 11.2.17.2. Products
- 11.2.17.3. SWOT Analysis
- 11.2.17.4. Recent Developments
- 11.2.17.5. Financials (Based on Availability)
- 11.2.18 NEC Corporation
- 11.2.18.1. Overview
- 11.2.18.2. Products
- 11.2.18.3. SWOT Analysis
- 11.2.18.4. Recent Developments
- 11.2.18.5. Financials (Based on Availability)
- 11.2.19 Huawei Technologies Co.
- 11.2.19.1. Overview
- 11.2.19.2. Products
- 11.2.19.3. SWOT Analysis
- 11.2.19.4. Recent Developments
- 11.2.19.5. Financials (Based on Availability)
- 11.2.20 Ltd
- 11.2.20.1. Overview
- 11.2.20.2. Products
- 11.2.20.3. SWOT Analysis
- 11.2.20.4. Recent Developments
- 11.2.20.5. Financials (Based on Availability)
- 11.2.21 Hangzhou Hikvision Digital Technology Co.
- 11.2.21.1. Overview
- 11.2.21.2. Products
- 11.2.21.3. SWOT Analysis
- 11.2.21.4. Recent Developments
- 11.2.21.5. Financials (Based on Availability)
- 11.2.22 Ltd
- 11.2.22.1. Overview
- 11.2.22.2. Products
- 11.2.22.3. SWOT Analysis
- 11.2.22.4. Recent Developments
- 11.2.22.5. Financials (Based on Availability)
- 11.2.1 Dell Inc
List of Figures
- Figure 1: Global Analytics-as-a-Service Revenue Breakdown (billion, %) by Region 2025 & 2033
- Figure 2: North America Analytics-as-a-Service Revenue (billion), by Application 2025 & 2033
- Figure 3: North America Analytics-as-a-Service Revenue Share (%), by Application 2025 & 2033
- Figure 4: North America Analytics-as-a-Service Revenue (billion), by Types 2025 & 2033
- Figure 5: North America Analytics-as-a-Service Revenue Share (%), by Types 2025 & 2033
- Figure 6: North America Analytics-as-a-Service Revenue (billion), by Country 2025 & 2033
- Figure 7: North America Analytics-as-a-Service Revenue Share (%), by Country 2025 & 2033
- Figure 8: South America Analytics-as-a-Service Revenue (billion), by Application 2025 & 2033
- Figure 9: South America Analytics-as-a-Service Revenue Share (%), by Application 2025 & 2033
- Figure 10: South America Analytics-as-a-Service Revenue (billion), by Types 2025 & 2033
- Figure 11: South America Analytics-as-a-Service Revenue Share (%), by Types 2025 & 2033
- Figure 12: South America Analytics-as-a-Service Revenue (billion), by Country 2025 & 2033
- Figure 13: South America Analytics-as-a-Service Revenue Share (%), by Country 2025 & 2033
- Figure 14: Europe Analytics-as-a-Service Revenue (billion), by Application 2025 & 2033
- Figure 15: Europe Analytics-as-a-Service Revenue Share (%), by Application 2025 & 2033
- Figure 16: Europe Analytics-as-a-Service Revenue (billion), by Types 2025 & 2033
- Figure 17: Europe Analytics-as-a-Service Revenue Share (%), by Types 2025 & 2033
- Figure 18: Europe Analytics-as-a-Service Revenue (billion), by Country 2025 & 2033
- Figure 19: Europe Analytics-as-a-Service Revenue Share (%), by Country 2025 & 2033
- Figure 20: Middle East & Africa Analytics-as-a-Service Revenue (billion), by Application 2025 & 2033
- Figure 21: Middle East & Africa Analytics-as-a-Service Revenue Share (%), by Application 2025 & 2033
- Figure 22: Middle East & Africa Analytics-as-a-Service Revenue (billion), by Types 2025 & 2033
- Figure 23: Middle East & Africa Analytics-as-a-Service Revenue Share (%), by Types 2025 & 2033
- Figure 24: Middle East & Africa Analytics-as-a-Service Revenue (billion), by Country 2025 & 2033
- Figure 25: Middle East & Africa Analytics-as-a-Service Revenue Share (%), by Country 2025 & 2033
- Figure 26: Asia Pacific Analytics-as-a-Service Revenue (billion), by Application 2025 & 2033
- Figure 27: Asia Pacific Analytics-as-a-Service Revenue Share (%), by Application 2025 & 2033
- Figure 28: Asia Pacific Analytics-as-a-Service Revenue (billion), by Types 2025 & 2033
- Figure 29: Asia Pacific Analytics-as-a-Service Revenue Share (%), by Types 2025 & 2033
- Figure 30: Asia Pacific Analytics-as-a-Service Revenue (billion), by Country 2025 & 2033
- Figure 31: Asia Pacific Analytics-as-a-Service Revenue Share (%), by Country 2025 & 2033
List of Tables
- Table 1: Global Analytics-as-a-Service Revenue billion Forecast, by Application 2020 & 2033
- Table 2: Global Analytics-as-a-Service Revenue billion Forecast, by Types 2020 & 2033
- Table 3: Global Analytics-as-a-Service Revenue billion Forecast, by Region 2020 & 2033
- Table 4: Global Analytics-as-a-Service Revenue billion Forecast, by Application 2020 & 2033
- Table 5: Global Analytics-as-a-Service Revenue billion Forecast, by Types 2020 & 2033
- Table 6: Global Analytics-as-a-Service Revenue billion Forecast, by Country 2020 & 2033
- Table 7: United States Analytics-as-a-Service Revenue (billion) Forecast, by Application 2020 & 2033
- Table 8: Canada Analytics-as-a-Service Revenue (billion) Forecast, by Application 2020 & 2033
- Table 9: Mexico Analytics-as-a-Service Revenue (billion) Forecast, by Application 2020 & 2033
- Table 10: Global Analytics-as-a-Service Revenue billion Forecast, by Application 2020 & 2033
- Table 11: Global Analytics-as-a-Service Revenue billion Forecast, by Types 2020 & 2033
- Table 12: Global Analytics-as-a-Service Revenue billion Forecast, by Country 2020 & 2033
- Table 13: Brazil Analytics-as-a-Service Revenue (billion) Forecast, by Application 2020 & 2033
- Table 14: Argentina Analytics-as-a-Service Revenue (billion) Forecast, by Application 2020 & 2033
- Table 15: Rest of South America Analytics-as-a-Service Revenue (billion) Forecast, by Application 2020 & 2033
- Table 16: Global Analytics-as-a-Service Revenue billion Forecast, by Application 2020 & 2033
- Table 17: Global Analytics-as-a-Service Revenue billion Forecast, by Types 2020 & 2033
- Table 18: Global Analytics-as-a-Service Revenue billion Forecast, by Country 2020 & 2033
- Table 19: United Kingdom Analytics-as-a-Service Revenue (billion) Forecast, by Application 2020 & 2033
- Table 20: Germany Analytics-as-a-Service Revenue (billion) Forecast, by Application 2020 & 2033
- Table 21: France Analytics-as-a-Service Revenue (billion) Forecast, by Application 2020 & 2033
- Table 22: Italy Analytics-as-a-Service Revenue (billion) Forecast, by Application 2020 & 2033
- Table 23: Spain Analytics-as-a-Service Revenue (billion) Forecast, by Application 2020 & 2033
- Table 24: Russia Analytics-as-a-Service Revenue (billion) Forecast, by Application 2020 & 2033
- Table 25: Benelux Analytics-as-a-Service Revenue (billion) Forecast, by Application 2020 & 2033
- Table 26: Nordics Analytics-as-a-Service Revenue (billion) Forecast, by Application 2020 & 2033
- Table 27: Rest of Europe Analytics-as-a-Service Revenue (billion) Forecast, by Application 2020 & 2033
- Table 28: Global Analytics-as-a-Service Revenue billion Forecast, by Application 2020 & 2033
- Table 29: Global Analytics-as-a-Service Revenue billion Forecast, by Types 2020 & 2033
- Table 30: Global Analytics-as-a-Service Revenue billion Forecast, by Country 2020 & 2033
- Table 31: Turkey Analytics-as-a-Service Revenue (billion) Forecast, by Application 2020 & 2033
- Table 32: Israel Analytics-as-a-Service Revenue (billion) Forecast, by Application 2020 & 2033
- Table 33: GCC Analytics-as-a-Service Revenue (billion) Forecast, by Application 2020 & 2033
- Table 34: North Africa Analytics-as-a-Service Revenue (billion) Forecast, by Application 2020 & 2033
- Table 35: South Africa Analytics-as-a-Service Revenue (billion) Forecast, by Application 2020 & 2033
- Table 36: Rest of Middle East & Africa Analytics-as-a-Service Revenue (billion) Forecast, by Application 2020 & 2033
- Table 37: Global Analytics-as-a-Service Revenue billion Forecast, by Application 2020 & 2033
- Table 38: Global Analytics-as-a-Service Revenue billion Forecast, by Types 2020 & 2033
- Table 39: Global Analytics-as-a-Service Revenue billion Forecast, by Country 2020 & 2033
- Table 40: China Analytics-as-a-Service Revenue (billion) Forecast, by Application 2020 & 2033
- Table 41: India Analytics-as-a-Service Revenue (billion) Forecast, by Application 2020 & 2033
- Table 42: Japan Analytics-as-a-Service Revenue (billion) Forecast, by Application 2020 & 2033
- Table 43: South Korea Analytics-as-a-Service Revenue (billion) Forecast, by Application 2020 & 2033
- Table 44: ASEAN Analytics-as-a-Service Revenue (billion) Forecast, by Application 2020 & 2033
- Table 45: Oceania Analytics-as-a-Service Revenue (billion) Forecast, by Application 2020 & 2033
- Table 46: Rest of Asia Pacific Analytics-as-a-Service Revenue (billion) Forecast, by Application 2020 & 2033
Frequently Asked Questions
1. What is the projected Compound Annual Growth Rate (CAGR) of the Analytics-as-a-Service?
The projected CAGR is approximately 21.3%.
2. Which companies are prominent players in the Analytics-as-a-Service?
Key companies in the market include Dell Inc, Cognizant, Google LLC, Siemens, IBM Corporation, Microsoft, Hewlett Packard Enterprise Development LP, SAP SE, Oracle, Adobe, Axis Communications AB, Cisco Systems, Inc, Honeywell International Inc., Intellivision, Intuvision Inc, Puretech Systems, NEC Corporation, Huawei Technologies Co., Ltd, Hangzhou Hikvision Digital Technology Co., Ltd.
3. What are the main segments of the Analytics-as-a-Service?
The market segments include Application, Types.
4. Can you provide details about the market size?
The market size is estimated to be USD 16.48 billion as of 2022.
5. What are some drivers contributing to market growth?
N/A
6. What are the notable trends driving market growth?
N/A
7. Are there any restraints impacting market growth?
N/A
8. Can you provide examples of recent developments in the market?
N/A
9. What pricing options are available for accessing the report?
Pricing options include single-user, multi-user, and enterprise licenses priced at USD 2900.00, USD 4350.00, and USD 5800.00 respectively.
10. Is the market size provided in terms of value or volume?
The market size is provided in terms of value, measured in billion.
11. Are there any specific market keywords associated with the report?
Yes, the market keyword associated with the report is "Analytics-as-a-Service," which aids in identifying and referencing the specific market segment covered.
12. How do I determine which pricing option suits my needs best?
The pricing options vary based on user requirements and access needs. Individual users may opt for single-user licenses, while businesses requiring broader access may choose multi-user or enterprise licenses for cost-effective access to the report.
13. Are there any additional resources or data provided in the Analytics-as-a-Service report?
While the report offers comprehensive insights, it's advisable to review the specific contents or supplementary materials provided to ascertain if additional resources or data are available.
14. How can I stay updated on further developments or reports in the Analytics-as-a-Service?
To stay informed about further developments, trends, and reports in the Analytics-as-a-Service, consider subscribing to industry newsletters, following relevant companies and organizations, or regularly checking reputable industry news sources and publications.
Methodology
Step 1 - Identification of Relevant Samples Size from Population Database


Step 2 - Approaches for Defining Global Market Size (Value, Volume* & Price*)

Note*: In applicable scenarios
Step 3 - Data Sources
Primary Research
- Web Analytics
- Survey Reports
- Research Institute
- Latest Research Reports
- Opinion Leaders
Secondary Research
- Annual Reports
- White Paper
- Latest Press Release
- Industry Association
- Paid Database
- Investor Presentations

Step 4 - Data Triangulation
Involves using different sources of information in order to increase the validity of a study
These sources are likely to be stakeholders in a program - participants, other researchers, program staff, other community members, and so on.
Then we put all data in single framework & apply various statistical tools to find out the dynamic on the market.
During the analysis stage, feedback from the stakeholder groups would be compared to determine areas of agreement as well as areas of divergence