

Key Insights
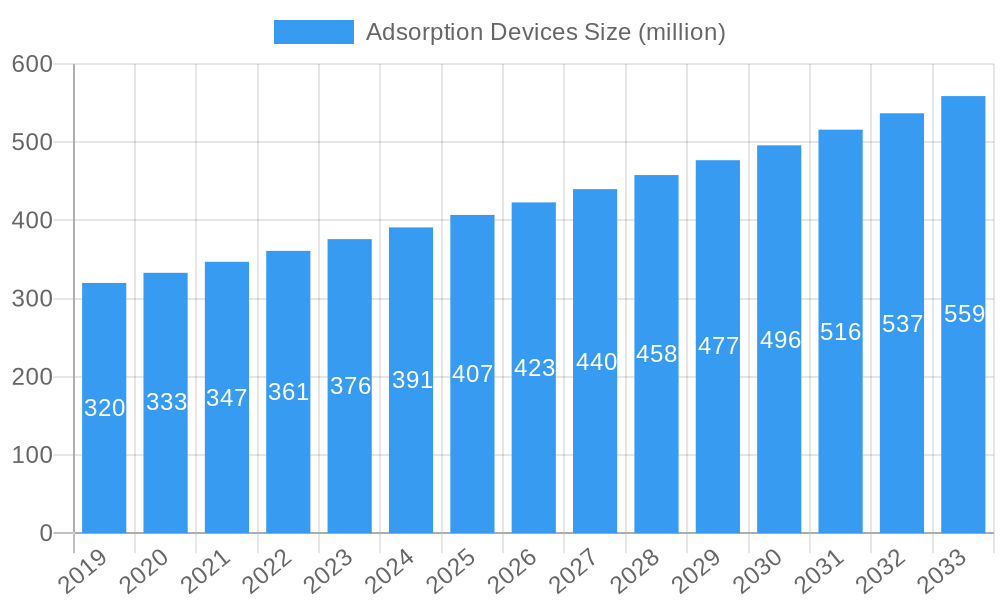
The global Adsorption Devices market is poised for robust expansion, projected to reach a valuation of $441 million with a Compound Annual Growth Rate (CAGR) of 5% from 2025 to 2033. This growth is primarily propelled by the increasing stringent environmental regulations worldwide, mandating effective industrial emission control and solvent recovery. Key industries driving this demand include Automotive Paints, where VOC abatement is critical; the Chemical sector, requiring purification and separation processes; the Semiconductor industry, which relies on high-purity environments; and Printing, facing pressure to minimize harmful emissions. The increasing industrialization, particularly in emerging economies, coupled with a growing awareness of air quality and sustainability, further solidifies the market's upward trajectory. The demand for adsorption devices is also being influenced by technological advancements, leading to more efficient and cost-effective solutions that cater to diverse industrial needs.
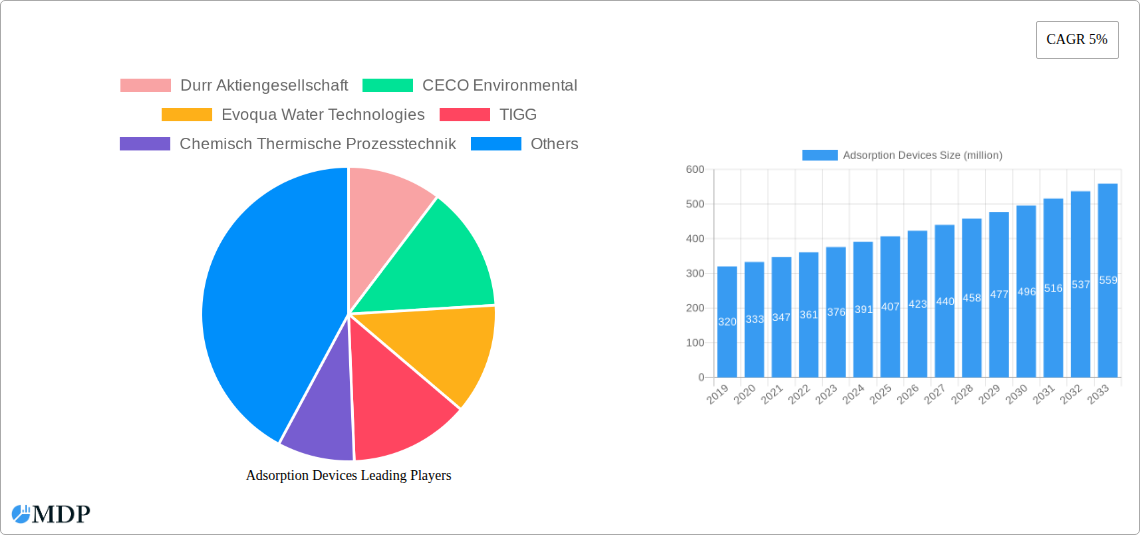
Adsorption Devices Market Size (In Million)
The market is segmented by flow rate, with "More than 50,000 CFM" representing a significant and growing segment due to the large-scale operations in major industrial sectors requiring substantial air treatment capacity. Conversely, "Less than 10,000 CFM" and "10,000-50,000 CFM" segments cater to smaller-scale industries and specialized applications. While the market benefits from drivers such as stricter environmental policies and industrial growth, it faces certain restraints, including the initial capital investment required for advanced adsorption systems and the operational costs associated with adsorbent regeneration or replacement. However, the long-term benefits of reduced environmental impact and compliance with regulations are expected to outweigh these concerns, ensuring continued market penetration and innovation. Key players such as Durr Aktiengesellschaft, CECO Environmental, and Evoqua Water Technologies are actively shaping the market through product development and strategic expansions.
Adsorption Devices Company Market Share
Adsorption Devices Market: Comprehensive Industry Analysis and Future Outlook (2019-2033)
This in-depth report provides an unparalleled analysis of the global Adsorption Devices market, crucial for understanding air pollution control and industrial process optimization. Covering the historical period from 2019 to 2024, the base and estimated year of 2025, and a robust forecast period extending to 2033, this report offers critical insights into market dynamics, trends, leading segments, key players, and strategic opportunities. Leveraging high-traffic keywords such as "adsorption technology," "VOC abatement," "air purification systems," "industrial emission control," and "solvent recovery," this report is designed to maximize search visibility and attract industry stakeholders including manufacturers, environmental consultants, regulatory bodies, and investors.
Adsorption Devices Market Dynamics & Concentration
The global Adsorption Devices market exhibits moderate to high concentration, with several key players dominating significant market share. Major contributors like Durr Aktiengesellschaft, CECO Environmental, Evoqua Water Technologies, and TAIKISHA LIMITED have established strong presences through continuous innovation and strategic acquisitions. The market's innovation drivers are primarily fueled by increasingly stringent environmental regulations globally, demanding more efficient and cost-effective solutions for volatile organic compound (VOC) abatement and process air purification. Regulatory frameworks, such as the EU's Industrial Emissions Directive and the US EPA's National Emission Standards for Hazardous Air Pollutants (NESHAP), are pivotal in shaping market demand.
Product substitutes, while present in some niche applications, often fall short in terms of efficiency and operational cost for large-scale industrial emissions. End-user trends indicate a growing preference for regenerative adsorption systems that offer lower operational expenditures and higher sustainability. The automotive paints, chemical, semiconductor, and printing industries represent key sectors driving adoption. Mergers and acquisitions (M&A) are an active component of market dynamics, with approximately 5-10 significant M&A deals estimated annually over the historical period, aimed at expanding product portfolios and geographical reach. The market share distribution shows the top 5 players collectively holding an estimated 55-65% of the global market by revenue.
Adsorption Devices Industry Trends & Analysis
The Adsorption Devices industry is poised for substantial growth, driven by a confluence of factors including escalating industrial activity and a heightened global emphasis on environmental sustainability. The market is projected to expand at a Compound Annual Growth Rate (CAGR) of approximately 6.5% to 7.5% over the forecast period. Market penetration for advanced adsorption technologies is steadily increasing, particularly in developed economies and rapidly industrializing nations. The primary growth driver is the relentless tightening of regulations pertaining to air quality and industrial emissions worldwide, compelling industries to invest in effective abatement solutions.
Technological disruptions are a constant feature, with ongoing research and development focused on novel adsorbent materials offering higher capacities, enhanced selectivity, and improved regeneration efficiency. This includes the exploration of advanced activated carbons, zeolites, and metal-organic frameworks (MOFs). Consumer preferences are shifting towards energy-efficient systems with lower operational costs, favoring regenerative adsorption technologies over single-pass methods. Competitive dynamics are characterized by a blend of established giants and emerging innovators, with a strong emphasis on offering customized solutions tailored to specific industrial needs and emission profiles. The increasing demand for solvent recovery in chemical and printing industries, driven by both environmental concerns and economic benefits, further bolsters market expansion. The semiconductor industry's need for ultra-pure air and precise emission control also contributes significantly to market penetration.
Leading Markets & Segments in Adsorption Devices
The global Adsorption Devices market is led by the Chemical industry segment, which accounts for an estimated 30-35% of the market revenue. This dominance is attributed to the inherent presence of a wide array of volatile organic compounds (VOCs) and hazardous air pollutants (HAPs) generated during chemical manufacturing processes. Stringent environmental regulations governing chemical emissions are a primary driver for the widespread adoption of adsorption technologies in this sector.
Within applications, Automotive Paints represent another significant segment, contributing approximately 20-25% to the market. The use of solvents in automotive coatings generates substantial VOC emissions, making adsorption devices essential for compliance with air quality standards. The Semiconductor industry, while smaller in volume, commands a higher market value due to the specialized, high-purity requirements for process gases and emission control, accounting for around 15-20%. The Printing industry, particularly commercial printing operations, also represents a key segment, driven by the need to control VOCs from inks and cleaning solvents, contributing approximately 10-15%.
In terms of device types by capacity, the 10,000-50,000 CFM segment is the most dominant, capturing an estimated 40-45% of the market. This size range effectively caters to a broad spectrum of industrial applications and facility requirements. Devices Less than 10,000 CFM are crucial for smaller operations and specific process units, accounting for approximately 25-30%. The More than 50,000 CFM segment is vital for large-scale industrial complexes and power plants, representing the remaining 25-30% of the market. Geographically, North America and Europe currently lead the market due to established regulatory frameworks and advanced industrial infrastructure. However, the Asia-Pacific region is exhibiting the fastest growth, fueled by rapid industrialization and increasing environmental awareness.
Adsorption Devices Product Developments
Product innovations in the Adsorption Devices sector are focused on enhancing efficiency and sustainability. Key developments include the introduction of advanced adsorbent materials with superior VOC adsorption capacities and regeneration properties. Systems are becoming more modular and scalable, allowing for flexible deployment in diverse industrial settings. Competitive advantages are being gained through integrated solutions that combine adsorption with other abatement technologies for multi-pollutant control. Energy-efficient regeneration techniques, such as low-temperature regeneration and microwave-assisted regeneration, are gaining traction, reducing operational costs and environmental impact. These technological advancements are crucial for meeting evolving regulatory demands and end-user expectations for performance and cost-effectiveness.
Key Drivers of Adsorption Devices Growth
The growth of the Adsorption Devices market is primarily propelled by an increasing global focus on environmental protection and air quality. Stricter government regulations worldwide mandating the reduction of industrial emissions, particularly Volatile Organic Compounds (VOCs) and Hazardous Air Pollutants (HAPs), are a major catalyst. The growing industrial sector, encompassing chemical manufacturing, automotive, printing, and semiconductor production, inherently generates emissions that require effective control. Furthermore, the economic benefits of solvent recovery, where valuable solvents are captured and reused, are driving adoption in specific industries. Technological advancements leading to more efficient, cost-effective, and sustainable adsorption solutions also contribute significantly to market expansion.
Challenges in the Adsorption Devices Market
Despite robust growth, the Adsorption Devices market faces several challenges. High initial capital investment for advanced adsorption systems can be a significant barrier, especially for small and medium-sized enterprises. Operational costs, though often lower than non-regenerative methods, can still be a concern, particularly regarding energy consumption for regeneration. Competition from alternative emission control technologies, such as thermal oxidation and biofiltration, presents a challenge in specific applications. Fluctuations in the availability and cost of raw materials for adsorbent media can impact pricing and supply chain stability. Additionally, navigating complex and evolving regulatory landscapes across different regions requires continuous adaptation and investment in compliance.
Emerging Opportunities in Adsorption Devices
Emerging opportunities in the Adsorption Devices market are driven by several key catalysts for long-term growth. The development of novel adsorbent materials, such as advanced zeolites and Metal-Organic Frameworks (MOFs), offers the potential for higher adsorption capacities, improved selectivity for specific pollutants, and enhanced regeneration efficiency, paving the way for next-generation devices. Strategic partnerships and collaborations between adsorbent manufacturers, equipment providers, and end-users are fostering the development of integrated solutions tailored to specific industrial needs. Market expansion into developing economies with rapidly industrializing sectors and growing environmental awareness presents significant untapped potential. The increasing demand for carbon capture and utilization (CCU) technologies, where adsorption plays a crucial role, opens up a vast new avenue for growth.
Leading Players in the Adsorption Devices Sector
- Durr Aktiengesellschaft
- CECO Environmental
- Evoqua Water Technologies
- TIGG
- Chemisch Thermische Prozesstechnik
- TAIKISHA LIMITED
- Environmental C & C Inc.
- Gulf Coast Environmental Systems
- Monroe Environmental
Key Milestones in Adsorption Devices Industry
- 2019: Increased regulatory pressure globally drives adoption of advanced VOC abatement technologies.
- 2020: Development of highly selective adsorbent materials for challenging industrial emissions.
- 2021: Focus on energy-efficient regeneration techniques to reduce operational costs.
- 2022: Mergers and acquisitions among key players to expand market reach and product portfolios.
- 2023: Growing interest in adsorption for carbon capture applications.
- 2024: Introduction of modular and scalable adsorption systems for diverse industrial needs.
- 2025: Continued innovation in adsorbent materials and system integration.
- 2026-2033: Anticipated sustained market growth driven by regulatory compliance and sustainability initiatives.
Strategic Outlook for Adsorption Devices Market
The strategic outlook for the Adsorption Devices market is overwhelmingly positive, characterized by consistent growth accelerators. The continuous tightening of environmental regulations globally remains the most significant growth driver, compelling industries across sectors to invest in effective emission control solutions. Technological advancements in adsorbent materials and system design will further enhance performance, reduce operational costs, and broaden application scope. The increasing demand for solvent recovery and potential applications in carbon capture represent substantial future growth avenues. Strategic investments in research and development, coupled with market expansion into emerging economies, will be crucial for players seeking to capitalize on the evolving landscape and maintain a competitive edge in this vital environmental technology sector.
Adsorption Devices Segmentation
-
1. Application
- 1.1. Automotive Paints
- 1.2. Chemical
- 1.3. Semiconductor
- 1.4. Printing
-
2. Types
- 2.1. Less than 10,000 CFM
- 2.2. 10,000-50,000 CFM
- 2.3. More than 50,000 CFM
Adsorption Devices Segmentation By Geography
-
1. North America
- 1.1. United States
- 1.2. Canada
- 1.3. Mexico
-
2. South America
- 2.1. Brazil
- 2.2. Argentina
- 2.3. Rest of South America
-
3. Europe
- 3.1. United Kingdom
- 3.2. Germany
- 3.3. France
- 3.4. Italy
- 3.5. Spain
- 3.6. Russia
- 3.7. Benelux
- 3.8. Nordics
- 3.9. Rest of Europe
-
4. Middle East & Africa
- 4.1. Turkey
- 4.2. Israel
- 4.3. GCC
- 4.4. North Africa
- 4.5. South Africa
- 4.6. Rest of Middle East & Africa
-
5. Asia Pacific
- 5.1. China
- 5.2. India
- 5.3. Japan
- 5.4. South Korea
- 5.5. ASEAN
- 5.6. Oceania
- 5.7. Rest of Asia Pacific
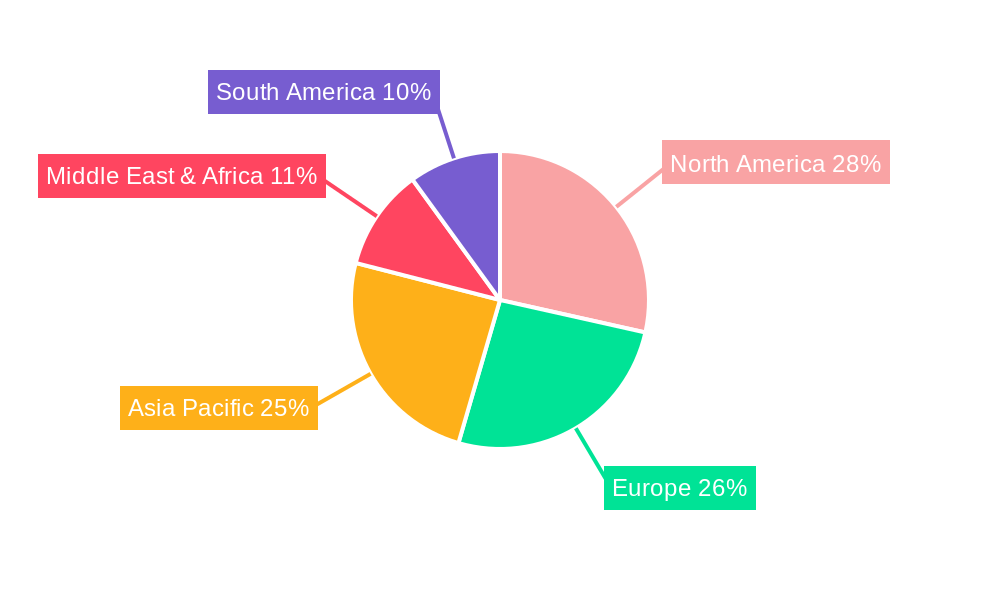
Adsorption Devices Regional Market Share
Geographic Coverage of Adsorption Devices
Adsorption Devices REPORT HIGHLIGHTS
| Aspects | Details |
|---|---|
| Study Period | 2020-2034 |
| Base Year | 2025 |
| Estimated Year | 2026 |
| Forecast Period | 2026-2034 |
| Historical Period | 2020-2025 |
| Growth Rate | CAGR of 5% from 2020-2034 |
| Segmentation |
|
Table of Contents
- 1. Introduction
- 1.1. Research Scope
- 1.2. Market Segmentation
- 1.3. Research Objective
- 1.4. Definitions and Assumptions
- 2. Executive Summary
- 2.1. Market Snapshot
- 3. Market Dynamics
- 3.1. Market Drivers
- 3.2. Market Restrains
- 3.3. Market Trends
- 3.4. Market Opportunities
- 4. Market Factor Analysis
- 4.1. Porters Five Forces
- 4.1.1. Bargaining Power of Suppliers
- 4.1.2. Bargaining Power of Buyers
- 4.1.3. Threat of New Entrants
- 4.1.4. Threat of Substitutes
- 4.1.5. Competitive Rivalry
- 4.2. PESTEL analysis
- 4.3. BCG Analysis
- 4.3.1. Stars (High Growth, High Market Share)
- 4.3.2. Cash Cows (Low Growth, High Market Share)
- 4.3.3. Question Mark (High Growth, Low Market Share)
- 4.3.4. Dogs (Low Growth, Low Market Share)
- 4.4. Ansoff Matrix Analysis
- 4.5. Supply Chain Analysis
- 4.6. Regulatory Landscape
- 4.7. Current Market Potential and Opportunity Assessment (TAM–SAM–SOM Framework)
- 4.8. MDP Analyst Note
- 4.1. Porters Five Forces
- 5. Market Analysis, Insights and Forecast 2021-2033
- 5.1. Market Analysis, Insights and Forecast - by Application
- 5.1.1. Automotive Paints
- 5.1.2. Chemical
- 5.1.3. Semiconductor
- 5.1.4. Printing
- 5.2. Market Analysis, Insights and Forecast - by Types
- 5.2.1. Less than 10,000 CFM
- 5.2.2. 10,000-50,000 CFM
- 5.2.3. More than 50,000 CFM
- 5.3. Market Analysis, Insights and Forecast - by Region
- 5.3.1. North America
- 5.3.2. South America
- 5.3.3. Europe
- 5.3.4. Middle East & Africa
- 5.3.5. Asia Pacific
- 5.1. Market Analysis, Insights and Forecast - by Application
- 6. Global Adsorption Devices Analysis, Insights and Forecast, 2021-2033
- 6.1. Market Analysis, Insights and Forecast - by Application
- 6.1.1. Automotive Paints
- 6.1.2. Chemical
- 6.1.3. Semiconductor
- 6.1.4. Printing
- 6.2. Market Analysis, Insights and Forecast - by Types
- 6.2.1. Less than 10,000 CFM
- 6.2.2. 10,000-50,000 CFM
- 6.2.3. More than 50,000 CFM
- 6.1. Market Analysis, Insights and Forecast - by Application
- 7. North America Adsorption Devices Analysis, Insights and Forecast, 2020-2032
- 7.1. Market Analysis, Insights and Forecast - by Application
- 7.1.1. Automotive Paints
- 7.1.2. Chemical
- 7.1.3. Semiconductor
- 7.1.4. Printing
- 7.2. Market Analysis, Insights and Forecast - by Types
- 7.2.1. Less than 10,000 CFM
- 7.2.2. 10,000-50,000 CFM
- 7.2.3. More than 50,000 CFM
- 7.1. Market Analysis, Insights and Forecast - by Application
- 8. South America Adsorption Devices Analysis, Insights and Forecast, 2020-2032
- 8.1. Market Analysis, Insights and Forecast - by Application
- 8.1.1. Automotive Paints
- 8.1.2. Chemical
- 8.1.3. Semiconductor
- 8.1.4. Printing
- 8.2. Market Analysis, Insights and Forecast - by Types
- 8.2.1. Less than 10,000 CFM
- 8.2.2. 10,000-50,000 CFM
- 8.2.3. More than 50,000 CFM
- 8.1. Market Analysis, Insights and Forecast - by Application
- 9. Europe Adsorption Devices Analysis, Insights and Forecast, 2020-2032
- 9.1. Market Analysis, Insights and Forecast - by Application
- 9.1.1. Automotive Paints
- 9.1.2. Chemical
- 9.1.3. Semiconductor
- 9.1.4. Printing
- 9.2. Market Analysis, Insights and Forecast - by Types
- 9.2.1. Less than 10,000 CFM
- 9.2.2. 10,000-50,000 CFM
- 9.2.3. More than 50,000 CFM
- 9.1. Market Analysis, Insights and Forecast - by Application
- 10. Middle East & Africa Adsorption Devices Analysis, Insights and Forecast, 2020-2032
- 10.1. Market Analysis, Insights and Forecast - by Application
- 10.1.1. Automotive Paints
- 10.1.2. Chemical
- 10.1.3. Semiconductor
- 10.1.4. Printing
- 10.2. Market Analysis, Insights and Forecast - by Types
- 10.2.1. Less than 10,000 CFM
- 10.2.2. 10,000-50,000 CFM
- 10.2.3. More than 50,000 CFM
- 10.1. Market Analysis, Insights and Forecast - by Application
- 11. Asia Pacific Adsorption Devices Analysis, Insights and Forecast, 2020-2032
- 11.1. Market Analysis, Insights and Forecast - by Application
- 11.1.1. Automotive Paints
- 11.1.2. Chemical
- 11.1.3. Semiconductor
- 11.1.4. Printing
- 11.2. Market Analysis, Insights and Forecast - by Types
- 11.2.1. Less than 10,000 CFM
- 11.2.2. 10,000-50,000 CFM
- 11.2.3. More than 50,000 CFM
- 11.1. Market Analysis, Insights and Forecast - by Application
- 12. Competitive Analysis
- 12.1. Company Profiles
- 12.1.1 Durr Aktiengesellschaft
- 12.1.1.1. Company Overview
- 12.1.1.2. Products
- 12.1.1.3. Company Financials
- 12.1.1.4. SWOT Analysis
- 12.1.2 CECO Environmental
- 12.1.2.1. Company Overview
- 12.1.2.2. Products
- 12.1.2.3. Company Financials
- 12.1.2.4. SWOT Analysis
- 12.1.3 Evoqua Water Technologies
- 12.1.3.1. Company Overview
- 12.1.3.2. Products
- 12.1.3.3. Company Financials
- 12.1.3.4. SWOT Analysis
- 12.1.4 TIGG
- 12.1.4.1. Company Overview
- 12.1.4.2. Products
- 12.1.4.3. Company Financials
- 12.1.4.4. SWOT Analysis
- 12.1.5 Chemisch Thermische Prozesstechnik
- 12.1.5.1. Company Overview
- 12.1.5.2. Products
- 12.1.5.3. Company Financials
- 12.1.5.4. SWOT Analysis
- 12.1.6 TAIKISHA LIMITED
- 12.1.6.1. Company Overview
- 12.1.6.2. Products
- 12.1.6.3. Company Financials
- 12.1.6.4. SWOT Analysis
- 12.1.7 Environmental C & C Inc.
- 12.1.7.1. Company Overview
- 12.1.7.2. Products
- 12.1.7.3. Company Financials
- 12.1.7.4. SWOT Analysis
- 12.1.8 Gulf Coast Environmental Systems
- 12.1.8.1. Company Overview
- 12.1.8.2. Products
- 12.1.8.3. Company Financials
- 12.1.8.4. SWOT Analysis
- 12.1.9 Monroe Environmental
- 12.1.9.1. Company Overview
- 12.1.9.2. Products
- 12.1.9.3. Company Financials
- 12.1.9.4. SWOT Analysis
- 12.1.1 Durr Aktiengesellschaft
- 12.2. Market Entropy
- 12.2.1 Company's Key Areas Served
- 12.2.2 Recent Developments
- 12.3. Company Market Share Analysis 2025
- 12.3.1 Top 5 Companies Market Share Analysis
- 12.3.2 Top 3 Companies Market Share Analysis
- 12.4. List of Potential Customers
- 13. Research Methodology
List of Figures
- Figure 1: Global Adsorption Devices Revenue Breakdown (million, %) by Region 2025 & 2033
- Figure 2: North America Adsorption Devices Revenue (million), by Application 2025 & 2033
- Figure 3: North America Adsorption Devices Revenue Share (%), by Application 2025 & 2033
- Figure 4: North America Adsorption Devices Revenue (million), by Types 2025 & 2033
- Figure 5: North America Adsorption Devices Revenue Share (%), by Types 2025 & 2033
- Figure 6: North America Adsorption Devices Revenue (million), by Country 2025 & 2033
- Figure 7: North America Adsorption Devices Revenue Share (%), by Country 2025 & 2033
- Figure 8: South America Adsorption Devices Revenue (million), by Application 2025 & 2033
- Figure 9: South America Adsorption Devices Revenue Share (%), by Application 2025 & 2033
- Figure 10: South America Adsorption Devices Revenue (million), by Types 2025 & 2033
- Figure 11: South America Adsorption Devices Revenue Share (%), by Types 2025 & 2033
- Figure 12: South America Adsorption Devices Revenue (million), by Country 2025 & 2033
- Figure 13: South America Adsorption Devices Revenue Share (%), by Country 2025 & 2033
- Figure 14: Europe Adsorption Devices Revenue (million), by Application 2025 & 2033
- Figure 15: Europe Adsorption Devices Revenue Share (%), by Application 2025 & 2033
- Figure 16: Europe Adsorption Devices Revenue (million), by Types 2025 & 2033
- Figure 17: Europe Adsorption Devices Revenue Share (%), by Types 2025 & 2033
- Figure 18: Europe Adsorption Devices Revenue (million), by Country 2025 & 2033
- Figure 19: Europe Adsorption Devices Revenue Share (%), by Country 2025 & 2033
- Figure 20: Middle East & Africa Adsorption Devices Revenue (million), by Application 2025 & 2033
- Figure 21: Middle East & Africa Adsorption Devices Revenue Share (%), by Application 2025 & 2033
- Figure 22: Middle East & Africa Adsorption Devices Revenue (million), by Types 2025 & 2033
- Figure 23: Middle East & Africa Adsorption Devices Revenue Share (%), by Types 2025 & 2033
- Figure 24: Middle East & Africa Adsorption Devices Revenue (million), by Country 2025 & 2033
- Figure 25: Middle East & Africa Adsorption Devices Revenue Share (%), by Country 2025 & 2033
- Figure 26: Asia Pacific Adsorption Devices Revenue (million), by Application 2025 & 2033
- Figure 27: Asia Pacific Adsorption Devices Revenue Share (%), by Application 2025 & 2033
- Figure 28: Asia Pacific Adsorption Devices Revenue (million), by Types 2025 & 2033
- Figure 29: Asia Pacific Adsorption Devices Revenue Share (%), by Types 2025 & 2033
- Figure 30: Asia Pacific Adsorption Devices Revenue (million), by Country 2025 & 2033
- Figure 31: Asia Pacific Adsorption Devices Revenue Share (%), by Country 2025 & 2033
List of Tables
- Table 1: Global Adsorption Devices Revenue million Forecast, by Application 2020 & 2033
- Table 2: Global Adsorption Devices Revenue million Forecast, by Types 2020 & 2033
- Table 3: Global Adsorption Devices Revenue million Forecast, by Region 2020 & 2033
- Table 4: Global Adsorption Devices Revenue million Forecast, by Application 2020 & 2033
- Table 5: Global Adsorption Devices Revenue million Forecast, by Types 2020 & 2033
- Table 6: Global Adsorption Devices Revenue million Forecast, by Country 2020 & 2033
- Table 7: United States Adsorption Devices Revenue (million) Forecast, by Application 2020 & 2033
- Table 8: Canada Adsorption Devices Revenue (million) Forecast, by Application 2020 & 2033
- Table 9: Mexico Adsorption Devices Revenue (million) Forecast, by Application 2020 & 2033
- Table 10: Global Adsorption Devices Revenue million Forecast, by Application 2020 & 2033
- Table 11: Global Adsorption Devices Revenue million Forecast, by Types 2020 & 2033
- Table 12: Global Adsorption Devices Revenue million Forecast, by Country 2020 & 2033
- Table 13: Brazil Adsorption Devices Revenue (million) Forecast, by Application 2020 & 2033
- Table 14: Argentina Adsorption Devices Revenue (million) Forecast, by Application 2020 & 2033
- Table 15: Rest of South America Adsorption Devices Revenue (million) Forecast, by Application 2020 & 2033
- Table 16: Global Adsorption Devices Revenue million Forecast, by Application 2020 & 2033
- Table 17: Global Adsorption Devices Revenue million Forecast, by Types 2020 & 2033
- Table 18: Global Adsorption Devices Revenue million Forecast, by Country 2020 & 2033
- Table 19: United Kingdom Adsorption Devices Revenue (million) Forecast, by Application 2020 & 2033
- Table 20: Germany Adsorption Devices Revenue (million) Forecast, by Application 2020 & 2033
- Table 21: France Adsorption Devices Revenue (million) Forecast, by Application 2020 & 2033
- Table 22: Italy Adsorption Devices Revenue (million) Forecast, by Application 2020 & 2033
- Table 23: Spain Adsorption Devices Revenue (million) Forecast, by Application 2020 & 2033
- Table 24: Russia Adsorption Devices Revenue (million) Forecast, by Application 2020 & 2033
- Table 25: Benelux Adsorption Devices Revenue (million) Forecast, by Application 2020 & 2033
- Table 26: Nordics Adsorption Devices Revenue (million) Forecast, by Application 2020 & 2033
- Table 27: Rest of Europe Adsorption Devices Revenue (million) Forecast, by Application 2020 & 2033
- Table 28: Global Adsorption Devices Revenue million Forecast, by Application 2020 & 2033
- Table 29: Global Adsorption Devices Revenue million Forecast, by Types 2020 & 2033
- Table 30: Global Adsorption Devices Revenue million Forecast, by Country 2020 & 2033
- Table 31: Turkey Adsorption Devices Revenue (million) Forecast, by Application 2020 & 2033
- Table 32: Israel Adsorption Devices Revenue (million) Forecast, by Application 2020 & 2033
- Table 33: GCC Adsorption Devices Revenue (million) Forecast, by Application 2020 & 2033
- Table 34: North Africa Adsorption Devices Revenue (million) Forecast, by Application 2020 & 2033
- Table 35: South Africa Adsorption Devices Revenue (million) Forecast, by Application 2020 & 2033
- Table 36: Rest of Middle East & Africa Adsorption Devices Revenue (million) Forecast, by Application 2020 & 2033
- Table 37: Global Adsorption Devices Revenue million Forecast, by Application 2020 & 2033
- Table 38: Global Adsorption Devices Revenue million Forecast, by Types 2020 & 2033
- Table 39: Global Adsorption Devices Revenue million Forecast, by Country 2020 & 2033
- Table 40: China Adsorption Devices Revenue (million) Forecast, by Application 2020 & 2033
- Table 41: India Adsorption Devices Revenue (million) Forecast, by Application 2020 & 2033
- Table 42: Japan Adsorption Devices Revenue (million) Forecast, by Application 2020 & 2033
- Table 43: South Korea Adsorption Devices Revenue (million) Forecast, by Application 2020 & 2033
- Table 44: ASEAN Adsorption Devices Revenue (million) Forecast, by Application 2020 & 2033
- Table 45: Oceania Adsorption Devices Revenue (million) Forecast, by Application 2020 & 2033
- Table 46: Rest of Asia Pacific Adsorption Devices Revenue (million) Forecast, by Application 2020 & 2033
Frequently Asked Questions
1. What is the projected Compound Annual Growth Rate (CAGR) of the Adsorption Devices?
The projected CAGR is approximately 5%.
2. Which companies are prominent players in the Adsorption Devices?
Key companies in the market include Durr Aktiengesellschaft, CECO Environmental, Evoqua Water Technologies, TIGG, Chemisch Thermische Prozesstechnik, TAIKISHA LIMITED, Environmental C & C Inc., Gulf Coast Environmental Systems, Monroe Environmental.
3. What are the main segments of the Adsorption Devices?
The market segments include Application, Types.
4. Can you provide details about the market size?
The market size is estimated to be USD 441 million as of 2022.
5. What are some drivers contributing to market growth?
N/A
6. What are the notable trends driving market growth?
N/A
7. Are there any restraints impacting market growth?
N/A
8. Can you provide examples of recent developments in the market?
N/A
9. What pricing options are available for accessing the report?
Pricing options include single-user, multi-user, and enterprise licenses priced at USD 2900.00, USD 4350.00, and USD 5800.00 respectively.
10. Is the market size provided in terms of value or volume?
The market size is provided in terms of value, measured in million.
11. Are there any specific market keywords associated with the report?
Yes, the market keyword associated with the report is "Adsorption Devices," which aids in identifying and referencing the specific market segment covered.
12. How do I determine which pricing option suits my needs best?
The pricing options vary based on user requirements and access needs. Individual users may opt for single-user licenses, while businesses requiring broader access may choose multi-user or enterprise licenses for cost-effective access to the report.
13. Are there any additional resources or data provided in the Adsorption Devices report?
While the report offers comprehensive insights, it's advisable to review the specific contents or supplementary materials provided to ascertain if additional resources or data are available.
14. How can I stay updated on further developments or reports in the Adsorption Devices?
To stay informed about further developments, trends, and reports in the Adsorption Devices, consider subscribing to industry newsletters, following relevant companies and organizations, or regularly checking reputable industry news sources and publications.
Methodology
Step 1 - Identification of Relevant Samples Size from Population Database


Step 2 - Approaches for Defining Global Market Size (Value, Volume* & Price*)

Note*: In applicable scenarios
Step 3 - Data Sources
Primary Research
- Web Analytics
- Survey Reports
- Research Institute
- Latest Research Reports
- Opinion Leaders
Secondary Research
- Annual Reports
- White Paper
- Latest Press Release
- Industry Association
- Paid Database
- Investor Presentations

Step 4 - Data Triangulation
Involves using different sources of information in order to increase the validity of a study
These sources are likely to be stakeholders in a program - participants, other researchers, program staff, other community members, and so on.
Then we put all data in single framework & apply various statistical tools to find out the dynamic on the market.
During the analysis stage, feedback from the stakeholder groups would be compared to determine areas of agreement as well as areas of divergence