

Key Insights
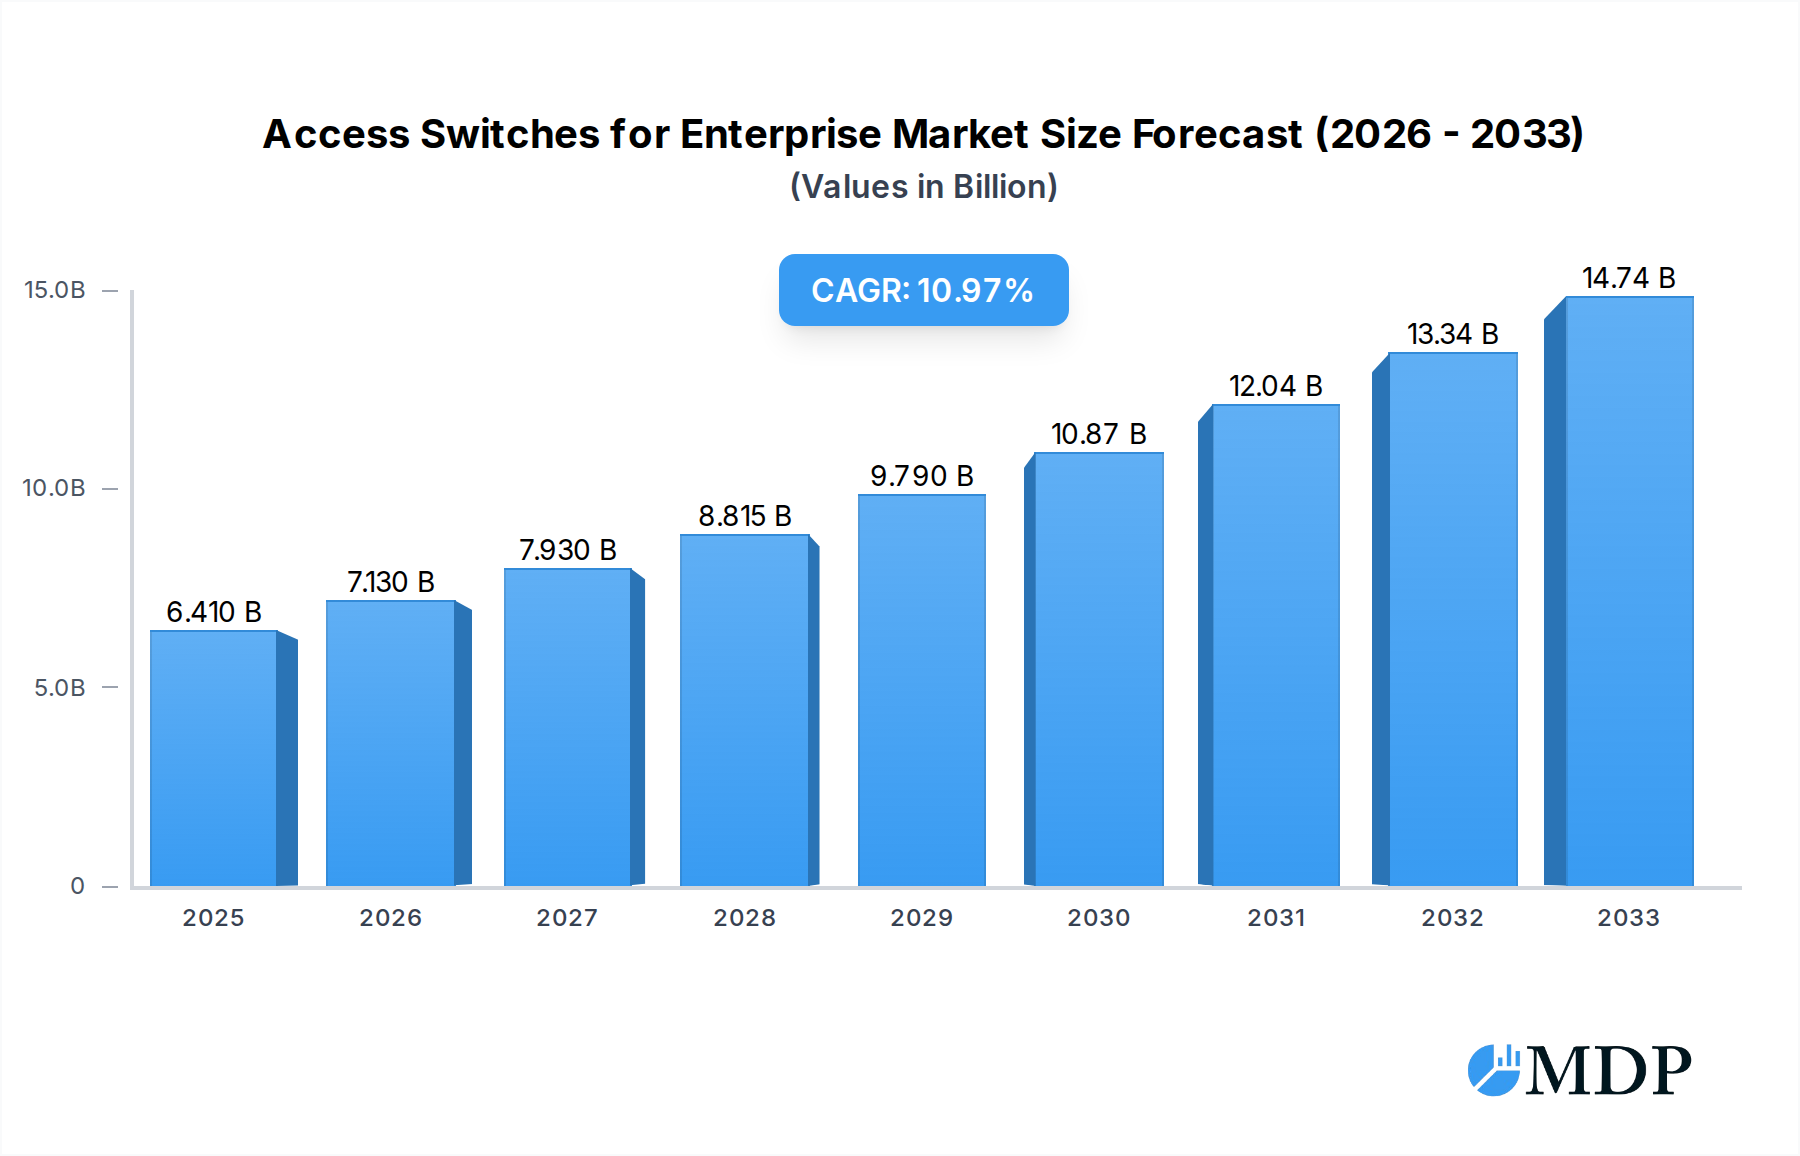
The Access Switches for Enterprise market is poised for substantial growth, projected to reach an estimated $6.41 billion in 2025. This robust expansion is driven by an impressive Compound Annual Growth Rate (CAGR) of 11.29% throughout the forecast period of 2025-2033. The primary catalysts for this surge are the increasing demand for enhanced network connectivity and speed, the proliferation of IoT devices in enterprise environments, and the ongoing digital transformation initiatives across industries. Enterprises are heavily investing in upgrading their network infrastructure to support the ever-growing volume of data traffic, cloud adoption, and the need for seamless remote work capabilities. This fuels the demand for advanced access switches that offer higher port densities, improved power-over-ethernet (PoE) capabilities, and enhanced security features essential for modern business operations.

Access Switches for Enterprise Market Size (In Billion)
The market segmentation reveals a strong presence across both Large Enterprise and Small and Medium-sized Enterprises (SMEs), indicating a broad adoption of access switch technologies. Fixed Managed switches are expected to dominate due to their advanced control, scalability, and security features, making them indispensable for complex enterprise networks. However, Fixed Unmanaged switches will continue to cater to the simpler networking needs of smaller businesses. Geographically, North America and Asia Pacific are anticipated to lead market share, driven by significant investments in IT infrastructure and rapid adoption of new technologies. Emerging economies within these regions, coupled with advancements in networking hardware and software, will further propel market expansion. Despite the strong growth trajectory, factors such as high initial investment costs for advanced solutions and intense competition among key players like Cisco, Huawei, and Arista Networks present strategic challenges that companies will need to navigate to capitalize fully on this dynamic market.
Access Switches for Enterprise Company Market Share
Access Switches for Enterprise Market: Comprehensive Report Analysis (2019-2033)
This in-depth report provides a strategic analysis of the Access Switches for Enterprise market, projecting a robust growth trajectory from 2019 to 2033. With a base year of 2025, the Access Switches for Enterprise forecast period (2025-2033) anticipates significant expansion, driven by increasing demand for high-speed networking solutions in Large Enterprise and Small and Medium-sized Enterprises (SMEs). The report meticulously examines market dynamics, key players, industry trends, and emerging opportunities, offering actionable insights for stakeholders navigating this evolving landscape. We delve into the intricate details of Fixed Managed and Fixed Unmanaged access switch segments, providing a clear understanding of their market penetration and future potential.
Access Switches for Enterprise Market Dynamics & Concentration
The Access Switches for Enterprise market exhibits a moderate level of concentration, with major players like Cisco, Huawei, and Arista Networks holding significant market share, estimated to be over 70 billion. Innovation remains a primary driver, fueled by the relentless pursuit of higher port densities, enhanced security features, and Power over Ethernet (PoE) capabilities. Regulatory frameworks, while generally supportive of digital infrastructure development, can introduce compliance complexities for manufacturers in certain regions. Product substitutes, such as direct fiber connections or wireless mesh networks, pose a minor threat, primarily in niche applications. End-user trends strongly favor scalable, cost-effective, and easy-to-manage network solutions, pushing demand towards Fixed Managed access switches. Mergers and acquisitions (M&A) activity has been consistent, with an estimated 30 significant deals in the historical period (2019-2024), consolidating market power and expanding product portfolios. These M&A activities are projected to continue, with an estimated 15 billion in deal value anticipated during the forecast period.
Access Switches for Enterprise Industry Trends & Analysis
The Access Switches for Enterprise market is poised for substantial growth, with a projected Compound Annual Growth Rate (CAGR) of approximately 8.5% from 2025 to 2033, reaching an estimated market size of 150 billion by 2033. This expansion is primarily fueled by the escalating adoption of cloud computing, the Internet of Things (IoT), and the increasing need for robust network infrastructure to support digital transformation initiatives across industries. Technological disruptions, including the advent of Wi-Fi 6E and upcoming Wi-Fi 7 standards, are compelling enterprises to upgrade their network edge devices to accommodate higher bandwidth requirements and lower latency. Consumer preferences are shifting towards intelligent, software-defined networking (SDN) enabled access switches that offer centralized management, enhanced visibility, and automated provisioning. The competitive dynamics are characterized by intense price competition, coupled with a strong emphasis on differentiated features and superior customer support. Market penetration for advanced access switch solutions is steadily increasing, with an estimated 65% of enterprises actively investing in network upgrades. The increasing reliance on mission-critical applications, such as video conferencing and real-time data analytics, necessitates reliable and high-performance access layer connectivity, further bolstering market growth. The proliferation of edge computing also contributes significantly, as it requires localized processing power and seamless connectivity, directly impacting the demand for sophisticated access switches.
Leading Markets & Segments in Access Switches for Enterprise
The Large Enterprise segment is the dominant force in the Access Switches for Enterprise market, representing an estimated 60 billion in revenue during the base year of 2025. This dominance is driven by their extensive network infrastructure requirements, the need for high-performance connectivity to support a large number of users and devices, and their greater budgetary capacity for advanced networking solutions. Key drivers of this dominance include:
- Economic Policies: Government initiatives promoting digital transformation and the development of smart cities create a fertile ground for large enterprises to invest in cutting-edge network technologies.
- Infrastructure Investment: Large enterprises are continuously investing in upgrading their core and edge network infrastructure to enhance operational efficiency, improve security, and enable new business models.
- Technological Adoption: These organizations are at the forefront of adopting new technologies like AI, machine learning, and advanced analytics, which are heavily reliant on high-bandwidth and low-latency network access.
- Scalability Requirements: The sheer volume of devices and users within large enterprises necessitates highly scalable and manageable access switch solutions, driving the demand for Fixed Managed switches.
The Fixed Managed segment within access switches is also experiencing significant growth, projected to account for over 75 billion in market value by 2033. This segment's strength lies in its superior control, security, and monitoring capabilities, which are paramount for complex enterprise environments.
- Advanced Security Features: Managed switches offer granular control over network access, VLAN segmentation, and intrusion detection systems, crucial for protecting sensitive enterprise data.
- Centralized Management: The ability to manage and monitor the entire access switch infrastructure from a single console significantly reduces operational overhead and simplifies troubleshooting for IT departments.
- Performance Optimization: Managed switches allow for traffic prioritization and Quality of Service (QoS) configurations, ensuring optimal performance for critical applications.
While Small and Medium-sized Enterprises (SMEs) represent a smaller portion of the current market, their growth trajectory is steep, fueled by digital transformation and the need for cost-effective networking solutions. The Fixed Unmanaged segment, while declining in overall market share, still holds relevance in smaller deployments where simplicity and cost are primary concerns.
Access Switches for Enterprise Product Developments
Product development in the Access Switches for Enterprise market is characterized by a focus on higher speeds (10GbE, 25GbE, 40GbE, 100GbE), increased port density, and advanced Power over Ethernet (PoE) capabilities to support a growing array of connected devices like IP cameras, wireless access points, and IoT sensors. Innovations in Software-Defined Networking (SDN) integration, enhanced security features such as deep packet inspection and advanced threat detection, and improved energy efficiency are key competitive advantages. The integration of AI for predictive maintenance and automated network management is also gaining traction. These developments cater to the evolving needs of Large Enterprise and SMEs, ensuring seamless connectivity and robust performance for digital transformation initiatives.
Key Drivers of Access Switches for Enterprise Growth
The Access Switches for Enterprise market is propelled by several key drivers. Technologically, the insatiable demand for higher bandwidth driven by cloud computing, IoT, and multimedia applications is paramount. Economically, increasing IT spending by businesses across various sectors, coupled with government initiatives to boost digital infrastructure, provides a strong foundation for growth. Regulatory factors, such as mandates for enhanced network security and data privacy, also encourage enterprises to invest in more sophisticated access switch solutions. Furthermore, the ongoing digital transformation across industries necessitates robust and scalable network connectivity at the edge, directly fueling the demand for advanced access switches.
Challenges in the Access Switches for Enterprise Market
Despite robust growth, the Access Switches for Enterprise market faces several challenges. Supply chain disruptions, exacerbated by global geopolitical events and component shortages, can lead to increased lead times and higher costs, impacting market availability and pricing. Intense competitive pressure from both established players and emerging vendors can lead to price erosion and reduced profit margins. Evolving security threats necessitate continuous investment in advanced security features, which can be costly for both vendors and end-users. The complexity of managing large-scale enterprise networks also presents a challenge, requiring robust management software and skilled IT personnel. Regulatory hurdles related to data privacy and network interoperability in certain regions can also pose obstacles.
Emerging Opportunities in Access Switches for Enterprise
Emerging opportunities in the Access Switches for Enterprise market are centered around several catalysts for long-term growth. The rapid expansion of 5G networks and the subsequent rise of edge computing create a significant demand for high-performance, low-latency access switches at the network edge. Strategic partnerships between access switch manufacturers and cloud providers or IoT platform vendors can unlock new market segments and create bundled solutions. Market expansion into developing economies, where digital transformation is accelerating, presents substantial untapped potential. Furthermore, the increasing demand for intelligent network automation, driven by AI and machine learning, offers opportunities for vendors to develop and offer value-added software and services.
Leading Players in the Access Switches for Enterprise Sector
- Cisco
- Huawei
- Arista Networks
- Dell Technologies
- Broadcom
- DASAN Network Solutions
- ubiQuoss
- Dayou Plus
- Piolink
- Samji Electronics
- ELTEX
- Juniper Networks
- HP Enterprise
- Extreme Networks
- TP-Link
- HFR
- Soltech Infonet
- Syscable Korea
- Tellion, Inc
- Handreamnet
Key Milestones in Access Switches for Enterprise Industry
- 2019: Introduction of Wi-Fi 6 standard, driving demand for higher-speed enterprise access switches.
- 2020: Increased adoption of remote work models, accelerating investment in enterprise network infrastructure.
- 2021: Significant growth in IoT deployments, requiring more robust and intelligent access layer connectivity.
- 2022: Intensified focus on cybersecurity, leading to the integration of advanced security features in access switches.
- 2023: Emerging trends in edge computing begin to influence access switch design and capabilities.
- 2024: Continued consolidation within the market through strategic mergers and acquisitions.
- 2025 (Base Year): Expected market size of approximately 100 billion, with strong growth anticipated.
- 2026: Anticipated widespread adoption of 2.5GbE and 5GbE ports on enterprise access switches.
- 2027: Growing importance of Power over Ethernet Plus (PoE+) and PoE++ for powering a wider range of devices.
- 2028: Increased integration of AI and machine learning for network automation and predictive maintenance.
- 2029: Maturation of SD-WAN solutions, impacting the role and capabilities of access switches.
- 2030: Continued evolution of Wi-Fi standards (e.g., Wi-Fi 7) demanding next-generation access layer support.
- 2031: Expansion of smart city initiatives driving demand for connected infrastructure and access switches.
- 2032: Growing focus on sustainability and energy-efficient networking solutions.
- 2033 (Forecast End Year): Projected market size of approximately 150 billion, with sustained growth.
Strategic Outlook for Access Switches for Enterprise Market
The strategic outlook for the Access Switches for Enterprise market remains exceptionally positive, driven by continuous technological advancements and the ever-increasing digital footprint of businesses. Key growth accelerators include the pervasive adoption of IoT devices, the demand for higher bandwidth to support rich multimedia content and real-time applications, and the ongoing migration towards cloud-native environments. The increasing sophistication of cybersecurity threats will continue to drive demand for intelligent, secure access solutions. Strategic opportunities lie in the development of integrated solutions that combine advanced networking hardware with sophisticated software for network automation, analytics, and security. The global expansion of digital infrastructure, particularly in emerging economies, presents a significant untapped market potential. Embracing edge computing and 5G integration will be crucial for long-term success.
Access Switches for Enterprise Segmentation
-
1. Application
- 1.1. Large Enterprise
- 1.2. Small and Medium-sized Enterprises
-
2. Types
- 2.1. Fixed Managed
- 2.2. Fixed Unmanaged
Access Switches for Enterprise Segmentation By Geography
-
1. North America
- 1.1. United States
- 1.2. Canada
- 1.3. Mexico
-
2. South America
- 2.1. Brazil
- 2.2. Argentina
- 2.3. Rest of South America
-
3. Europe
- 3.1. United Kingdom
- 3.2. Germany
- 3.3. France
- 3.4. Italy
- 3.5. Spain
- 3.6. Russia
- 3.7. Benelux
- 3.8. Nordics
- 3.9. Rest of Europe
-
4. Middle East & Africa
- 4.1. Turkey
- 4.2. Israel
- 4.3. GCC
- 4.4. North Africa
- 4.5. South Africa
- 4.6. Rest of Middle East & Africa
-
5. Asia Pacific
- 5.1. China
- 5.2. India
- 5.3. Japan
- 5.4. South Korea
- 5.5. ASEAN
- 5.6. Oceania
- 5.7. Rest of Asia Pacific
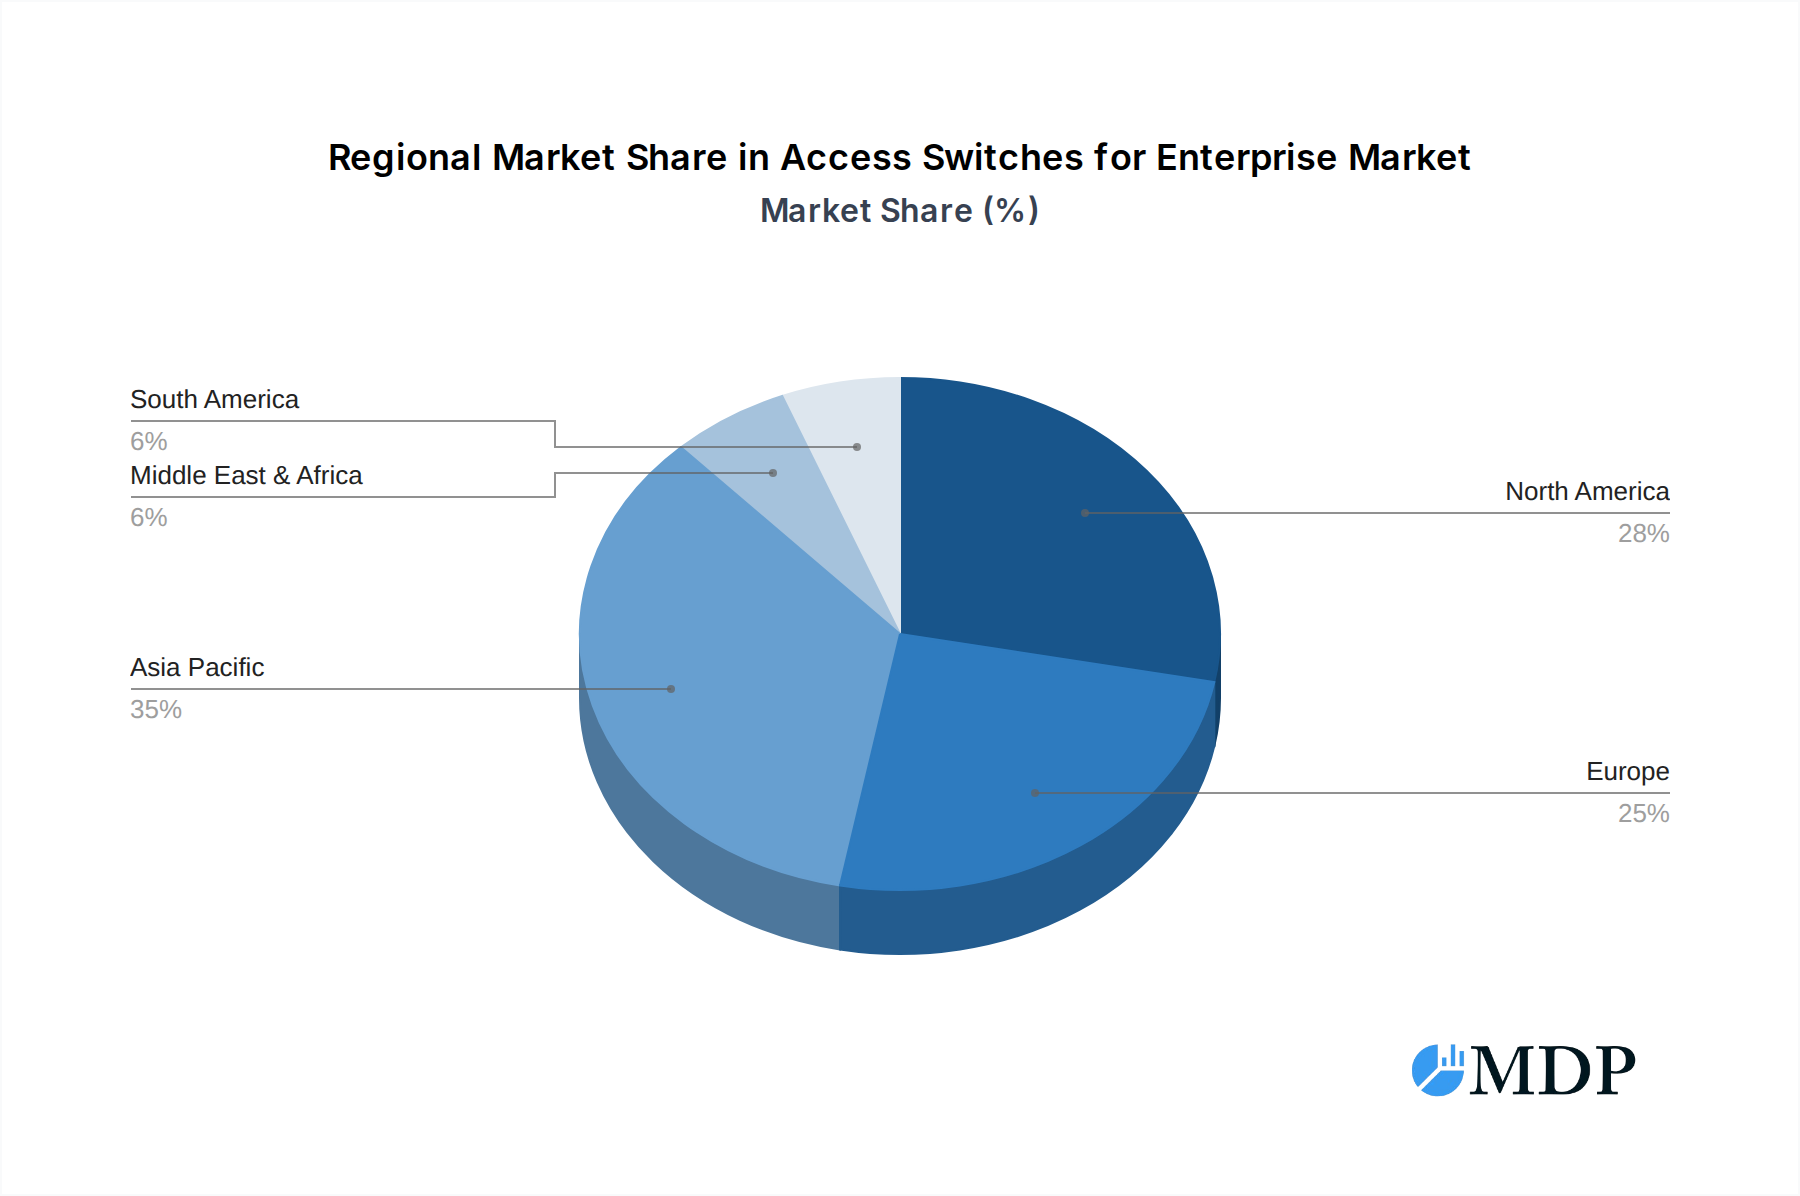
Access Switches for Enterprise Regional Market Share
Geographic Coverage of Access Switches for Enterprise
Access Switches for Enterprise REPORT HIGHLIGHTS
| Aspects | Details |
|---|---|
| Study Period | 2020-2034 |
| Base Year | 2025 |
| Estimated Year | 2026 |
| Forecast Period | 2026-2034 |
| Historical Period | 2020-2025 |
| Growth Rate | CAGR of 11.29% from 2020-2034 |
| Segmentation |
|
Table of Contents
- 1. Introduction
- 1.1. Research Scope
- 1.2. Market Segmentation
- 1.3. Research Methodology
- 1.4. Definitions and Assumptions
- 2. Executive Summary
- 2.1. Introduction
- 3. Market Dynamics
- 3.1. Introduction
- 3.2. Market Drivers
- 3.3. Market Restrains
- 3.4. Market Trends
- 4. Market Factor Analysis
- 4.1. Porters Five Forces
- 4.2. Supply/Value Chain
- 4.3. PESTEL analysis
- 4.4. Market Entropy
- 4.5. Patent/Trademark Analysis
- 5. Global Access Switches for Enterprise Analysis, Insights and Forecast, 2020-2032
- 5.1. Market Analysis, Insights and Forecast - by Application
- 5.1.1. Large Enterprise
- 5.1.2. Small and Medium-sized Enterprises
- 5.2. Market Analysis, Insights and Forecast - by Types
- 5.2.1. Fixed Managed
- 5.2.2. Fixed Unmanaged
- 5.3. Market Analysis, Insights and Forecast - by Region
- 5.3.1. North America
- 5.3.2. South America
- 5.3.3. Europe
- 5.3.4. Middle East & Africa
- 5.3.5. Asia Pacific
- 5.1. Market Analysis, Insights and Forecast - by Application
- 6. North America Access Switches for Enterprise Analysis, Insights and Forecast, 2020-2032
- 6.1. Market Analysis, Insights and Forecast - by Application
- 6.1.1. Large Enterprise
- 6.1.2. Small and Medium-sized Enterprises
- 6.2. Market Analysis, Insights and Forecast - by Types
- 6.2.1. Fixed Managed
- 6.2.2. Fixed Unmanaged
- 6.1. Market Analysis, Insights and Forecast - by Application
- 7. South America Access Switches for Enterprise Analysis, Insights and Forecast, 2020-2032
- 7.1. Market Analysis, Insights and Forecast - by Application
- 7.1.1. Large Enterprise
- 7.1.2. Small and Medium-sized Enterprises
- 7.2. Market Analysis, Insights and Forecast - by Types
- 7.2.1. Fixed Managed
- 7.2.2. Fixed Unmanaged
- 7.1. Market Analysis, Insights and Forecast - by Application
- 8. Europe Access Switches for Enterprise Analysis, Insights and Forecast, 2020-2032
- 8.1. Market Analysis, Insights and Forecast - by Application
- 8.1.1. Large Enterprise
- 8.1.2. Small and Medium-sized Enterprises
- 8.2. Market Analysis, Insights and Forecast - by Types
- 8.2.1. Fixed Managed
- 8.2.2. Fixed Unmanaged
- 8.1. Market Analysis, Insights and Forecast - by Application
- 9. Middle East & Africa Access Switches for Enterprise Analysis, Insights and Forecast, 2020-2032
- 9.1. Market Analysis, Insights and Forecast - by Application
- 9.1.1. Large Enterprise
- 9.1.2. Small and Medium-sized Enterprises
- 9.2. Market Analysis, Insights and Forecast - by Types
- 9.2.1. Fixed Managed
- 9.2.2. Fixed Unmanaged
- 9.1. Market Analysis, Insights and Forecast - by Application
- 10. Asia Pacific Access Switches for Enterprise Analysis, Insights and Forecast, 2020-2032
- 10.1. Market Analysis, Insights and Forecast - by Application
- 10.1.1. Large Enterprise
- 10.1.2. Small and Medium-sized Enterprises
- 10.2. Market Analysis, Insights and Forecast - by Types
- 10.2.1. Fixed Managed
- 10.2.2. Fixed Unmanaged
- 10.1. Market Analysis, Insights and Forecast - by Application
- 11. Competitive Analysis
- 11.1. Global Market Share Analysis 2025
- 11.2. Company Profiles
- 11.2.1 Cisco
- 11.2.1.1. Overview
- 11.2.1.2. Products
- 11.2.1.3. SWOT Analysis
- 11.2.1.4. Recent Developments
- 11.2.1.5. Financials (Based on Availability)
- 11.2.2 Huawei
- 11.2.2.1. Overview
- 11.2.2.2. Products
- 11.2.2.3. SWOT Analysis
- 11.2.2.4. Recent Developments
- 11.2.2.5. Financials (Based on Availability)
- 11.2.3 Arista Networks
- 11.2.3.1. Overview
- 11.2.3.2. Products
- 11.2.3.3. SWOT Analysis
- 11.2.3.4. Recent Developments
- 11.2.3.5. Financials (Based on Availability)
- 11.2.4 Dell Technologies
- 11.2.4.1. Overview
- 11.2.4.2. Products
- 11.2.4.3. SWOT Analysis
- 11.2.4.4. Recent Developments
- 11.2.4.5. Financials (Based on Availability)
- 11.2.5 Broadcom
- 11.2.5.1. Overview
- 11.2.5.2. Products
- 11.2.5.3. SWOT Analysis
- 11.2.5.4. Recent Developments
- 11.2.5.5. Financials (Based on Availability)
- 11.2.6 DASAN Network Solutions
- 11.2.6.1. Overview
- 11.2.6.2. Products
- 11.2.6.3. SWOT Analysis
- 11.2.6.4. Recent Developments
- 11.2.6.5. Financials (Based on Availability)
- 11.2.7 ubiQuoss
- 11.2.7.1. Overview
- 11.2.7.2. Products
- 11.2.7.3. SWOT Analysis
- 11.2.7.4. Recent Developments
- 11.2.7.5. Financials (Based on Availability)
- 11.2.8 Dayou Plus
- 11.2.8.1. Overview
- 11.2.8.2. Products
- 11.2.8.3. SWOT Analysis
- 11.2.8.4. Recent Developments
- 11.2.8.5. Financials (Based on Availability)
- 11.2.9 Piolink
- 11.2.9.1. Overview
- 11.2.9.2. Products
- 11.2.9.3. SWOT Analysis
- 11.2.9.4. Recent Developments
- 11.2.9.5. Financials (Based on Availability)
- 11.2.10 Samji Electronics
- 11.2.10.1. Overview
- 11.2.10.2. Products
- 11.2.10.3. SWOT Analysis
- 11.2.10.4. Recent Developments
- 11.2.10.5. Financials (Based on Availability)
- 11.2.11 ELTEX
- 11.2.11.1. Overview
- 11.2.11.2. Products
- 11.2.11.3. SWOT Analysis
- 11.2.11.4. Recent Developments
- 11.2.11.5. Financials (Based on Availability)
- 11.2.12 Juniper Networks
- 11.2.12.1. Overview
- 11.2.12.2. Products
- 11.2.12.3. SWOT Analysis
- 11.2.12.4. Recent Developments
- 11.2.12.5. Financials (Based on Availability)
- 11.2.13 HP Enterprise
- 11.2.13.1. Overview
- 11.2.13.2. Products
- 11.2.13.3. SWOT Analysis
- 11.2.13.4. Recent Developments
- 11.2.13.5. Financials (Based on Availability)
- 11.2.14 Extreme Networks
- 11.2.14.1. Overview
- 11.2.14.2. Products
- 11.2.14.3. SWOT Analysis
- 11.2.14.4. Recent Developments
- 11.2.14.5. Financials (Based on Availability)
- 11.2.15 TP-Link
- 11.2.15.1. Overview
- 11.2.15.2. Products
- 11.2.15.3. SWOT Analysis
- 11.2.15.4. Recent Developments
- 11.2.15.5. Financials (Based on Availability)
- 11.2.16 HFR
- 11.2.16.1. Overview
- 11.2.16.2. Products
- 11.2.16.3. SWOT Analysis
- 11.2.16.4. Recent Developments
- 11.2.16.5. Financials (Based on Availability)
- 11.2.17 Soltech Infonet
- 11.2.17.1. Overview
- 11.2.17.2. Products
- 11.2.17.3. SWOT Analysis
- 11.2.17.4. Recent Developments
- 11.2.17.5. Financials (Based on Availability)
- 11.2.18 Syscable Korea
- 11.2.18.1. Overview
- 11.2.18.2. Products
- 11.2.18.3. SWOT Analysis
- 11.2.18.4. Recent Developments
- 11.2.18.5. Financials (Based on Availability)
- 11.2.19 Tellion
- 11.2.19.1. Overview
- 11.2.19.2. Products
- 11.2.19.3. SWOT Analysis
- 11.2.19.4. Recent Developments
- 11.2.19.5. Financials (Based on Availability)
- 11.2.20 Inc
- 11.2.20.1. Overview
- 11.2.20.2. Products
- 11.2.20.3. SWOT Analysis
- 11.2.20.4. Recent Developments
- 11.2.20.5. Financials (Based on Availability)
- 11.2.21 Handreamnet
- 11.2.21.1. Overview
- 11.2.21.2. Products
- 11.2.21.3. SWOT Analysis
- 11.2.21.4. Recent Developments
- 11.2.21.5. Financials (Based on Availability)
- 11.2.1 Cisco
List of Figures
- Figure 1: Global Access Switches for Enterprise Revenue Breakdown (billion, %) by Region 2025 & 2033
- Figure 2: North America Access Switches for Enterprise Revenue (billion), by Application 2025 & 2033
- Figure 3: North America Access Switches for Enterprise Revenue Share (%), by Application 2025 & 2033
- Figure 4: North America Access Switches for Enterprise Revenue (billion), by Types 2025 & 2033
- Figure 5: North America Access Switches for Enterprise Revenue Share (%), by Types 2025 & 2033
- Figure 6: North America Access Switches for Enterprise Revenue (billion), by Country 2025 & 2033
- Figure 7: North America Access Switches for Enterprise Revenue Share (%), by Country 2025 & 2033
- Figure 8: South America Access Switches for Enterprise Revenue (billion), by Application 2025 & 2033
- Figure 9: South America Access Switches for Enterprise Revenue Share (%), by Application 2025 & 2033
- Figure 10: South America Access Switches for Enterprise Revenue (billion), by Types 2025 & 2033
- Figure 11: South America Access Switches for Enterprise Revenue Share (%), by Types 2025 & 2033
- Figure 12: South America Access Switches for Enterprise Revenue (billion), by Country 2025 & 2033
- Figure 13: South America Access Switches for Enterprise Revenue Share (%), by Country 2025 & 2033
- Figure 14: Europe Access Switches for Enterprise Revenue (billion), by Application 2025 & 2033
- Figure 15: Europe Access Switches for Enterprise Revenue Share (%), by Application 2025 & 2033
- Figure 16: Europe Access Switches for Enterprise Revenue (billion), by Types 2025 & 2033
- Figure 17: Europe Access Switches for Enterprise Revenue Share (%), by Types 2025 & 2033
- Figure 18: Europe Access Switches for Enterprise Revenue (billion), by Country 2025 & 2033
- Figure 19: Europe Access Switches for Enterprise Revenue Share (%), by Country 2025 & 2033
- Figure 20: Middle East & Africa Access Switches for Enterprise Revenue (billion), by Application 2025 & 2033
- Figure 21: Middle East & Africa Access Switches for Enterprise Revenue Share (%), by Application 2025 & 2033
- Figure 22: Middle East & Africa Access Switches for Enterprise Revenue (billion), by Types 2025 & 2033
- Figure 23: Middle East & Africa Access Switches for Enterprise Revenue Share (%), by Types 2025 & 2033
- Figure 24: Middle East & Africa Access Switches for Enterprise Revenue (billion), by Country 2025 & 2033
- Figure 25: Middle East & Africa Access Switches for Enterprise Revenue Share (%), by Country 2025 & 2033
- Figure 26: Asia Pacific Access Switches for Enterprise Revenue (billion), by Application 2025 & 2033
- Figure 27: Asia Pacific Access Switches for Enterprise Revenue Share (%), by Application 2025 & 2033
- Figure 28: Asia Pacific Access Switches for Enterprise Revenue (billion), by Types 2025 & 2033
- Figure 29: Asia Pacific Access Switches for Enterprise Revenue Share (%), by Types 2025 & 2033
- Figure 30: Asia Pacific Access Switches for Enterprise Revenue (billion), by Country 2025 & 2033
- Figure 31: Asia Pacific Access Switches for Enterprise Revenue Share (%), by Country 2025 & 2033
List of Tables
- Table 1: Global Access Switches for Enterprise Revenue billion Forecast, by Application 2020 & 2033
- Table 2: Global Access Switches for Enterprise Revenue billion Forecast, by Types 2020 & 2033
- Table 3: Global Access Switches for Enterprise Revenue billion Forecast, by Region 2020 & 2033
- Table 4: Global Access Switches for Enterprise Revenue billion Forecast, by Application 2020 & 2033
- Table 5: Global Access Switches for Enterprise Revenue billion Forecast, by Types 2020 & 2033
- Table 6: Global Access Switches for Enterprise Revenue billion Forecast, by Country 2020 & 2033
- Table 7: United States Access Switches for Enterprise Revenue (billion) Forecast, by Application 2020 & 2033
- Table 8: Canada Access Switches for Enterprise Revenue (billion) Forecast, by Application 2020 & 2033
- Table 9: Mexico Access Switches for Enterprise Revenue (billion) Forecast, by Application 2020 & 2033
- Table 10: Global Access Switches for Enterprise Revenue billion Forecast, by Application 2020 & 2033
- Table 11: Global Access Switches for Enterprise Revenue billion Forecast, by Types 2020 & 2033
- Table 12: Global Access Switches for Enterprise Revenue billion Forecast, by Country 2020 & 2033
- Table 13: Brazil Access Switches for Enterprise Revenue (billion) Forecast, by Application 2020 & 2033
- Table 14: Argentina Access Switches for Enterprise Revenue (billion) Forecast, by Application 2020 & 2033
- Table 15: Rest of South America Access Switches for Enterprise Revenue (billion) Forecast, by Application 2020 & 2033
- Table 16: Global Access Switches for Enterprise Revenue billion Forecast, by Application 2020 & 2033
- Table 17: Global Access Switches for Enterprise Revenue billion Forecast, by Types 2020 & 2033
- Table 18: Global Access Switches for Enterprise Revenue billion Forecast, by Country 2020 & 2033
- Table 19: United Kingdom Access Switches for Enterprise Revenue (billion) Forecast, by Application 2020 & 2033
- Table 20: Germany Access Switches for Enterprise Revenue (billion) Forecast, by Application 2020 & 2033
- Table 21: France Access Switches for Enterprise Revenue (billion) Forecast, by Application 2020 & 2033
- Table 22: Italy Access Switches for Enterprise Revenue (billion) Forecast, by Application 2020 & 2033
- Table 23: Spain Access Switches for Enterprise Revenue (billion) Forecast, by Application 2020 & 2033
- Table 24: Russia Access Switches for Enterprise Revenue (billion) Forecast, by Application 2020 & 2033
- Table 25: Benelux Access Switches for Enterprise Revenue (billion) Forecast, by Application 2020 & 2033
- Table 26: Nordics Access Switches for Enterprise Revenue (billion) Forecast, by Application 2020 & 2033
- Table 27: Rest of Europe Access Switches for Enterprise Revenue (billion) Forecast, by Application 2020 & 2033
- Table 28: Global Access Switches for Enterprise Revenue billion Forecast, by Application 2020 & 2033
- Table 29: Global Access Switches for Enterprise Revenue billion Forecast, by Types 2020 & 2033
- Table 30: Global Access Switches for Enterprise Revenue billion Forecast, by Country 2020 & 2033
- Table 31: Turkey Access Switches for Enterprise Revenue (billion) Forecast, by Application 2020 & 2033
- Table 32: Israel Access Switches for Enterprise Revenue (billion) Forecast, by Application 2020 & 2033
- Table 33: GCC Access Switches for Enterprise Revenue (billion) Forecast, by Application 2020 & 2033
- Table 34: North Africa Access Switches for Enterprise Revenue (billion) Forecast, by Application 2020 & 2033
- Table 35: South Africa Access Switches for Enterprise Revenue (billion) Forecast, by Application 2020 & 2033
- Table 36: Rest of Middle East & Africa Access Switches for Enterprise Revenue (billion) Forecast, by Application 2020 & 2033
- Table 37: Global Access Switches for Enterprise Revenue billion Forecast, by Application 2020 & 2033
- Table 38: Global Access Switches for Enterprise Revenue billion Forecast, by Types 2020 & 2033
- Table 39: Global Access Switches for Enterprise Revenue billion Forecast, by Country 2020 & 2033
- Table 40: China Access Switches for Enterprise Revenue (billion) Forecast, by Application 2020 & 2033
- Table 41: India Access Switches for Enterprise Revenue (billion) Forecast, by Application 2020 & 2033
- Table 42: Japan Access Switches for Enterprise Revenue (billion) Forecast, by Application 2020 & 2033
- Table 43: South Korea Access Switches for Enterprise Revenue (billion) Forecast, by Application 2020 & 2033
- Table 44: ASEAN Access Switches for Enterprise Revenue (billion) Forecast, by Application 2020 & 2033
- Table 45: Oceania Access Switches for Enterprise Revenue (billion) Forecast, by Application 2020 & 2033
- Table 46: Rest of Asia Pacific Access Switches for Enterprise Revenue (billion) Forecast, by Application 2020 & 2033
Frequently Asked Questions
1. What is the projected Compound Annual Growth Rate (CAGR) of the Access Switches for Enterprise?
The projected CAGR is approximately 11.29%.
2. Which companies are prominent players in the Access Switches for Enterprise?
Key companies in the market include Cisco, Huawei, Arista Networks, Dell Technologies, Broadcom, DASAN Network Solutions, ubiQuoss, Dayou Plus, Piolink, Samji Electronics, ELTEX, Juniper Networks, HP Enterprise, Extreme Networks, TP-Link, HFR, Soltech Infonet, Syscable Korea, Tellion, Inc, Handreamnet.
3. What are the main segments of the Access Switches for Enterprise?
The market segments include Application, Types.
4. Can you provide details about the market size?
The market size is estimated to be USD 6.41 billion as of 2022.
5. What are some drivers contributing to market growth?
N/A
6. What are the notable trends driving market growth?
N/A
7. Are there any restraints impacting market growth?
N/A
8. Can you provide examples of recent developments in the market?
N/A
9. What pricing options are available for accessing the report?
Pricing options include single-user, multi-user, and enterprise licenses priced at USD 4900.00, USD 7350.00, and USD 9800.00 respectively.
10. Is the market size provided in terms of value or volume?
The market size is provided in terms of value, measured in billion.
11. Are there any specific market keywords associated with the report?
Yes, the market keyword associated with the report is "Access Switches for Enterprise," which aids in identifying and referencing the specific market segment covered.
12. How do I determine which pricing option suits my needs best?
The pricing options vary based on user requirements and access needs. Individual users may opt for single-user licenses, while businesses requiring broader access may choose multi-user or enterprise licenses for cost-effective access to the report.
13. Are there any additional resources or data provided in the Access Switches for Enterprise report?
While the report offers comprehensive insights, it's advisable to review the specific contents or supplementary materials provided to ascertain if additional resources or data are available.
14. How can I stay updated on further developments or reports in the Access Switches for Enterprise?
To stay informed about further developments, trends, and reports in the Access Switches for Enterprise, consider subscribing to industry newsletters, following relevant companies and organizations, or regularly checking reputable industry news sources and publications.
Methodology
Step 1 - Identification of Relevant Samples Size from Population Database


Step 2 - Approaches for Defining Global Market Size (Value, Volume* & Price*)

Note*: In applicable scenarios
Step 3 - Data Sources
Primary Research
- Web Analytics
- Survey Reports
- Research Institute
- Latest Research Reports
- Opinion Leaders
Secondary Research
- Annual Reports
- White Paper
- Latest Press Release
- Industry Association
- Paid Database
- Investor Presentations

Step 4 - Data Triangulation
Involves using different sources of information in order to increase the validity of a study
These sources are likely to be stakeholders in a program - participants, other researchers, program staff, other community members, and so on.
Then we put all data in single framework & apply various statistical tools to find out the dynamic on the market.
During the analysis stage, feedback from the stakeholder groups would be compared to determine areas of agreement as well as areas of divergence