

Key Insights
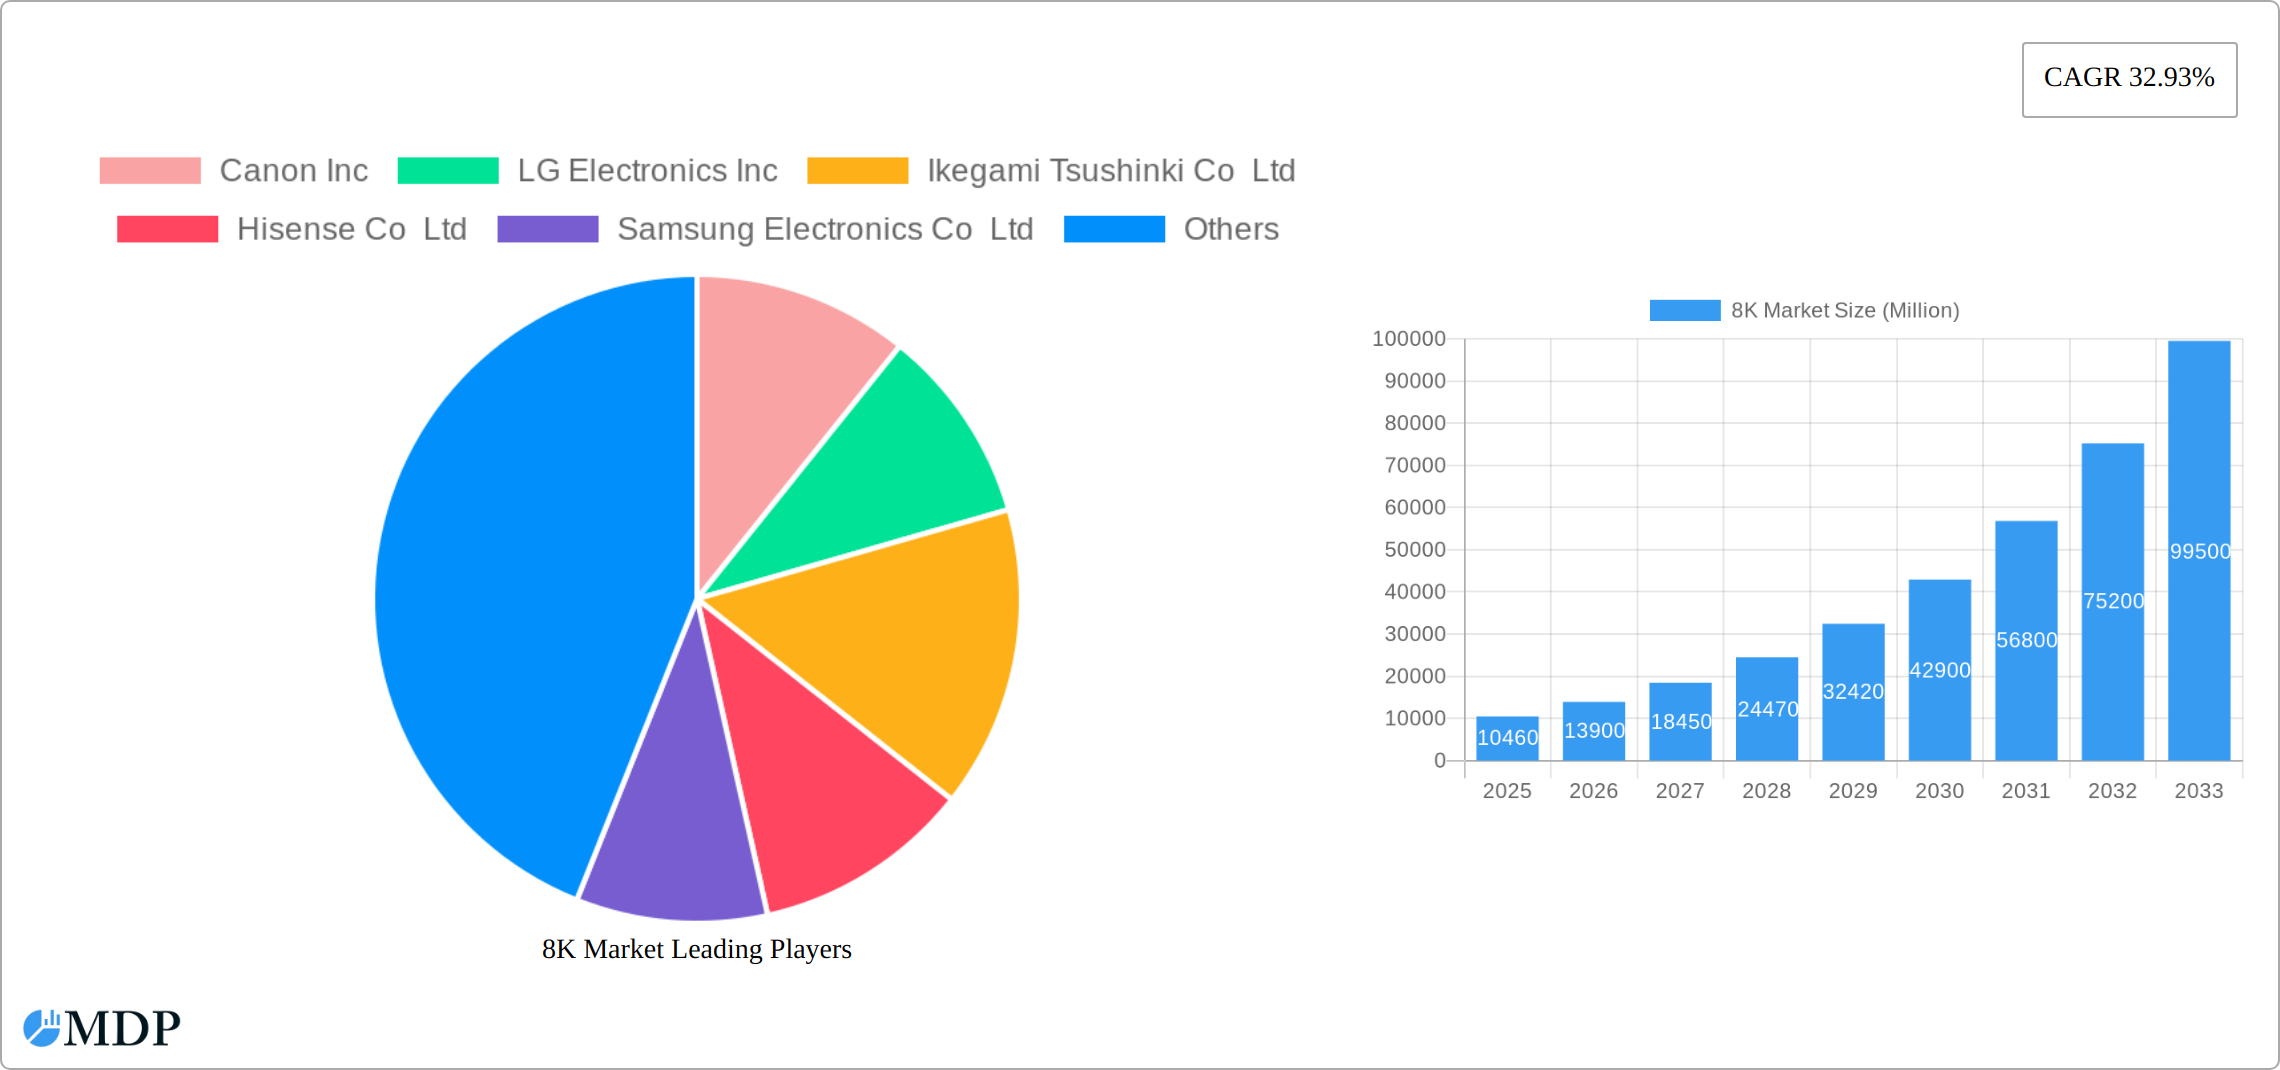
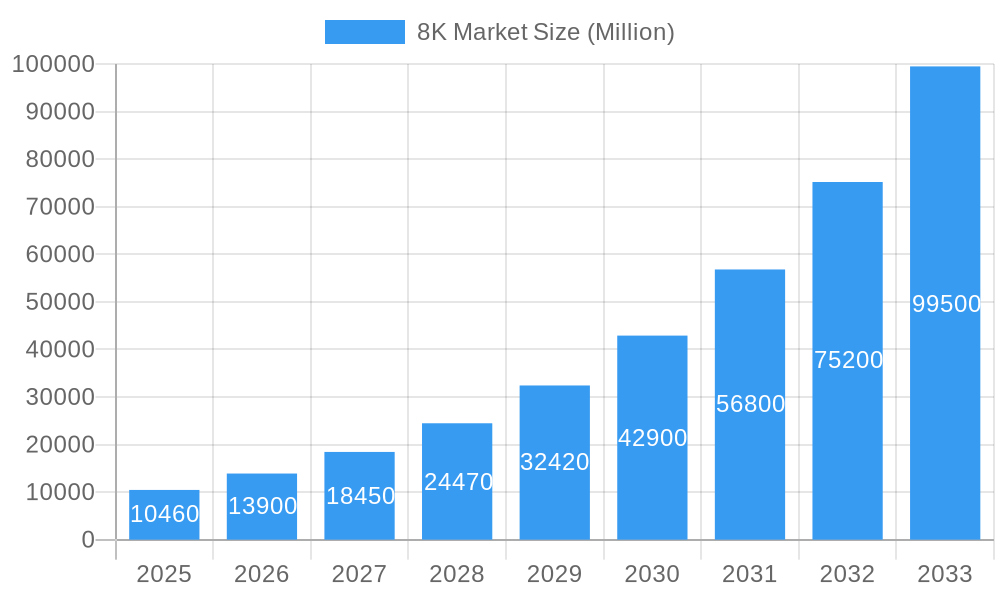
The 8K display market is experiencing explosive growth, projected to reach a market size of $10.46 billion in 2025, exhibiting a remarkable Compound Annual Growth Rate (CAGR) of 32.93%. This surge is driven by several key factors. Firstly, advancements in display technology are making 8K displays more affordable and accessible to consumers. Secondly, the increasing demand for high-resolution visuals in various applications, such as healthcare (medical imaging), consumer electronics (high-end televisions and monitors), and commercial sectors (digital signage and broadcasting), is fueling market expansion. Furthermore, the growing popularity of streaming platforms offering 8K content is further stimulating demand. Major players like Samsung, LG, and Canon are aggressively investing in research and development, introducing innovative products, and expanding their market presence globally. The market segmentation reveals that televisions currently hold the largest share within the device segment, while healthcare and medical applications dominate the application segment. This trend is expected to continue, driven by the need for sharper, more detailed images in medical diagnostics. However, challenges remain, including the relatively high cost of 8K displays compared to lower-resolution alternatives and the limited availability of native 8K content. Despite these hurdles, the long-term growth outlook remains strongly positive, with significant opportunities for expansion across diverse geographical regions, including North America, Europe, and the rapidly developing Asia-Pacific market. The continued refinement of display technologies and the increasing affordability of 8K displays are poised to further accelerate market growth throughout the forecast period (2025-2033).
8K Market Market Size (In Billion)
The geographical distribution of the 8K market reflects the global nature of technological adoption. North America and Asia-Pacific currently represent the largest regional markets, with strong demand driven by the high concentration of tech-savvy consumers and significant investments in infrastructure. However, growth is expected across all regions, fueled by rising disposable incomes, increasing digitalization, and expanding access to high-speed internet. Europe is expected to see substantial growth, driven by the adoption of 8K technology in various industries, including healthcare and broadcasting. Emerging markets in Asia-Pacific and South America also present significant growth opportunities as consumer purchasing power increases. Competition within the market is fierce, with established players constantly striving to differentiate their products through technological innovations, premium features, and competitive pricing. This competitive landscape further enhances the market’s dynamic nature and drives innovation, ultimately benefiting consumers.
8K Market Company Market Share
8K Market Report: A Comprehensive Analysis (2019-2033)
This in-depth report provides a comprehensive analysis of the 8K market, encompassing market dynamics, industry trends, leading players, and future growth prospects. With a study period spanning 2019-2033, a base year of 2025, and a forecast period from 2025-2033, this report offers invaluable insights for businesses, investors, and industry stakeholders seeking to navigate this rapidly evolving landscape. We delve into key segments like Monitors, Televisions, Cameras, and Full Dome systems across diverse applications including Healthcare, Consumer Electronics, and Commercial sectors. The report is meticulously crafted, avoiding placeholders and utilizing predicted values where necessary.
8K Market Market Dynamics & Concentration
The 8K market is characterized by a dynamic interplay of factors influencing its growth and concentration. Market concentration is currently moderate, with several key players vying for dominance. However, significant mergers and acquisitions (M&A) activity is anticipated, potentially leading to increased consolidation in the coming years. We project xx Million M&A deals in the forecast period. Innovation in display technologies, particularly advancements in LED and Mini-LED backlighting, are key drivers. Regulatory frameworks, including energy efficiency standards, impact product design and manufacturing. The existence of 4K technology as a substitute poses a challenge, although the superior visual quality of 8K is expected to drive adoption. End-user trends show a growing preference for high-resolution displays, particularly in premium segments, and increasing demand from content creators further fueling market expansion.
- Market Share: Samsung Electronics Co Ltd currently holds the largest market share (xx%), followed by LG Electronics Inc (xx%) and Hisense Co Ltd (xx%).
- M&A Activity: We anticipate an increase in M&A activity, with xx Million deals projected within the forecast period, predominantly driven by smaller players seeking to expand their capabilities and compete with industry leaders.
- Innovation Drivers: Advancements in display panel technology, processing power, and content creation tools.
- Regulatory Frameworks: Stringent energy efficiency standards are driving innovation in power-saving display technologies.
- Product Substitutes: 4K displays remain a primary competitor, necessitating continued technological advancements and a compelling value proposition for 8K.
- End-User Trends: Growing demand for premium displays in commercial and consumer applications.
8K Market Industry Trends & Analysis
The 8K market is experiencing a significant surge in adoption and innovation. This robust growth is propelled by a confluence of factors, including rapid advancements in display panel technology and a consistent decrease in manufacturing costs, making 8K solutions increasingly accessible to a wider audience. Consumer demand for ultra-high resolutions is on an upward trajectory, particularly among discerning high-net-worth individuals and tech-savvy enthusiasts who prioritize unparalleled visual fidelity. The expanding ecosystem of 8K content, fueled by prominent streaming services and sophisticated professional production capabilities, further acts as a catalyst for market expansion. The competitive landscape is highly dynamic, characterized by substantial investments in research and development and aggressive marketing strategies by key industry players vying for market dominance. We project a Compound Annual Growth Rate (CAGR) of [Insert Projected CAGR Here]% from 2025 to 2033, with market penetration expected to reach [Insert Projected Market Penetration Here]% by 2033.
Leading Markets & Segments in 8K Market
The Asia-Pacific region currently dominates the 8K market, driven by strong economic growth and high consumer electronics adoption rates in countries like China, South Korea, and Japan. Within segments, Televisions constitute the largest market share (xx%), followed by Monitors (xx%) and Cameras (xx%).
Key Drivers:
- Asia-Pacific Region: High disposable income, rapidly expanding middle class, and strong government support for technological advancements.
- Television Segment: Increasing demand for premium home entertainment experiences and the expanding availability of 8K content.
Dominance Analysis:
The television segment's dominance stems from its wide adoption in households, driven by consumers seeking enhanced viewing experiences. The increasing affordability of 8K TVs is another key contributor. However, growth in the camera segment is also promising, fueled by the needs of professional filmmakers and photographers for higher resolution imaging.
8K Market Product Developments
Recent product developments in the 8K market are sharply focused on elevating image quality, optimizing power efficiency, and delivering a superior overall user experience. The integration of cutting-edge technologies such as mini-LED backlighting and advanced image processing algorithms is significantly enhancing visual immersion while simultaneously reducing energy consumption. Manufacturers are also proactively incorporating sophisticated features like High Dynamic Range (HDR) and intelligent AI-powered upscaling to ensure that all content is rendered with exceptional clarity and detail on 8K displays, bridging the gap for lower-resolution source material.
Key Drivers of 8K Market Growth
Several factors are driving 8K market growth. Technological advancements in display panel technology are leading to superior image quality and reduced production costs. Economic factors, such as rising disposable incomes in emerging markets, are fueling consumer demand. Favorable regulatory policies promoting technological innovation and energy efficiency also contribute positively. For instance, government subsidies for eco-friendly display technologies in several regions are boosting adoption.
Challenges in the 8K Market Market
High production costs and the limited availability of native 8K content remain major barriers to widespread adoption. Supply chain disruptions, especially regarding critical components, and intense competition among major players also pose challenges. These issues lead to price premiums that constrain market expansion, with estimated lost sales of xx Million annually due to supply chain constraints.
Emerging Opportunities in 8K Market
Emerging opportunities lie in the integration of 8K technology into new applications, such as virtual and augmented reality (VR/AR) and advanced medical imaging. Strategic partnerships between display manufacturers and content providers will play a crucial role in driving market growth. Expanding into new markets, particularly in developing countries, presents significant opportunities for market expansion.
Key Milestones in 8K Market Industry
- January 2023: Hisense unveiled a groundbreaking 8K ultra-short throw projector, significantly enhancing the home cinema experience and broadening the appeal and accessibility of the 8K ecosystem for consumers.
- April 2023: DJI revolutionized professional aerial cinematography with the launch of its Inspire 3 drone, featuring an integrated 8K camera, enabling filmmakers to capture unprecedented detail and clarity from the skies.
Strategic Outlook for 8K Market Market
The future outlook for the 8K market is exceptionally promising, driven by continuous technological innovation, the expanding availability of captivating 8K content, and a notable trend towards increased affordability. Strategic alliances and collaborations between hardware manufacturers, content creators, and technology providers will be paramount in accelerating market adoption and penetration. A dedicated focus on developing energy-efficient and cost-effective 8K solutions will be a critical determinant in unlocking the market's full potential. Furthermore, the exploration and expansion into novel applications beyond traditional consumer electronics, particularly within professional and industrial sectors, presents substantial and exciting growth opportunities for the 8K market.
8K Market Segmentation
-
1. Device
- 1.1. Monitor
- 1.2. Television
- 1.3. Camera
- 1.4. Full Dome
- 1.5. Other Devices
-
2. Application
- 2.1. Healthcare and Medical
- 2.2. Consumer Electronics
- 2.3. Commercial
- 2.4. Other Applications
8K Market Segmentation By Geography
-
1. North America
- 1.1. United States
- 1.2. Canada
- 1.3. Mexico
-
2. Europe
- 2.1. United Kingdom
- 2.2. Germany
- 2.3. France
- 2.4. France
- 2.5. Italy
- 2.6. Spain
- 2.7. Rest of Europe
-
3. Asia
- 3.1. China
- 3.2. Japan
- 3.3. South Korea
- 3.4. Australia and New Zealand
- 3.5. South Korea
- 3.6. Rest of Asia Pacific
-
4. Latin America
- 4.1. Brazil
- 4.2. Argentina
- 4.3. Rest of South America
-
5. Middle East and Africa
- 5.1. UAE
- 5.2. South Africa
- 5.3. Saudi Arabia
- 5.4. Rest Of MEA
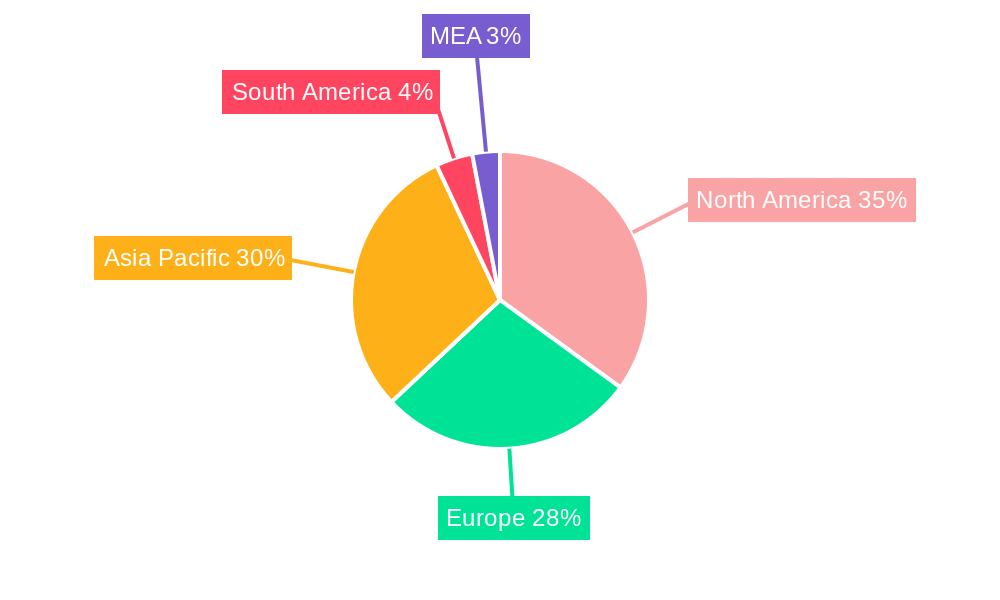
8K Market Regional Market Share
Geographic Coverage of 8K Market
8K Market REPORT HIGHLIGHTS
| Aspects | Details |
|---|---|
| Study Period | 2020-2034 |
| Base Year | 2025 |
| Estimated Year | 2026 |
| Forecast Period | 2026-2034 |
| Historical Period | 2020-2025 |
| Growth Rate | CAGR of 32.93% from 2020-2034 |
| Segmentation |
|
Table of Contents
- 1. Introduction
- 1.1. Research Scope
- 1.2. Market Segmentation
- 1.3. Research Methodology
- 1.4. Definitions and Assumptions
- 2. Executive Summary
- 2.1. Introduction
- 3. Market Dynamics
- 3.1. Introduction
- 3.2. Market Drivers
- 3.2.1. Increasing Demand for High-end Displays in the Consumer Electronics Market; Increasing Technological Advancements in Camera and Data Transfer Technology
- 3.3. Market Restrains
- 3.3.1. Data Security and Privacy
- 3.4. Market Trends
- 3.4.1. Consumer Electronics to Hold Major Market Share
- 4. Market Factor Analysis
- 4.1. Porters Five Forces
- 4.2. Supply/Value Chain
- 4.3. PESTEL analysis
- 4.4. Market Entropy
- 4.5. Patent/Trademark Analysis
- 5. Global 8K Market Analysis, Insights and Forecast, 2020-2032
- 5.1. Market Analysis, Insights and Forecast - by Device
- 5.1.1. Monitor
- 5.1.2. Television
- 5.1.3. Camera
- 5.1.4. Full Dome
- 5.1.5. Other Devices
- 5.2. Market Analysis, Insights and Forecast - by Application
- 5.2.1. Healthcare and Medical
- 5.2.2. Consumer Electronics
- 5.2.3. Commercial
- 5.2.4. Other Applications
- 5.3. Market Analysis, Insights and Forecast - by Region
- 5.3.1. North America
- 5.3.2. Europe
- 5.3.3. Asia
- 5.3.4. Latin America
- 5.3.5. Middle East and Africa
- 5.1. Market Analysis, Insights and Forecast - by Device
- 6. North America 8K Market Analysis, Insights and Forecast, 2020-2032
- 6.1. Market Analysis, Insights and Forecast - by Device
- 6.1.1. Monitor
- 6.1.2. Television
- 6.1.3. Camera
- 6.1.4. Full Dome
- 6.1.5. Other Devices
- 6.2. Market Analysis, Insights and Forecast - by Application
- 6.2.1. Healthcare and Medical
- 6.2.2. Consumer Electronics
- 6.2.3. Commercial
- 6.2.4. Other Applications
- 6.1. Market Analysis, Insights and Forecast - by Device
- 7. Europe 8K Market Analysis, Insights and Forecast, 2020-2032
- 7.1. Market Analysis, Insights and Forecast - by Device
- 7.1.1. Monitor
- 7.1.2. Television
- 7.1.3. Camera
- 7.1.4. Full Dome
- 7.1.5. Other Devices
- 7.2. Market Analysis, Insights and Forecast - by Application
- 7.2.1. Healthcare and Medical
- 7.2.2. Consumer Electronics
- 7.2.3. Commercial
- 7.2.4. Other Applications
- 7.1. Market Analysis, Insights and Forecast - by Device
- 8. Asia 8K Market Analysis, Insights and Forecast, 2020-2032
- 8.1. Market Analysis, Insights and Forecast - by Device
- 8.1.1. Monitor
- 8.1.2. Television
- 8.1.3. Camera
- 8.1.4. Full Dome
- 8.1.5. Other Devices
- 8.2. Market Analysis, Insights and Forecast - by Application
- 8.2.1. Healthcare and Medical
- 8.2.2. Consumer Electronics
- 8.2.3. Commercial
- 8.2.4. Other Applications
- 8.1. Market Analysis, Insights and Forecast - by Device
- 9. Latin America 8K Market Analysis, Insights and Forecast, 2020-2032
- 9.1. Market Analysis, Insights and Forecast - by Device
- 9.1.1. Monitor
- 9.1.2. Television
- 9.1.3. Camera
- 9.1.4. Full Dome
- 9.1.5. Other Devices
- 9.2. Market Analysis, Insights and Forecast - by Application
- 9.2.1. Healthcare and Medical
- 9.2.2. Consumer Electronics
- 9.2.3. Commercial
- 9.2.4. Other Applications
- 9.1. Market Analysis, Insights and Forecast - by Device
- 10. Middle East and Africa 8K Market Analysis, Insights and Forecast, 2020-2032
- 10.1. Market Analysis, Insights and Forecast - by Device
- 10.1.1. Monitor
- 10.1.2. Television
- 10.1.3. Camera
- 10.1.4. Full Dome
- 10.1.5. Other Devices
- 10.2. Market Analysis, Insights and Forecast - by Application
- 10.2.1. Healthcare and Medical
- 10.2.2. Consumer Electronics
- 10.2.3. Commercial
- 10.2.4. Other Applications
- 10.1. Market Analysis, Insights and Forecast - by Device
- 11. Competitive Analysis
- 11.1. Global Market Share Analysis 2025
- 11.2. Company Profiles
- 11.2.1 Canon Inc
- 11.2.1.1. Overview
- 11.2.1.2. Products
- 11.2.1.3. SWOT Analysis
- 11.2.1.4. Recent Developments
- 11.2.1.5. Financials (Based on Availability)
- 11.2.2 LG Electronics Inc
- 11.2.2.1. Overview
- 11.2.2.2. Products
- 11.2.2.3. SWOT Analysis
- 11.2.2.4. Recent Developments
- 11.2.2.5. Financials (Based on Availability)
- 11.2.3 Ikegami Tsushinki Co Ltd
- 11.2.3.1. Overview
- 11.2.3.2. Products
- 11.2.3.3. SWOT Analysis
- 11.2.3.4. Recent Developments
- 11.2.3.5. Financials (Based on Availability)
- 11.2.4 Hisense Co Ltd
- 11.2.4.1. Overview
- 11.2.4.2. Products
- 11.2.4.3. SWOT Analysis
- 11.2.4.4. Recent Developments
- 11.2.4.5. Financials (Based on Availability)
- 11.2.5 Samsung Electronics Co Ltd
- 11.2.5.1. Overview
- 11.2.5.2. Products
- 11.2.5.3. SWOT Analysis
- 11.2.5.4. Recent Developments
- 11.2.5.5. Financials (Based on Availability)
- 11.2.6 BOE Japan Co Ltd
- 11.2.6.1. Overview
- 11.2.6.2. Products
- 11.2.6.3. SWOT Analysis
- 11.2.6.4. Recent Developments
- 11.2.6.5. Financials (Based on Availability)
- 11.2.7 Sharp Corporatio
- 11.2.7.1. Overview
- 11.2.7.2. Products
- 11.2.7.3. SWOT Analysis
- 11.2.7.4. Recent Developments
- 11.2.7.5. Financials (Based on Availability)
- 11.2.8 Red Digital Cinema Camera Company
- 11.2.8.1. Overview
- 11.2.8.2. Products
- 11.2.8.3. SWOT Analysis
- 11.2.8.4. Recent Developments
- 11.2.8.5. Financials (Based on Availability)
- 11.2.9 Dell Technologies Inc
- 11.2.9.1. Overview
- 11.2.9.2. Products
- 11.2.9.3. SWOT Analysis
- 11.2.9.4. Recent Developments
- 11.2.9.5. Financials (Based on Availability)
- 11.2.10 Panasonic Corporation
- 11.2.10.1. Overview
- 11.2.10.2. Products
- 11.2.10.3. SWOT Analysis
- 11.2.10.4. Recent Developments
- 11.2.10.5. Financials (Based on Availability)
- 11.2.1 Canon Inc
List of Figures
- Figure 1: Global 8K Market Revenue Breakdown (Million, %) by Region 2025 & 2033
- Figure 2: Global 8K Market Volume Breakdown (K Unit, %) by Region 2025 & 2033
- Figure 3: North America 8K Market Revenue (Million), by Device 2025 & 2033
- Figure 4: North America 8K Market Volume (K Unit), by Device 2025 & 2033
- Figure 5: North America 8K Market Revenue Share (%), by Device 2025 & 2033
- Figure 6: North America 8K Market Volume Share (%), by Device 2025 & 2033
- Figure 7: North America 8K Market Revenue (Million), by Application 2025 & 2033
- Figure 8: North America 8K Market Volume (K Unit), by Application 2025 & 2033
- Figure 9: North America 8K Market Revenue Share (%), by Application 2025 & 2033
- Figure 10: North America 8K Market Volume Share (%), by Application 2025 & 2033
- Figure 11: North America 8K Market Revenue (Million), by Country 2025 & 2033
- Figure 12: North America 8K Market Volume (K Unit), by Country 2025 & 2033
- Figure 13: North America 8K Market Revenue Share (%), by Country 2025 & 2033
- Figure 14: North America 8K Market Volume Share (%), by Country 2025 & 2033
- Figure 15: Europe 8K Market Revenue (Million), by Device 2025 & 2033
- Figure 16: Europe 8K Market Volume (K Unit), by Device 2025 & 2033
- Figure 17: Europe 8K Market Revenue Share (%), by Device 2025 & 2033
- Figure 18: Europe 8K Market Volume Share (%), by Device 2025 & 2033
- Figure 19: Europe 8K Market Revenue (Million), by Application 2025 & 2033
- Figure 20: Europe 8K Market Volume (K Unit), by Application 2025 & 2033
- Figure 21: Europe 8K Market Revenue Share (%), by Application 2025 & 2033
- Figure 22: Europe 8K Market Volume Share (%), by Application 2025 & 2033
- Figure 23: Europe 8K Market Revenue (Million), by Country 2025 & 2033
- Figure 24: Europe 8K Market Volume (K Unit), by Country 2025 & 2033
- Figure 25: Europe 8K Market Revenue Share (%), by Country 2025 & 2033
- Figure 26: Europe 8K Market Volume Share (%), by Country 2025 & 2033
- Figure 27: Asia 8K Market Revenue (Million), by Device 2025 & 2033
- Figure 28: Asia 8K Market Volume (K Unit), by Device 2025 & 2033
- Figure 29: Asia 8K Market Revenue Share (%), by Device 2025 & 2033
- Figure 30: Asia 8K Market Volume Share (%), by Device 2025 & 2033
- Figure 31: Asia 8K Market Revenue (Million), by Application 2025 & 2033
- Figure 32: Asia 8K Market Volume (K Unit), by Application 2025 & 2033
- Figure 33: Asia 8K Market Revenue Share (%), by Application 2025 & 2033
- Figure 34: Asia 8K Market Volume Share (%), by Application 2025 & 2033
- Figure 35: Asia 8K Market Revenue (Million), by Country 2025 & 2033
- Figure 36: Asia 8K Market Volume (K Unit), by Country 2025 & 2033
- Figure 37: Asia 8K Market Revenue Share (%), by Country 2025 & 2033
- Figure 38: Asia 8K Market Volume Share (%), by Country 2025 & 2033
- Figure 39: Latin America 8K Market Revenue (Million), by Device 2025 & 2033
- Figure 40: Latin America 8K Market Volume (K Unit), by Device 2025 & 2033
- Figure 41: Latin America 8K Market Revenue Share (%), by Device 2025 & 2033
- Figure 42: Latin America 8K Market Volume Share (%), by Device 2025 & 2033
- Figure 43: Latin America 8K Market Revenue (Million), by Application 2025 & 2033
- Figure 44: Latin America 8K Market Volume (K Unit), by Application 2025 & 2033
- Figure 45: Latin America 8K Market Revenue Share (%), by Application 2025 & 2033
- Figure 46: Latin America 8K Market Volume Share (%), by Application 2025 & 2033
- Figure 47: Latin America 8K Market Revenue (Million), by Country 2025 & 2033
- Figure 48: Latin America 8K Market Volume (K Unit), by Country 2025 & 2033
- Figure 49: Latin America 8K Market Revenue Share (%), by Country 2025 & 2033
- Figure 50: Latin America 8K Market Volume Share (%), by Country 2025 & 2033
- Figure 51: Middle East and Africa 8K Market Revenue (Million), by Device 2025 & 2033
- Figure 52: Middle East and Africa 8K Market Volume (K Unit), by Device 2025 & 2033
- Figure 53: Middle East and Africa 8K Market Revenue Share (%), by Device 2025 & 2033
- Figure 54: Middle East and Africa 8K Market Volume Share (%), by Device 2025 & 2033
- Figure 55: Middle East and Africa 8K Market Revenue (Million), by Application 2025 & 2033
- Figure 56: Middle East and Africa 8K Market Volume (K Unit), by Application 2025 & 2033
- Figure 57: Middle East and Africa 8K Market Revenue Share (%), by Application 2025 & 2033
- Figure 58: Middle East and Africa 8K Market Volume Share (%), by Application 2025 & 2033
- Figure 59: Middle East and Africa 8K Market Revenue (Million), by Country 2025 & 2033
- Figure 60: Middle East and Africa 8K Market Volume (K Unit), by Country 2025 & 2033
- Figure 61: Middle East and Africa 8K Market Revenue Share (%), by Country 2025 & 2033
- Figure 62: Middle East and Africa 8K Market Volume Share (%), by Country 2025 & 2033
List of Tables
- Table 1: Global 8K Market Revenue Million Forecast, by Device 2020 & 2033
- Table 2: Global 8K Market Volume K Unit Forecast, by Device 2020 & 2033
- Table 3: Global 8K Market Revenue Million Forecast, by Application 2020 & 2033
- Table 4: Global 8K Market Volume K Unit Forecast, by Application 2020 & 2033
- Table 5: Global 8K Market Revenue Million Forecast, by Region 2020 & 2033
- Table 6: Global 8K Market Volume K Unit Forecast, by Region 2020 & 2033
- Table 7: Global 8K Market Revenue Million Forecast, by Device 2020 & 2033
- Table 8: Global 8K Market Volume K Unit Forecast, by Device 2020 & 2033
- Table 9: Global 8K Market Revenue Million Forecast, by Application 2020 & 2033
- Table 10: Global 8K Market Volume K Unit Forecast, by Application 2020 & 2033
- Table 11: Global 8K Market Revenue Million Forecast, by Country 2020 & 2033
- Table 12: Global 8K Market Volume K Unit Forecast, by Country 2020 & 2033
- Table 13: United States 8K Market Revenue (Million) Forecast, by Application 2020 & 2033
- Table 14: United States 8K Market Volume (K Unit) Forecast, by Application 2020 & 2033
- Table 15: Canada 8K Market Revenue (Million) Forecast, by Application 2020 & 2033
- Table 16: Canada 8K Market Volume (K Unit) Forecast, by Application 2020 & 2033
- Table 17: Mexico 8K Market Revenue (Million) Forecast, by Application 2020 & 2033
- Table 18: Mexico 8K Market Volume (K Unit) Forecast, by Application 2020 & 2033
- Table 19: Global 8K Market Revenue Million Forecast, by Device 2020 & 2033
- Table 20: Global 8K Market Volume K Unit Forecast, by Device 2020 & 2033
- Table 21: Global 8K Market Revenue Million Forecast, by Application 2020 & 2033
- Table 22: Global 8K Market Volume K Unit Forecast, by Application 2020 & 2033
- Table 23: Global 8K Market Revenue Million Forecast, by Country 2020 & 2033
- Table 24: Global 8K Market Volume K Unit Forecast, by Country 2020 & 2033
- Table 25: United Kingdom 8K Market Revenue (Million) Forecast, by Application 2020 & 2033
- Table 26: United Kingdom 8K Market Volume (K Unit) Forecast, by Application 2020 & 2033
- Table 27: Germany 8K Market Revenue (Million) Forecast, by Application 2020 & 2033
- Table 28: Germany 8K Market Volume (K Unit) Forecast, by Application 2020 & 2033
- Table 29: France 8K Market Revenue (Million) Forecast, by Application 2020 & 2033
- Table 30: France 8K Market Volume (K Unit) Forecast, by Application 2020 & 2033
- Table 31: France 8K Market Revenue (Million) Forecast, by Application 2020 & 2033
- Table 32: France 8K Market Volume (K Unit) Forecast, by Application 2020 & 2033
- Table 33: Italy 8K Market Revenue (Million) Forecast, by Application 2020 & 2033
- Table 34: Italy 8K Market Volume (K Unit) Forecast, by Application 2020 & 2033
- Table 35: Spain 8K Market Revenue (Million) Forecast, by Application 2020 & 2033
- Table 36: Spain 8K Market Volume (K Unit) Forecast, by Application 2020 & 2033
- Table 37: Rest of Europe 8K Market Revenue (Million) Forecast, by Application 2020 & 2033
- Table 38: Rest of Europe 8K Market Volume (K Unit) Forecast, by Application 2020 & 2033
- Table 39: Global 8K Market Revenue Million Forecast, by Device 2020 & 2033
- Table 40: Global 8K Market Volume K Unit Forecast, by Device 2020 & 2033
- Table 41: Global 8K Market Revenue Million Forecast, by Application 2020 & 2033
- Table 42: Global 8K Market Volume K Unit Forecast, by Application 2020 & 2033
- Table 43: Global 8K Market Revenue Million Forecast, by Country 2020 & 2033
- Table 44: Global 8K Market Volume K Unit Forecast, by Country 2020 & 2033
- Table 45: China 8K Market Revenue (Million) Forecast, by Application 2020 & 2033
- Table 46: China 8K Market Volume (K Unit) Forecast, by Application 2020 & 2033
- Table 47: Japan 8K Market Revenue (Million) Forecast, by Application 2020 & 2033
- Table 48: Japan 8K Market Volume (K Unit) Forecast, by Application 2020 & 2033
- Table 49: South Korea 8K Market Revenue (Million) Forecast, by Application 2020 & 2033
- Table 50: South Korea 8K Market Volume (K Unit) Forecast, by Application 2020 & 2033
- Table 51: Australia and New Zealand 8K Market Revenue (Million) Forecast, by Application 2020 & 2033
- Table 52: Australia and New Zealand 8K Market Volume (K Unit) Forecast, by Application 2020 & 2033
- Table 53: South Korea 8K Market Revenue (Million) Forecast, by Application 2020 & 2033
- Table 54: South Korea 8K Market Volume (K Unit) Forecast, by Application 2020 & 2033
- Table 55: Rest of Asia Pacific 8K Market Revenue (Million) Forecast, by Application 2020 & 2033
- Table 56: Rest of Asia Pacific 8K Market Volume (K Unit) Forecast, by Application 2020 & 2033
- Table 57: Global 8K Market Revenue Million Forecast, by Device 2020 & 2033
- Table 58: Global 8K Market Volume K Unit Forecast, by Device 2020 & 2033
- Table 59: Global 8K Market Revenue Million Forecast, by Application 2020 & 2033
- Table 60: Global 8K Market Volume K Unit Forecast, by Application 2020 & 2033
- Table 61: Global 8K Market Revenue Million Forecast, by Country 2020 & 2033
- Table 62: Global 8K Market Volume K Unit Forecast, by Country 2020 & 2033
- Table 63: Brazil 8K Market Revenue (Million) Forecast, by Application 2020 & 2033
- Table 64: Brazil 8K Market Volume (K Unit) Forecast, by Application 2020 & 2033
- Table 65: Argentina 8K Market Revenue (Million) Forecast, by Application 2020 & 2033
- Table 66: Argentina 8K Market Volume (K Unit) Forecast, by Application 2020 & 2033
- Table 67: Rest of South America 8K Market Revenue (Million) Forecast, by Application 2020 & 2033
- Table 68: Rest of South America 8K Market Volume (K Unit) Forecast, by Application 2020 & 2033
- Table 69: Global 8K Market Revenue Million Forecast, by Device 2020 & 2033
- Table 70: Global 8K Market Volume K Unit Forecast, by Device 2020 & 2033
- Table 71: Global 8K Market Revenue Million Forecast, by Application 2020 & 2033
- Table 72: Global 8K Market Volume K Unit Forecast, by Application 2020 & 2033
- Table 73: Global 8K Market Revenue Million Forecast, by Country 2020 & 2033
- Table 74: Global 8K Market Volume K Unit Forecast, by Country 2020 & 2033
- Table 75: UAE 8K Market Revenue (Million) Forecast, by Application 2020 & 2033
- Table 76: UAE 8K Market Volume (K Unit) Forecast, by Application 2020 & 2033
- Table 77: South Africa 8K Market Revenue (Million) Forecast, by Application 2020 & 2033
- Table 78: South Africa 8K Market Volume (K Unit) Forecast, by Application 2020 & 2033
- Table 79: Saudi Arabia 8K Market Revenue (Million) Forecast, by Application 2020 & 2033
- Table 80: Saudi Arabia 8K Market Volume (K Unit) Forecast, by Application 2020 & 2033
- Table 81: Rest Of MEA 8K Market Revenue (Million) Forecast, by Application 2020 & 2033
- Table 82: Rest Of MEA 8K Market Volume (K Unit) Forecast, by Application 2020 & 2033
Frequently Asked Questions
1. What is the projected Compound Annual Growth Rate (CAGR) of the 8K Market?
The projected CAGR is approximately 32.93%.
2. Which companies are prominent players in the 8K Market?
Key companies in the market include Canon Inc, LG Electronics Inc, Ikegami Tsushinki Co Ltd, Hisense Co Ltd, Samsung Electronics Co Ltd, BOE Japan Co Ltd, Sharp Corporatio, Red Digital Cinema Camera Company, Dell Technologies Inc, Panasonic Corporation.
3. What are the main segments of the 8K Market?
The market segments include Device, Application.
4. Can you provide details about the market size?
The market size is estimated to be USD 10.46 Million as of 2022.
5. What are some drivers contributing to market growth?
Increasing Demand for High-end Displays in the Consumer Electronics Market; Increasing Technological Advancements in Camera and Data Transfer Technology.
6. What are the notable trends driving market growth?
Consumer Electronics to Hold Major Market Share.
7. Are there any restraints impacting market growth?
Data Security and Privacy.
8. Can you provide examples of recent developments in the market?
April 2023 - DJI has announced its latest professional class Inspire 3 drone for aerial cinematography. Its design, sensor, connectivity, and operation feature numerous advancements over its predecessor. The new Inspire 3 includes a full-frame Zenmuse X9-8K Air Gimbal Camera sensor, which is their most delicate yet, and supports DJI's CineCore 3.0 image processing system. It can internally record up to 8K 25fps in CinemaDNG and 8K 75fps in Apple ProRes RAW. and can also do 4K 120fps ProRes RAW without cropping.
9. What pricing options are available for accessing the report?
Pricing options include single-user, multi-user, and enterprise licenses priced at USD 4750, USD 5250, and USD 8750 respectively.
10. Is the market size provided in terms of value or volume?
The market size is provided in terms of value, measured in Million and volume, measured in K Unit.
11. Are there any specific market keywords associated with the report?
Yes, the market keyword associated with the report is "8K Market," which aids in identifying and referencing the specific market segment covered.
12. How do I determine which pricing option suits my needs best?
The pricing options vary based on user requirements and access needs. Individual users may opt for single-user licenses, while businesses requiring broader access may choose multi-user or enterprise licenses for cost-effective access to the report.
13. Are there any additional resources or data provided in the 8K Market report?
While the report offers comprehensive insights, it's advisable to review the specific contents or supplementary materials provided to ascertain if additional resources or data are available.
14. How can I stay updated on further developments or reports in the 8K Market?
To stay informed about further developments, trends, and reports in the 8K Market, consider subscribing to industry newsletters, following relevant companies and organizations, or regularly checking reputable industry news sources and publications.
Methodology
Step 1 - Identification of Relevant Samples Size from Population Database


Step 2 - Approaches for Defining Global Market Size (Value, Volume* & Price*)

Note*: In applicable scenarios
Step 3 - Data Sources
Primary Research
- Web Analytics
- Survey Reports
- Research Institute
- Latest Research Reports
- Opinion Leaders
Secondary Research
- Annual Reports
- White Paper
- Latest Press Release
- Industry Association
- Paid Database
- Investor Presentations

Step 4 - Data Triangulation
Involves using different sources of information in order to increase the validity of a study
These sources are likely to be stakeholders in a program - participants, other researchers, program staff, other community members, and so on.
Then we put all data in single framework & apply various statistical tools to find out the dynamic on the market.
During the analysis stage, feedback from the stakeholder groups would be compared to determine areas of agreement as well as areas of divergence