

Key Insights
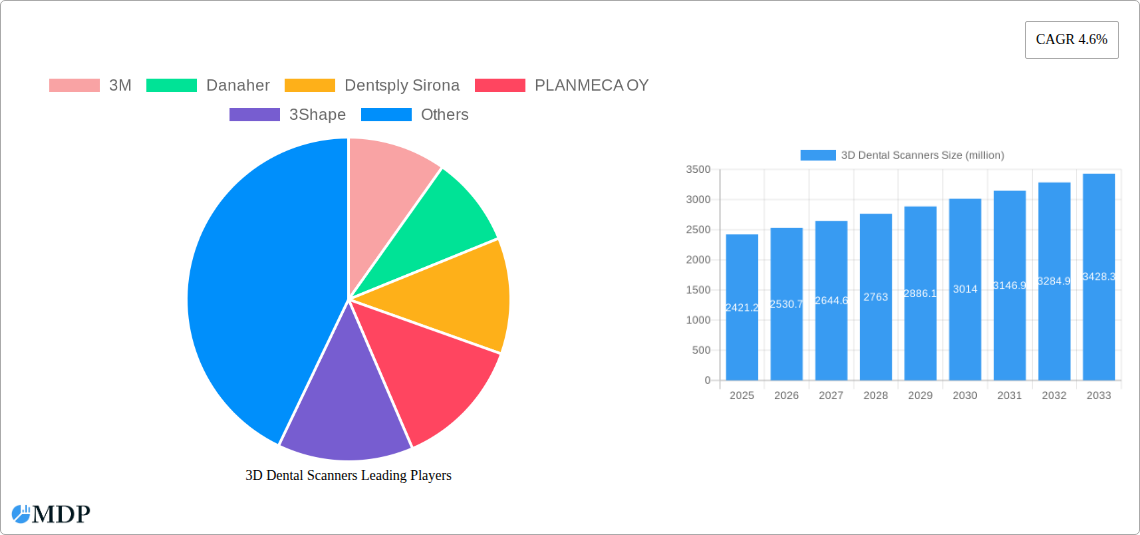
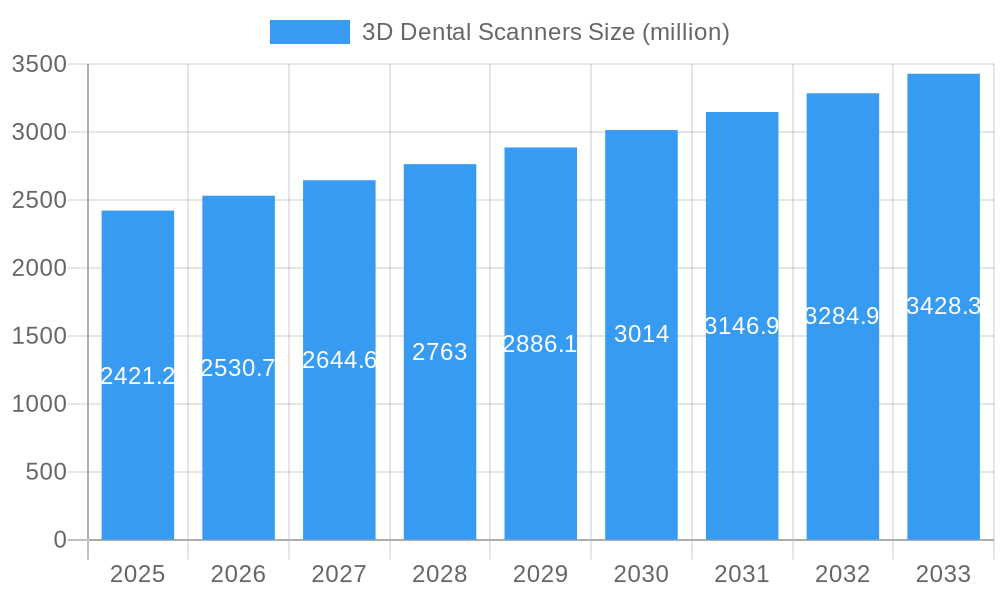
The global 3D dental scanner market, valued at $2421.2 million in 2025, is projected to experience robust growth, driven by several key factors. The increasing adoption of digital dentistry workflows, offering enhanced precision, efficiency, and patient comfort, is a primary catalyst. Minimally invasive procedures, facilitated by precise 3D scans, are gaining popularity, further fueling market expansion. Technological advancements, including the development of faster, more accurate scanners with improved image quality and user-friendly software, are also contributing to market growth. Furthermore, the rising prevalence of dental diseases and the growing geriatric population, requiring more complex restorative and implant procedures, are significant demand drivers. The market is segmented by scanner type (intraoral, extraoral), application (implants, orthodontics, restorative dentistry), and technology (optical, cone-beam computed tomography [CBCT]). Competition is intense, with established players like 3M, Danaher, and Dentsply Sirona alongside innovative companies like 3Shape and Planmeca vying for market share. The market's geographic distribution is expected to show strong growth in developing economies as dental infrastructure improves and awareness of digital dentistry technologies increases.
3D Dental Scanners Market Size (In Billion)
A compound annual growth rate (CAGR) of 4.6% from 2025 to 2033 suggests a steady, sustainable expansion. However, certain challenges exist, including the relatively high initial investment cost for 3D scanners, which can limit adoption in smaller clinics or practices with limited budgets. The need for specialized training and expertise to operate and interpret the scans also presents a barrier to entry. Nonetheless, the long-term prospects for the 3D dental scanner market remain positive, driven by continuous technological innovation, increasing demand for advanced dental treatments, and favorable regulatory environments in many regions. This will likely lead to further market consolidation and an emphasis on integrating 3D scanning with other digital dentistry technologies to offer comprehensive, streamlined solutions for dental professionals.
3D Dental Scanners Company Market Share
This in-depth report provides a comprehensive analysis of the global 3D dental scanners market, projecting a market value exceeding $XX million by 2033. The report covers market dynamics, industry trends, leading players, and future growth opportunities, offering invaluable insights for stakeholders across the dental industry. With a detailed analysis spanning the historical period (2019-2024), base year (2025), and forecast period (2025-2033), this report is an essential resource for strategic decision-making.
3D Dental Scanners Market Dynamics & Concentration
The global 3D dental scanners market exhibits a moderately consolidated structure, with key players like 3M, Danaher, Dentsply Sirona, and Planmeca OY holding significant market share. The market is driven by technological advancements, increasing adoption of CAD/CAM technology in dental practices, and rising demand for minimally invasive procedures. Stringent regulatory frameworks ensure product safety and efficacy, influencing market growth. Substitutes like traditional impression methods still exist but are gradually losing ground to the superior accuracy and efficiency of 3D scanners. The market witnesses consistent M&A activity, with approximately XX deals recorded between 2019 and 2024, further shaping the competitive landscape.
- Market Share (Estimated 2025): 3M (XX%), Danaher (XX%), Dentsply Sirona (XX%), Planmeca OY (XX%), Others (XX%)
- M&A Activity (2019-2024): XX deals, predominantly driven by strategic expansion and technological integration.
- Innovation Drivers: Artificial intelligence (AI) integration, improved image processing, intraoral scanner miniaturization.
- Regulatory Frameworks: Vary across regions, impacting product approvals and market entry strategies.
3D Dental Scanners Industry Trends & Analysis
The 3D dental scanners market is experiencing robust growth, with a projected CAGR of XX% during the forecast period (2025-2033). This growth is fueled by several key factors: the rising prevalence of dental diseases globally, increasing disposable incomes in emerging economies, a shift toward digital dentistry, and the growing preference for aesthetically pleasing and precise dental restorations. Technological advancements, such as the integration of AI and improved scanner accuracy, are further driving market penetration. The competitive landscape is dynamic, with existing players focusing on innovation and expansion, while new entrants strive to establish a foothold. Market penetration in developed regions is high, while emerging markets present substantial untapped potential for growth.
Leading Markets & Segments in 3D Dental Scanners
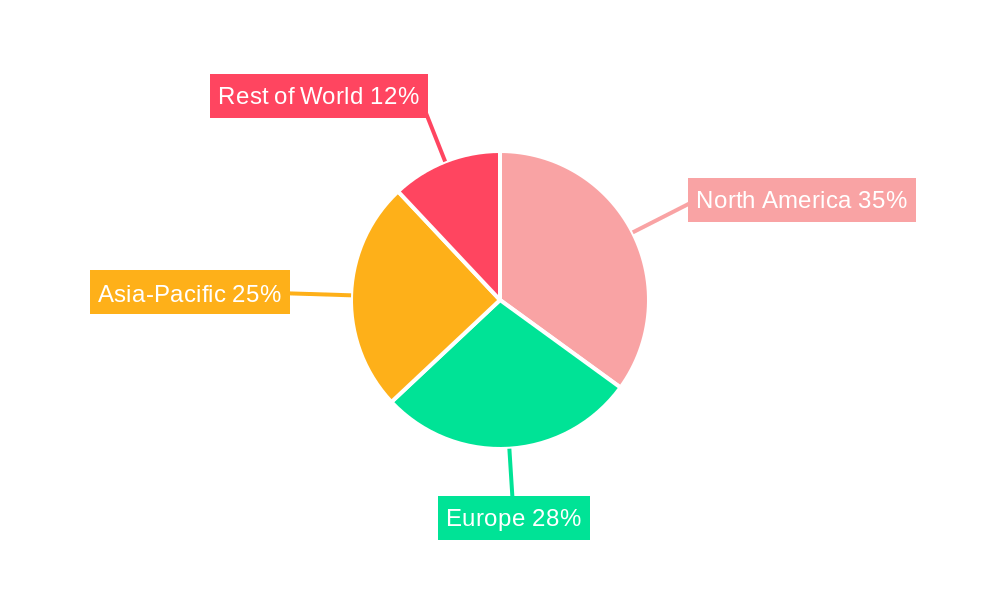
The North American region currently dominates the 3D dental scanners market, driven by high adoption rates in developed economies, strong regulatory support, and a well-established dental infrastructure. However, the Asia-Pacific region is anticipated to witness the fastest growth during the forecast period, propelled by increasing healthcare expenditure, expanding dental tourism, and rising awareness of advanced dental technologies.
North America:
- High disposable income and technological adoption.
- Established dental infrastructure and strong regulatory support.
- Presence of major market players.
Asia-Pacific:
- Rapidly growing healthcare sector and rising dental tourism.
- Increasing awareness of advanced dental technologies.
- High potential for market expansion.
3D Dental Scanners Product Developments
Recent product innovations include smaller, more portable intraoral scanners with enhanced image processing capabilities and AI-powered features for automated data analysis and improved workflow efficiency. These advancements reduce scanning time, improve accuracy, and offer seamless integration with CAD/CAM software. This allows for quicker and more efficient production of dental restorations. The market is witnessing a shift towards multi-functional scanners offering expanded applications beyond crowns and bridges, catering to a wider range of dental procedures.
Key Drivers of 3D Dental Scanners Growth
Several factors contribute to the market’s growth. Technological advancements continuously improve scanner accuracy and efficiency, while reduced costs make the technology more accessible to a wider range of dental practices. Favorable regulatory environments and increasing government initiatives promoting digital healthcare infrastructure also stimulate adoption. Moreover, the rising prevalence of dental diseases and the increasing demand for aesthetically pleasing restorations further fuel market expansion.
Challenges in the 3D Dental Scanners Market
Despite its potential, the market faces challenges, including the high initial investment cost for dental practices, the need for specialized training to operate the scanners effectively, and the potential for data security concerns related to patient information. Supply chain disruptions can impact the availability and pricing of scanners. Finally, intense competition among established players and emerging companies influences pricing and market share. The impact of these challenges is estimated to reduce market growth by approximately XX% over the forecast period.
Emerging Opportunities in 3D Dental Scanners
The integration of AI and machine learning in 3D dental scanners is a significant opportunity, offering automated data analysis, improved diagnostic capabilities, and personalized treatment plans. Strategic partnerships between scanner manufacturers and dental laboratories enhance workflow efficiency. Expanding into emerging markets, particularly in Asia-Pacific and Latin America, presents considerable growth potential.
Leading Players in the 3D Dental Scanners Sector
- 3M
- Danaher
- Dentsply Sirona
- PLANMECA OY
- 3Shape
- AICON 3D Systems
- AGE Solutions
- ALIGN TECHNOLOGY
- Amann Girrbach
- ASAHIROENTGEN
- Carestream Health
- Carl Zeiss Optotechnik
- Condor
- Densy3D
- Dental Wings
- GT Medical
- J. Morita
- Kulzer
- Straumann
- Zimmer Biomet
- ZIRKONZAHN
Key Milestones in 3D Dental Scanners Industry
- 2020: Introduction of AI-powered intraoral scanners by multiple manufacturers.
- 2021: Significant increase in the adoption of cloud-based dental software, improving data sharing and collaboration.
- 2022: Launch of several compact and portable 3D scanners.
- 2023: Several mergers and acquisitions further consolidated the market.
- 2024: Increased focus on integration with other digital dentistry technologies.
Strategic Outlook for 3D Dental Scanners Market
The 3D dental scanners market holds significant long-term growth potential, driven by technological innovation, expansion into emerging markets, and increasing adoption of digital workflows in dentistry. Strategic partnerships and collaborations will be crucial for success, as will investments in research and development to enhance scanner capabilities and expand their applications. Companies focusing on user-friendly interfaces and streamlined integration with existing dental systems will gain a competitive advantage.
3D Dental Scanners Segmentation
-
1. Application
- 1.1. Hospitals
- 1.2. Clinics
- 1.3. Others
-
2. Types
- 2.1. Desktop
- 2.2. Portable
3D Dental Scanners Segmentation By Geography
-
1. North America
- 1.1. United States
- 1.2. Canada
- 1.3. Mexico
-
2. South America
- 2.1. Brazil
- 2.2. Argentina
- 2.3. Rest of South America
-
3. Europe
- 3.1. United Kingdom
- 3.2. Germany
- 3.3. France
- 3.4. Italy
- 3.5. Spain
- 3.6. Russia
- 3.7. Benelux
- 3.8. Nordics
- 3.9. Rest of Europe
-
4. Middle East & Africa
- 4.1. Turkey
- 4.2. Israel
- 4.3. GCC
- 4.4. North Africa
- 4.5. South Africa
- 4.6. Rest of Middle East & Africa
-
5. Asia Pacific
- 5.1. China
- 5.2. India
- 5.3. Japan
- 5.4. South Korea
- 5.5. ASEAN
- 5.6. Oceania
- 5.7. Rest of Asia Pacific
3D Dental Scanners Regional Market Share
Geographic Coverage of 3D Dental Scanners
3D Dental Scanners REPORT HIGHLIGHTS
| Aspects | Details |
|---|---|
| Study Period | 2020-2034 |
| Base Year | 2025 |
| Estimated Year | 2026 |
| Forecast Period | 2026-2034 |
| Historical Period | 2020-2025 |
| Growth Rate | CAGR of 4.6% from 2020-2034 |
| Segmentation |
|
Table of Contents
- 1. Introduction
- 1.1. Research Scope
- 1.2. Market Segmentation
- 1.3. Research Objective
- 1.4. Definitions and Assumptions
- 2. Executive Summary
- 2.1. Market Snapshot
- 3. Market Dynamics
- 3.1. Market Drivers
- 3.2. Market Restrains
- 3.3. Market Trends
- 3.4. Market Opportunities
- 4. Market Factor Analysis
- 4.1. Porters Five Forces
- 4.1.1. Bargaining Power of Suppliers
- 4.1.2. Bargaining Power of Buyers
- 4.1.3. Threat of New Entrants
- 4.1.4. Threat of Substitutes
- 4.1.5. Competitive Rivalry
- 4.2. PESTEL analysis
- 4.3. BCG Analysis
- 4.3.1. Stars (High Growth, High Market Share)
- 4.3.2. Cash Cows (Low Growth, High Market Share)
- 4.3.3. Question Mark (High Growth, Low Market Share)
- 4.3.4. Dogs (Low Growth, Low Market Share)
- 4.4. Ansoff Matrix Analysis
- 4.5. Supply Chain Analysis
- 4.6. Regulatory Landscape
- 4.7. Current Market Potential and Opportunity Assessment (TAM–SAM–SOM Framework)
- 4.8. MDP Analyst Note
- 4.1. Porters Five Forces
- 5. Market Analysis, Insights and Forecast 2021-2033
- 5.1. Market Analysis, Insights and Forecast - by Application
- 5.1.1. Hospitals
- 5.1.2. Clinics
- 5.1.3. Others
- 5.2. Market Analysis, Insights and Forecast - by Types
- 5.2.1. Desktop
- 5.2.2. Portable
- 5.3. Market Analysis, Insights and Forecast - by Region
- 5.3.1. North America
- 5.3.2. South America
- 5.3.3. Europe
- 5.3.4. Middle East & Africa
- 5.3.5. Asia Pacific
- 5.1. Market Analysis, Insights and Forecast - by Application
- 6. Global 3D Dental Scanners Analysis, Insights and Forecast, 2021-2033
- 6.1. Market Analysis, Insights and Forecast - by Application
- 6.1.1. Hospitals
- 6.1.2. Clinics
- 6.1.3. Others
- 6.2. Market Analysis, Insights and Forecast - by Types
- 6.2.1. Desktop
- 6.2.2. Portable
- 6.1. Market Analysis, Insights and Forecast - by Application
- 7. North America 3D Dental Scanners Analysis, Insights and Forecast, 2020-2032
- 7.1. Market Analysis, Insights and Forecast - by Application
- 7.1.1. Hospitals
- 7.1.2. Clinics
- 7.1.3. Others
- 7.2. Market Analysis, Insights and Forecast - by Types
- 7.2.1. Desktop
- 7.2.2. Portable
- 7.1. Market Analysis, Insights and Forecast - by Application
- 8. South America 3D Dental Scanners Analysis, Insights and Forecast, 2020-2032
- 8.1. Market Analysis, Insights and Forecast - by Application
- 8.1.1. Hospitals
- 8.1.2. Clinics
- 8.1.3. Others
- 8.2. Market Analysis, Insights and Forecast - by Types
- 8.2.1. Desktop
- 8.2.2. Portable
- 8.1. Market Analysis, Insights and Forecast - by Application
- 9. Europe 3D Dental Scanners Analysis, Insights and Forecast, 2020-2032
- 9.1. Market Analysis, Insights and Forecast - by Application
- 9.1.1. Hospitals
- 9.1.2. Clinics
- 9.1.3. Others
- 9.2. Market Analysis, Insights and Forecast - by Types
- 9.2.1. Desktop
- 9.2.2. Portable
- 9.1. Market Analysis, Insights and Forecast - by Application
- 10. Middle East & Africa 3D Dental Scanners Analysis, Insights and Forecast, 2020-2032
- 10.1. Market Analysis, Insights and Forecast - by Application
- 10.1.1. Hospitals
- 10.1.2. Clinics
- 10.1.3. Others
- 10.2. Market Analysis, Insights and Forecast - by Types
- 10.2.1. Desktop
- 10.2.2. Portable
- 10.1. Market Analysis, Insights and Forecast - by Application
- 11. Asia Pacific 3D Dental Scanners Analysis, Insights and Forecast, 2020-2032
- 11.1. Market Analysis, Insights and Forecast - by Application
- 11.1.1. Hospitals
- 11.1.2. Clinics
- 11.1.3. Others
- 11.2. Market Analysis, Insights and Forecast - by Types
- 11.2.1. Desktop
- 11.2.2. Portable
- 11.1. Market Analysis, Insights and Forecast - by Application
- 12. Competitive Analysis
- 12.1. Company Profiles
- 12.1.1 3M
- 12.1.1.1. Company Overview
- 12.1.1.2. Products
- 12.1.1.3. Company Financials
- 12.1.1.4. SWOT Analysis
- 12.1.2 Danaher
- 12.1.2.1. Company Overview
- 12.1.2.2. Products
- 12.1.2.3. Company Financials
- 12.1.2.4. SWOT Analysis
- 12.1.3 Dentsply Sirona
- 12.1.3.1. Company Overview
- 12.1.3.2. Products
- 12.1.3.3. Company Financials
- 12.1.3.4. SWOT Analysis
- 12.1.4 PLANMECA OY
- 12.1.4.1. Company Overview
- 12.1.4.2. Products
- 12.1.4.3. Company Financials
- 12.1.4.4. SWOT Analysis
- 12.1.5 3Shape
- 12.1.5.1. Company Overview
- 12.1.5.2. Products
- 12.1.5.3. Company Financials
- 12.1.5.4. SWOT Analysis
- 12.1.6 AICON 3D Systems
- 12.1.6.1. Company Overview
- 12.1.6.2. Products
- 12.1.6.3. Company Financials
- 12.1.6.4. SWOT Analysis
- 12.1.7 AGE Solutions
- 12.1.7.1. Company Overview
- 12.1.7.2. Products
- 12.1.7.3. Company Financials
- 12.1.7.4. SWOT Analysis
- 12.1.8 ALIGN TECHNOLOGY
- 12.1.8.1. Company Overview
- 12.1.8.2. Products
- 12.1.8.3. Company Financials
- 12.1.8.4. SWOT Analysis
- 12.1.9 Amann Girrbach
- 12.1.9.1. Company Overview
- 12.1.9.2. Products
- 12.1.9.3. Company Financials
- 12.1.9.4. SWOT Analysis
- 12.1.10 ASAHIROENTGEN
- 12.1.10.1. Company Overview
- 12.1.10.2. Products
- 12.1.10.3. Company Financials
- 12.1.10.4. SWOT Analysis
- 12.1.11 Carestream Health
- 12.1.11.1. Company Overview
- 12.1.11.2. Products
- 12.1.11.3. Company Financials
- 12.1.11.4. SWOT Analysis
- 12.1.12 Carl Zeiss Optotechnik
- 12.1.12.1. Company Overview
- 12.1.12.2. Products
- 12.1.12.3. Company Financials
- 12.1.12.4. SWOT Analysis
- 12.1.13 Condor
- 12.1.13.1. Company Overview
- 12.1.13.2. Products
- 12.1.13.3. Company Financials
- 12.1.13.4. SWOT Analysis
- 12.1.14 Densy3D
- 12.1.14.1. Company Overview
- 12.1.14.2. Products
- 12.1.14.3. Company Financials
- 12.1.14.4. SWOT Analysis
- 12.1.15 Dental Wings
- 12.1.15.1. Company Overview
- 12.1.15.2. Products
- 12.1.15.3. Company Financials
- 12.1.15.4. SWOT Analysis
- 12.1.16 GT Medical
- 12.1.16.1. Company Overview
- 12.1.16.2. Products
- 12.1.16.3. Company Financials
- 12.1.16.4. SWOT Analysis
- 12.1.17 J. Morita
- 12.1.17.1. Company Overview
- 12.1.17.2. Products
- 12.1.17.3. Company Financials
- 12.1.17.4. SWOT Analysis
- 12.1.18 Kulzer
- 12.1.18.1. Company Overview
- 12.1.18.2. Products
- 12.1.18.3. Company Financials
- 12.1.18.4. SWOT Analysis
- 12.1.19 Straumann
- 12.1.19.1. Company Overview
- 12.1.19.2. Products
- 12.1.19.3. Company Financials
- 12.1.19.4. SWOT Analysis
- 12.1.20 Zimmer Biomet
- 12.1.20.1. Company Overview
- 12.1.20.2. Products
- 12.1.20.3. Company Financials
- 12.1.20.4. SWOT Analysis
- 12.1.21 ZIRKONZAHN
- 12.1.21.1. Company Overview
- 12.1.21.2. Products
- 12.1.21.3. Company Financials
- 12.1.21.4. SWOT Analysis
- 12.1.1 3M
- 12.2. Market Entropy
- 12.2.1 Company's Key Areas Served
- 12.2.2 Recent Developments
- 12.3. Company Market Share Analysis 2025
- 12.3.1 Top 5 Companies Market Share Analysis
- 12.3.2 Top 3 Companies Market Share Analysis
- 12.4. List of Potential Customers
- 13. Research Methodology
List of Figures
- Figure 1: Global 3D Dental Scanners Revenue Breakdown (million, %) by Region 2025 & 2033
- Figure 2: North America 3D Dental Scanners Revenue (million), by Application 2025 & 2033
- Figure 3: North America 3D Dental Scanners Revenue Share (%), by Application 2025 & 2033
- Figure 4: North America 3D Dental Scanners Revenue (million), by Types 2025 & 2033
- Figure 5: North America 3D Dental Scanners Revenue Share (%), by Types 2025 & 2033
- Figure 6: North America 3D Dental Scanners Revenue (million), by Country 2025 & 2033
- Figure 7: North America 3D Dental Scanners Revenue Share (%), by Country 2025 & 2033
- Figure 8: South America 3D Dental Scanners Revenue (million), by Application 2025 & 2033
- Figure 9: South America 3D Dental Scanners Revenue Share (%), by Application 2025 & 2033
- Figure 10: South America 3D Dental Scanners Revenue (million), by Types 2025 & 2033
- Figure 11: South America 3D Dental Scanners Revenue Share (%), by Types 2025 & 2033
- Figure 12: South America 3D Dental Scanners Revenue (million), by Country 2025 & 2033
- Figure 13: South America 3D Dental Scanners Revenue Share (%), by Country 2025 & 2033
- Figure 14: Europe 3D Dental Scanners Revenue (million), by Application 2025 & 2033
- Figure 15: Europe 3D Dental Scanners Revenue Share (%), by Application 2025 & 2033
- Figure 16: Europe 3D Dental Scanners Revenue (million), by Types 2025 & 2033
- Figure 17: Europe 3D Dental Scanners Revenue Share (%), by Types 2025 & 2033
- Figure 18: Europe 3D Dental Scanners Revenue (million), by Country 2025 & 2033
- Figure 19: Europe 3D Dental Scanners Revenue Share (%), by Country 2025 & 2033
- Figure 20: Middle East & Africa 3D Dental Scanners Revenue (million), by Application 2025 & 2033
- Figure 21: Middle East & Africa 3D Dental Scanners Revenue Share (%), by Application 2025 & 2033
- Figure 22: Middle East & Africa 3D Dental Scanners Revenue (million), by Types 2025 & 2033
- Figure 23: Middle East & Africa 3D Dental Scanners Revenue Share (%), by Types 2025 & 2033
- Figure 24: Middle East & Africa 3D Dental Scanners Revenue (million), by Country 2025 & 2033
- Figure 25: Middle East & Africa 3D Dental Scanners Revenue Share (%), by Country 2025 & 2033
- Figure 26: Asia Pacific 3D Dental Scanners Revenue (million), by Application 2025 & 2033
- Figure 27: Asia Pacific 3D Dental Scanners Revenue Share (%), by Application 2025 & 2033
- Figure 28: Asia Pacific 3D Dental Scanners Revenue (million), by Types 2025 & 2033
- Figure 29: Asia Pacific 3D Dental Scanners Revenue Share (%), by Types 2025 & 2033
- Figure 30: Asia Pacific 3D Dental Scanners Revenue (million), by Country 2025 & 2033
- Figure 31: Asia Pacific 3D Dental Scanners Revenue Share (%), by Country 2025 & 2033
List of Tables
- Table 1: Global 3D Dental Scanners Revenue million Forecast, by Application 2020 & 2033
- Table 2: Global 3D Dental Scanners Revenue million Forecast, by Types 2020 & 2033
- Table 3: Global 3D Dental Scanners Revenue million Forecast, by Region 2020 & 2033
- Table 4: Global 3D Dental Scanners Revenue million Forecast, by Application 2020 & 2033
- Table 5: Global 3D Dental Scanners Revenue million Forecast, by Types 2020 & 2033
- Table 6: Global 3D Dental Scanners Revenue million Forecast, by Country 2020 & 2033
- Table 7: United States 3D Dental Scanners Revenue (million) Forecast, by Application 2020 & 2033
- Table 8: Canada 3D Dental Scanners Revenue (million) Forecast, by Application 2020 & 2033
- Table 9: Mexico 3D Dental Scanners Revenue (million) Forecast, by Application 2020 & 2033
- Table 10: Global 3D Dental Scanners Revenue million Forecast, by Application 2020 & 2033
- Table 11: Global 3D Dental Scanners Revenue million Forecast, by Types 2020 & 2033
- Table 12: Global 3D Dental Scanners Revenue million Forecast, by Country 2020 & 2033
- Table 13: Brazil 3D Dental Scanners Revenue (million) Forecast, by Application 2020 & 2033
- Table 14: Argentina 3D Dental Scanners Revenue (million) Forecast, by Application 2020 & 2033
- Table 15: Rest of South America 3D Dental Scanners Revenue (million) Forecast, by Application 2020 & 2033
- Table 16: Global 3D Dental Scanners Revenue million Forecast, by Application 2020 & 2033
- Table 17: Global 3D Dental Scanners Revenue million Forecast, by Types 2020 & 2033
- Table 18: Global 3D Dental Scanners Revenue million Forecast, by Country 2020 & 2033
- Table 19: United Kingdom 3D Dental Scanners Revenue (million) Forecast, by Application 2020 & 2033
- Table 20: Germany 3D Dental Scanners Revenue (million) Forecast, by Application 2020 & 2033
- Table 21: France 3D Dental Scanners Revenue (million) Forecast, by Application 2020 & 2033
- Table 22: Italy 3D Dental Scanners Revenue (million) Forecast, by Application 2020 & 2033
- Table 23: Spain 3D Dental Scanners Revenue (million) Forecast, by Application 2020 & 2033
- Table 24: Russia 3D Dental Scanners Revenue (million) Forecast, by Application 2020 & 2033
- Table 25: Benelux 3D Dental Scanners Revenue (million) Forecast, by Application 2020 & 2033
- Table 26: Nordics 3D Dental Scanners Revenue (million) Forecast, by Application 2020 & 2033
- Table 27: Rest of Europe 3D Dental Scanners Revenue (million) Forecast, by Application 2020 & 2033
- Table 28: Global 3D Dental Scanners Revenue million Forecast, by Application 2020 & 2033
- Table 29: Global 3D Dental Scanners Revenue million Forecast, by Types 2020 & 2033
- Table 30: Global 3D Dental Scanners Revenue million Forecast, by Country 2020 & 2033
- Table 31: Turkey 3D Dental Scanners Revenue (million) Forecast, by Application 2020 & 2033
- Table 32: Israel 3D Dental Scanners Revenue (million) Forecast, by Application 2020 & 2033
- Table 33: GCC 3D Dental Scanners Revenue (million) Forecast, by Application 2020 & 2033
- Table 34: North Africa 3D Dental Scanners Revenue (million) Forecast, by Application 2020 & 2033
- Table 35: South Africa 3D Dental Scanners Revenue (million) Forecast, by Application 2020 & 2033
- Table 36: Rest of Middle East & Africa 3D Dental Scanners Revenue (million) Forecast, by Application 2020 & 2033
- Table 37: Global 3D Dental Scanners Revenue million Forecast, by Application 2020 & 2033
- Table 38: Global 3D Dental Scanners Revenue million Forecast, by Types 2020 & 2033
- Table 39: Global 3D Dental Scanners Revenue million Forecast, by Country 2020 & 2033
- Table 40: China 3D Dental Scanners Revenue (million) Forecast, by Application 2020 & 2033
- Table 41: India 3D Dental Scanners Revenue (million) Forecast, by Application 2020 & 2033
- Table 42: Japan 3D Dental Scanners Revenue (million) Forecast, by Application 2020 & 2033
- Table 43: South Korea 3D Dental Scanners Revenue (million) Forecast, by Application 2020 & 2033
- Table 44: ASEAN 3D Dental Scanners Revenue (million) Forecast, by Application 2020 & 2033
- Table 45: Oceania 3D Dental Scanners Revenue (million) Forecast, by Application 2020 & 2033
- Table 46: Rest of Asia Pacific 3D Dental Scanners Revenue (million) Forecast, by Application 2020 & 2033
Frequently Asked Questions
1. What is the projected Compound Annual Growth Rate (CAGR) of the 3D Dental Scanners?
The projected CAGR is approximately 4.6%.
2. Which companies are prominent players in the 3D Dental Scanners?
Key companies in the market include 3M, Danaher, Dentsply Sirona, PLANMECA OY, 3Shape, AICON 3D Systems, AGE Solutions, ALIGN TECHNOLOGY, Amann Girrbach, ASAHIROENTGEN, Carestream Health, Carl Zeiss Optotechnik, Condor, Densy3D, Dental Wings, GT Medical, J. Morita, Kulzer, Straumann, Zimmer Biomet, ZIRKONZAHN.
3. What are the main segments of the 3D Dental Scanners?
The market segments include Application, Types.
4. Can you provide details about the market size?
The market size is estimated to be USD 2421.2 million as of 2022.
5. What are some drivers contributing to market growth?
N/A
6. What are the notable trends driving market growth?
N/A
7. Are there any restraints impacting market growth?
N/A
8. Can you provide examples of recent developments in the market?
N/A
9. What pricing options are available for accessing the report?
Pricing options include single-user, multi-user, and enterprise licenses priced at USD 2900.00, USD 4350.00, and USD 5800.00 respectively.
10. Is the market size provided in terms of value or volume?
The market size is provided in terms of value, measured in million.
11. Are there any specific market keywords associated with the report?
Yes, the market keyword associated with the report is "3D Dental Scanners," which aids in identifying and referencing the specific market segment covered.
12. How do I determine which pricing option suits my needs best?
The pricing options vary based on user requirements and access needs. Individual users may opt for single-user licenses, while businesses requiring broader access may choose multi-user or enterprise licenses for cost-effective access to the report.
13. Are there any additional resources or data provided in the 3D Dental Scanners report?
While the report offers comprehensive insights, it's advisable to review the specific contents or supplementary materials provided to ascertain if additional resources or data are available.
14. How can I stay updated on further developments or reports in the 3D Dental Scanners?
To stay informed about further developments, trends, and reports in the 3D Dental Scanners, consider subscribing to industry newsletters, following relevant companies and organizations, or regularly checking reputable industry news sources and publications.
Methodology
Step 1 - Identification of Relevant Samples Size from Population Database


Step 2 - Approaches for Defining Global Market Size (Value, Volume* & Price*)

Note*: In applicable scenarios
Step 3 - Data Sources
Primary Research
- Web Analytics
- Survey Reports
- Research Institute
- Latest Research Reports
- Opinion Leaders
Secondary Research
- Annual Reports
- White Paper
- Latest Press Release
- Industry Association
- Paid Database
- Investor Presentations

Step 4 - Data Triangulation
Involves using different sources of information in order to increase the validity of a study
These sources are likely to be stakeholders in a program - participants, other researchers, program staff, other community members, and so on.
Then we put all data in single framework & apply various statistical tools to find out the dynamic on the market.
During the analysis stage, feedback from the stakeholder groups would be compared to determine areas of agreement as well as areas of divergence