

Key Insights
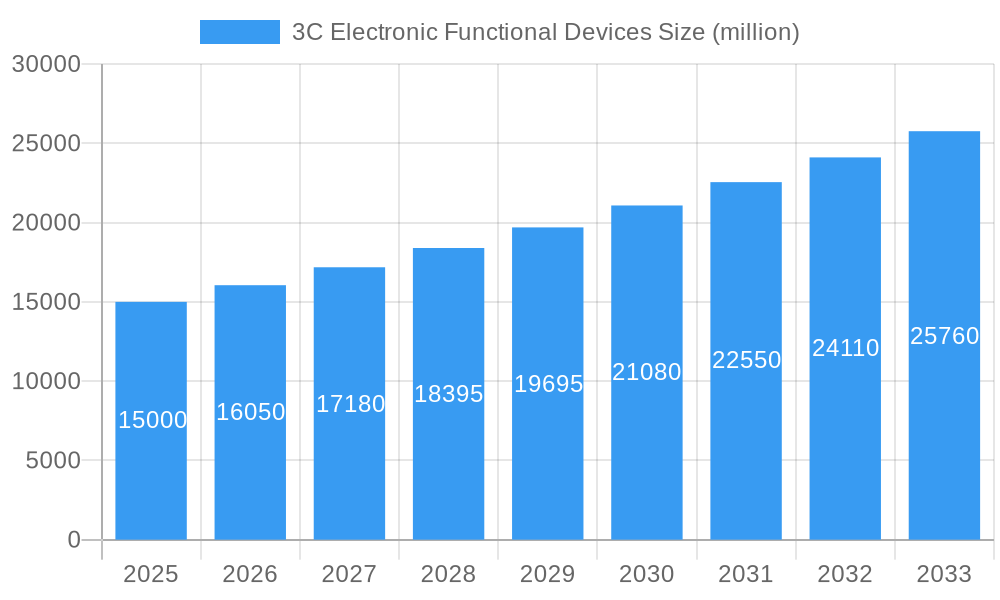
The global 3C (Computer, Communication, Consumer Electronic) electronic functional devices market is poised for significant expansion, driven by escalating demand for compact, high-performance electronics. The market, valued at $15.38 billion in the base year 2025, is projected to grow at a compound annual growth rate (CAGR) of 7.23% from 2025 to 2033, reaching an estimated value of approximately $26.7 billion by 2033. This robust growth is underpinned by key trends including the widespread adoption of smartphones, wearables, and smart devices; advancements in miniaturization technologies enabling enhanced functionality in smaller form factors; and the increasing integration of advanced materials such as flexible circuits and high-density batteries.
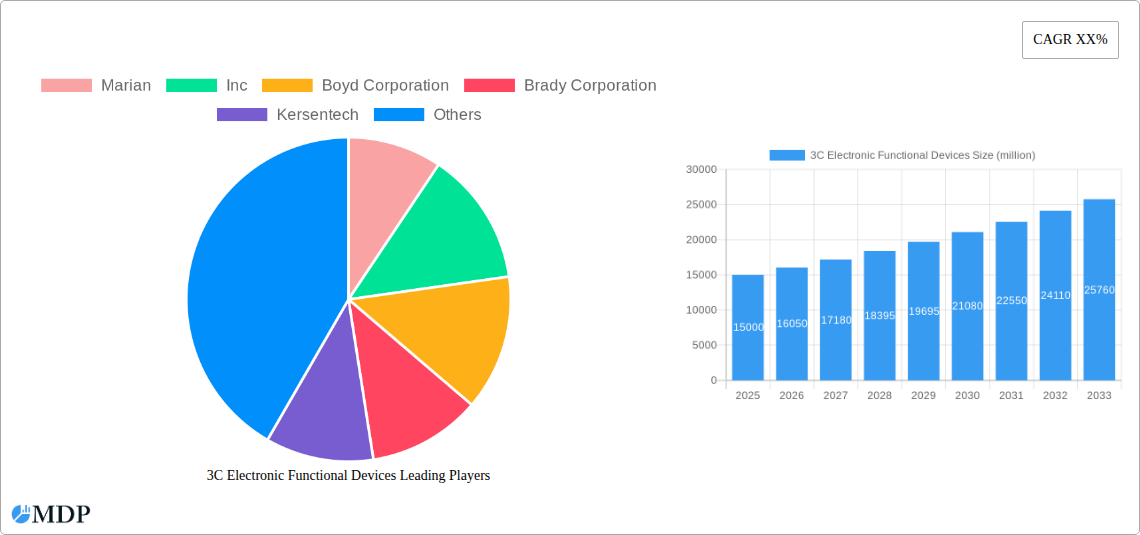
3C Electronic Functional Devices Market Size (In Billion)
Within the market segments, Battery Functional Devices currently dominate due to their essential role in portable electronics. Concurrently, Optical Functional Devices are exhibiting the fastest growth trajectory, propelled by the expanding applications in augmented reality (AR) and virtual reality (VR) technologies. Geographically, the Asia Pacific region, particularly China and India, is expected to lead growth owing to substantial manufacturing capacities and burgeoning consumer electronics markets. However, potential restraints include supply chain volatility and the inherent complexity of manufacturing these sophisticated components.
3C Electronic Functional Devices Company Market Share
Despite these challenges, the long-term market outlook remains highly favorable. The continuous integration of 3C electronic functional devices into diverse sectors, including automotive and medical devices, presents substantial growth opportunities. Ongoing innovation in materials science and manufacturing processes will further optimize performance, reduce costs, and broaden application horizons. Leading market participants, such as Marian, Inc., Boyd Corporation, and Jabil, are strategically investing in research and development and expanding production capacities to leverage this growth potential. The competitive landscape is expected to intensify with the emergence of niche players offering specialized solutions. Furthermore, a growing emphasis on sustainability and the utilization of eco-friendly materials will significantly influence the future trajectory of this dynamic market.
3C Electronic Functional Devices Market Report: 2019-2033
This comprehensive report provides an in-depth analysis of the 3C Electronic Functional Devices market, encompassing historical data (2019-2024), current estimations (2025), and future forecasts (2025-2033). It delves into market dynamics, key players, industry trends, and emerging opportunities, offering actionable insights for stakeholders across the computer, communication, and consumer electronics sectors. With a focus on battery, structural, and optical functional devices, this report is essential for strategic decision-making and investment planning. The market is projected to reach xx million by 2033.
3C Electronic Functional Devices Market Dynamics & Concentration
This section analyzes the market's competitive landscape, highlighting key factors influencing its evolution. The study period (2019-2033), base year (2025), and forecast period (2025-2033) provide a comprehensive view of market dynamics. The market concentration is moderate, with the top 5 players holding approximately xx% of the market share in 2025. Innovation in miniaturization and material science drives market growth, while stringent regulatory frameworks related to environmental compliance and safety standards shape industry practices. Product substitutes, such as alternative materials and technologies, pose a moderate threat. End-user trends toward thinner, lighter, and more energy-efficient devices are strong growth drivers. M&A activity has been significant, with approximately xx deals recorded between 2019 and 2024, mainly focused on expanding technological capabilities and market reach.
- Market Share (2025): Top 5 players - xx%
- M&A Deals (2019-2024): Approximately xx
- Key Innovation Drivers: Miniaturization, Material Science advancements
- Regulatory Focus: Environmental Compliance, Safety Standards
3C Electronic Functional Devices Industry Trends & Analysis
The 3C Electronic Functional Devices market exhibits robust growth, driven by the increasing demand for advanced electronics across various applications. The Compound Annual Growth Rate (CAGR) is estimated at xx% during the forecast period (2025-2033). Technological disruptions, such as the adoption of 5G technology and the rise of IoT devices, significantly impact market dynamics. Consumer preferences for sleek designs, enhanced functionalities, and longer battery life fuel innovation. The competitive landscape is highly dynamic, with companies investing heavily in R&D to maintain their market position. Market penetration of advanced functional devices, particularly in premium consumer electronics, is high and growing steadily. The market is expected to witness continued growth, propelled by the increasing adoption of smartphones, smart wearables, and other electronic gadgets.
Leading Markets & Segments in 3C Electronic Functional Devices
The Consumer Electronic segment dominates the 3C Electronic Functional Devices market, accounting for approximately xx% of the total market value in 2025. This is primarily driven by the explosive growth of smartphones and other portable devices. Within the types of functional devices, battery functional devices hold the largest share, followed by structural and optical devices. Asia, particularly China, represents the dominant geographical market, owing to its massive manufacturing base and burgeoning consumer electronics market.
- Dominant Segment (2025): Consumer Electronics (xx%)
- Dominant Type (2025): Battery Functional Devices (xx%)
- Dominant Region (2025): Asia (specifically China)
- Key Drivers (China): Robust electronics manufacturing, strong domestic demand, supportive government policies for technology advancement.
3C Electronic Functional Devices Product Developments
Recent product developments focus on miniaturization, improved energy efficiency, and enhanced performance. Innovations in materials science, such as the adoption of flexible circuits and advanced polymers, are enabling the creation of more sophisticated and compact functional devices. These advancements cater to the increasing demand for thinner, lighter, and more powerful electronics, improving market fit and creating a competitive advantage.
Key Drivers of 3C Electronic Functional Devices Growth
Several factors drive the growth of the 3C Electronic Functional Devices market. Technological advancements, particularly in miniaturization and energy storage, are key. Growing economic prosperity in developing countries increases demand for consumer electronics. Favorable government policies promoting technological innovation further boost market expansion.
Challenges in the 3C Electronic Functional Devices Market
The market faces challenges, including stringent regulatory compliance requirements, leading to increased production costs. Supply chain disruptions caused by geopolitical uncertainties and natural disasters affect production and availability. Intense competition from established and emerging players creates pricing pressures, impacting profit margins. These factors collectively impose constraints on market expansion.
Emerging Opportunities in 3C Electronic Functional Devices
The market presents substantial opportunities stemming from technological advancements, particularly in flexible electronics and energy harvesting. Strategic partnerships and collaborations between companies are creating new avenues for growth. Expansion into emerging markets, particularly in Africa and Latin America, offers significant market penetration potential.
Leading Players in the 3C Electronic Functional Devices Sector
- Marian,Inc
- Boyd Corporation
- Brady Corporation
- Kersentech
- Suzhou Anjie Electronics
- Suzhou Hengmingda Electronic Technology
- Shenzhen FRD
- SZCDL
- Dgtarry
- Shenzhen Hongfuhan Technology
- Shanghai Baolong Technology
- Jabil
- Foxconn
- BYD-Electronics
- Tongda Group
Key Milestones in 3C Electronic Functional Devices Industry
- 2020: Launch of xx new battery technology by Marian,Inc. significantly improves energy density.
- 2022: Acquisition of xx company by Foxconn expands its manufacturing capacity in Asia.
- 2023: Introduction of xx new material for structural devices by Boyd Corporation improves durability.
Strategic Outlook for 3C Electronic Functional Devices Market
The 3C Electronic Functional Devices market presents significant long-term growth potential, driven by technological innovations, increasing demand for advanced electronics, and expansion into new markets. Companies pursuing strategic partnerships, investing in R&D, and focusing on sustainable manufacturing practices are poised to capture substantial market share. The market is expected to see continuous growth through 2033 and beyond, driven by the constant evolution of consumer electronics and increasing integration of technology into daily life.
3C Electronic Functional Devices Segmentation
-
1. Application
- 1.1. Computer
- 1.2. Communication
- 1.3. Consumer Electronic
-
2. Types
- 2.1. Battery Functional Devices
- 2.2. Structural Functional Devices
- 2.3. Optical Functional Devic
3C Electronic Functional Devices Segmentation By Geography
-
1. North America
- 1.1. United States
- 1.2. Canada
- 1.3. Mexico
-
2. South America
- 2.1. Brazil
- 2.2. Argentina
- 2.3. Rest of South America
-
3. Europe
- 3.1. United Kingdom
- 3.2. Germany
- 3.3. France
- 3.4. Italy
- 3.5. Spain
- 3.6. Russia
- 3.7. Benelux
- 3.8. Nordics
- 3.9. Rest of Europe
-
4. Middle East & Africa
- 4.1. Turkey
- 4.2. Israel
- 4.3. GCC
- 4.4. North Africa
- 4.5. South Africa
- 4.6. Rest of Middle East & Africa
-
5. Asia Pacific
- 5.1. China
- 5.2. India
- 5.3. Japan
- 5.4. South Korea
- 5.5. ASEAN
- 5.6. Oceania
- 5.7. Rest of Asia Pacific
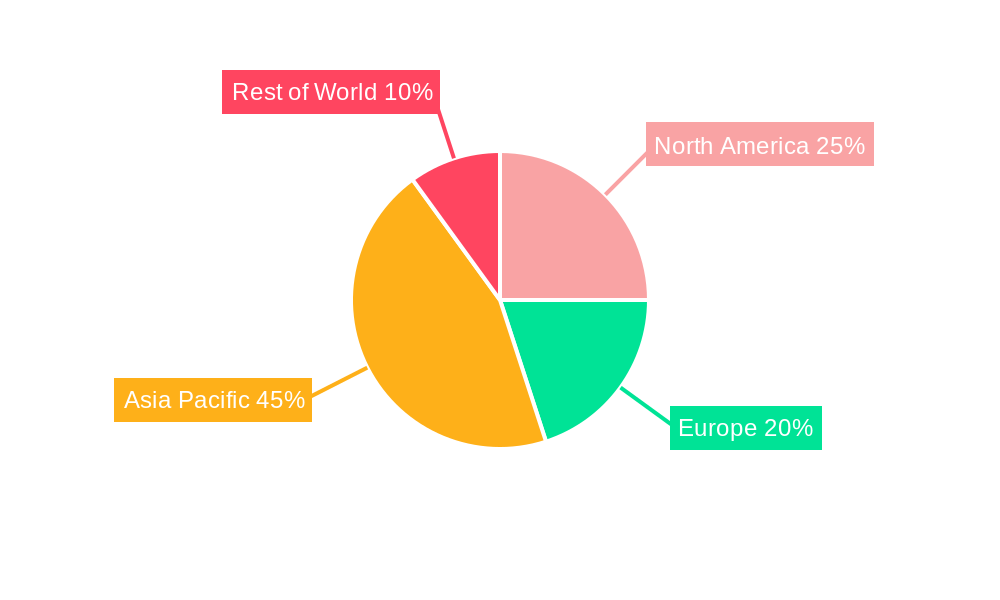
3C Electronic Functional Devices Regional Market Share
Geographic Coverage of 3C Electronic Functional Devices
3C Electronic Functional Devices REPORT HIGHLIGHTS
| Aspects | Details |
|---|---|
| Study Period | 2020-2034 |
| Base Year | 2025 |
| Estimated Year | 2026 |
| Forecast Period | 2026-2034 |
| Historical Period | 2020-2025 |
| Growth Rate | CAGR of 7.23% from 2020-2034 |
| Segmentation |
|
Table of Contents
- 1. Introduction
- 1.1. Research Scope
- 1.2. Market Segmentation
- 1.3. Research Methodology
- 1.4. Definitions and Assumptions
- 2. Executive Summary
- 2.1. Introduction
- 3. Market Dynamics
- 3.1. Introduction
- 3.2. Market Drivers
- 3.3. Market Restrains
- 3.4. Market Trends
- 4. Market Factor Analysis
- 4.1. Porters Five Forces
- 4.2. Supply/Value Chain
- 4.3. PESTEL analysis
- 4.4. Market Entropy
- 4.5. Patent/Trademark Analysis
- 5. Global 3C Electronic Functional Devices Analysis, Insights and Forecast, 2020-2032
- 5.1. Market Analysis, Insights and Forecast - by Application
- 5.1.1. Computer
- 5.1.2. Communication
- 5.1.3. Consumer Electronic
- 5.2. Market Analysis, Insights and Forecast - by Types
- 5.2.1. Battery Functional Devices
- 5.2.2. Structural Functional Devices
- 5.2.3. Optical Functional Devic
- 5.3. Market Analysis, Insights and Forecast - by Region
- 5.3.1. North America
- 5.3.2. South America
- 5.3.3. Europe
- 5.3.4. Middle East & Africa
- 5.3.5. Asia Pacific
- 5.1. Market Analysis, Insights and Forecast - by Application
- 6. North America 3C Electronic Functional Devices Analysis, Insights and Forecast, 2020-2032
- 6.1. Market Analysis, Insights and Forecast - by Application
- 6.1.1. Computer
- 6.1.2. Communication
- 6.1.3. Consumer Electronic
- 6.2. Market Analysis, Insights and Forecast - by Types
- 6.2.1. Battery Functional Devices
- 6.2.2. Structural Functional Devices
- 6.2.3. Optical Functional Devic
- 6.1. Market Analysis, Insights and Forecast - by Application
- 7. South America 3C Electronic Functional Devices Analysis, Insights and Forecast, 2020-2032
- 7.1. Market Analysis, Insights and Forecast - by Application
- 7.1.1. Computer
- 7.1.2. Communication
- 7.1.3. Consumer Electronic
- 7.2. Market Analysis, Insights and Forecast - by Types
- 7.2.1. Battery Functional Devices
- 7.2.2. Structural Functional Devices
- 7.2.3. Optical Functional Devic
- 7.1. Market Analysis, Insights and Forecast - by Application
- 8. Europe 3C Electronic Functional Devices Analysis, Insights and Forecast, 2020-2032
- 8.1. Market Analysis, Insights and Forecast - by Application
- 8.1.1. Computer
- 8.1.2. Communication
- 8.1.3. Consumer Electronic
- 8.2. Market Analysis, Insights and Forecast - by Types
- 8.2.1. Battery Functional Devices
- 8.2.2. Structural Functional Devices
- 8.2.3. Optical Functional Devic
- 8.1. Market Analysis, Insights and Forecast - by Application
- 9. Middle East & Africa 3C Electronic Functional Devices Analysis, Insights and Forecast, 2020-2032
- 9.1. Market Analysis, Insights and Forecast - by Application
- 9.1.1. Computer
- 9.1.2. Communication
- 9.1.3. Consumer Electronic
- 9.2. Market Analysis, Insights and Forecast - by Types
- 9.2.1. Battery Functional Devices
- 9.2.2. Structural Functional Devices
- 9.2.3. Optical Functional Devic
- 9.1. Market Analysis, Insights and Forecast - by Application
- 10. Asia Pacific 3C Electronic Functional Devices Analysis, Insights and Forecast, 2020-2032
- 10.1. Market Analysis, Insights and Forecast - by Application
- 10.1.1. Computer
- 10.1.2. Communication
- 10.1.3. Consumer Electronic
- 10.2. Market Analysis, Insights and Forecast - by Types
- 10.2.1. Battery Functional Devices
- 10.2.2. Structural Functional Devices
- 10.2.3. Optical Functional Devic
- 10.1. Market Analysis, Insights and Forecast - by Application
- 11. Competitive Analysis
- 11.1. Global Market Share Analysis 2025
- 11.2. Company Profiles
- 11.2.1 Marian
- 11.2.1.1. Overview
- 11.2.1.2. Products
- 11.2.1.3. SWOT Analysis
- 11.2.1.4. Recent Developments
- 11.2.1.5. Financials (Based on Availability)
- 11.2.2 Inc
- 11.2.2.1. Overview
- 11.2.2.2. Products
- 11.2.2.3. SWOT Analysis
- 11.2.2.4. Recent Developments
- 11.2.2.5. Financials (Based on Availability)
- 11.2.3 Boyd Corporation
- 11.2.3.1. Overview
- 11.2.3.2. Products
- 11.2.3.3. SWOT Analysis
- 11.2.3.4. Recent Developments
- 11.2.3.5. Financials (Based on Availability)
- 11.2.4 Brady Corporation
- 11.2.4.1. Overview
- 11.2.4.2. Products
- 11.2.4.3. SWOT Analysis
- 11.2.4.4. Recent Developments
- 11.2.4.5. Financials (Based on Availability)
- 11.2.5 Kersentech
- 11.2.5.1. Overview
- 11.2.5.2. Products
- 11.2.5.3. SWOT Analysis
- 11.2.5.4. Recent Developments
- 11.2.5.5. Financials (Based on Availability)
- 11.2.6 Suzhou Anjie Electronics
- 11.2.6.1. Overview
- 11.2.6.2. Products
- 11.2.6.3. SWOT Analysis
- 11.2.6.4. Recent Developments
- 11.2.6.5. Financials (Based on Availability)
- 11.2.7 Suzhou Hengmingda Electronic Technology
- 11.2.7.1. Overview
- 11.2.7.2. Products
- 11.2.7.3. SWOT Analysis
- 11.2.7.4. Recent Developments
- 11.2.7.5. Financials (Based on Availability)
- 11.2.8 Shenzhen FRD
- 11.2.8.1. Overview
- 11.2.8.2. Products
- 11.2.8.3. SWOT Analysis
- 11.2.8.4. Recent Developments
- 11.2.8.5. Financials (Based on Availability)
- 11.2.9 SZCDL
- 11.2.9.1. Overview
- 11.2.9.2. Products
- 11.2.9.3. SWOT Analysis
- 11.2.9.4. Recent Developments
- 11.2.9.5. Financials (Based on Availability)
- 11.2.10 Dgtarry
- 11.2.10.1. Overview
- 11.2.10.2. Products
- 11.2.10.3. SWOT Analysis
- 11.2.10.4. Recent Developments
- 11.2.10.5. Financials (Based on Availability)
- 11.2.11 Shenzhen Hongfuhan Technology
- 11.2.11.1. Overview
- 11.2.11.2. Products
- 11.2.11.3. SWOT Analysis
- 11.2.11.4. Recent Developments
- 11.2.11.5. Financials (Based on Availability)
- 11.2.12 Shanghai Baolong Technology
- 11.2.12.1. Overview
- 11.2.12.2. Products
- 11.2.12.3. SWOT Analysis
- 11.2.12.4. Recent Developments
- 11.2.12.5. Financials (Based on Availability)
- 11.2.13 Jabil
- 11.2.13.1. Overview
- 11.2.13.2. Products
- 11.2.13.3. SWOT Analysis
- 11.2.13.4. Recent Developments
- 11.2.13.5. Financials (Based on Availability)
- 11.2.14 Foxconn
- 11.2.14.1. Overview
- 11.2.14.2. Products
- 11.2.14.3. SWOT Analysis
- 11.2.14.4. Recent Developments
- 11.2.14.5. Financials (Based on Availability)
- 11.2.15 BYD-Electronics
- 11.2.15.1. Overview
- 11.2.15.2. Products
- 11.2.15.3. SWOT Analysis
- 11.2.15.4. Recent Developments
- 11.2.15.5. Financials (Based on Availability)
- 11.2.16 Tongda Group
- 11.2.16.1. Overview
- 11.2.16.2. Products
- 11.2.16.3. SWOT Analysis
- 11.2.16.4. Recent Developments
- 11.2.16.5. Financials (Based on Availability)
- 11.2.1 Marian
List of Figures
- Figure 1: Global 3C Electronic Functional Devices Revenue Breakdown (billion, %) by Region 2025 & 2033
- Figure 2: North America 3C Electronic Functional Devices Revenue (billion), by Application 2025 & 2033
- Figure 3: North America 3C Electronic Functional Devices Revenue Share (%), by Application 2025 & 2033
- Figure 4: North America 3C Electronic Functional Devices Revenue (billion), by Types 2025 & 2033
- Figure 5: North America 3C Electronic Functional Devices Revenue Share (%), by Types 2025 & 2033
- Figure 6: North America 3C Electronic Functional Devices Revenue (billion), by Country 2025 & 2033
- Figure 7: North America 3C Electronic Functional Devices Revenue Share (%), by Country 2025 & 2033
- Figure 8: South America 3C Electronic Functional Devices Revenue (billion), by Application 2025 & 2033
- Figure 9: South America 3C Electronic Functional Devices Revenue Share (%), by Application 2025 & 2033
- Figure 10: South America 3C Electronic Functional Devices Revenue (billion), by Types 2025 & 2033
- Figure 11: South America 3C Electronic Functional Devices Revenue Share (%), by Types 2025 & 2033
- Figure 12: South America 3C Electronic Functional Devices Revenue (billion), by Country 2025 & 2033
- Figure 13: South America 3C Electronic Functional Devices Revenue Share (%), by Country 2025 & 2033
- Figure 14: Europe 3C Electronic Functional Devices Revenue (billion), by Application 2025 & 2033
- Figure 15: Europe 3C Electronic Functional Devices Revenue Share (%), by Application 2025 & 2033
- Figure 16: Europe 3C Electronic Functional Devices Revenue (billion), by Types 2025 & 2033
- Figure 17: Europe 3C Electronic Functional Devices Revenue Share (%), by Types 2025 & 2033
- Figure 18: Europe 3C Electronic Functional Devices Revenue (billion), by Country 2025 & 2033
- Figure 19: Europe 3C Electronic Functional Devices Revenue Share (%), by Country 2025 & 2033
- Figure 20: Middle East & Africa 3C Electronic Functional Devices Revenue (billion), by Application 2025 & 2033
- Figure 21: Middle East & Africa 3C Electronic Functional Devices Revenue Share (%), by Application 2025 & 2033
- Figure 22: Middle East & Africa 3C Electronic Functional Devices Revenue (billion), by Types 2025 & 2033
- Figure 23: Middle East & Africa 3C Electronic Functional Devices Revenue Share (%), by Types 2025 & 2033
- Figure 24: Middle East & Africa 3C Electronic Functional Devices Revenue (billion), by Country 2025 & 2033
- Figure 25: Middle East & Africa 3C Electronic Functional Devices Revenue Share (%), by Country 2025 & 2033
- Figure 26: Asia Pacific 3C Electronic Functional Devices Revenue (billion), by Application 2025 & 2033
- Figure 27: Asia Pacific 3C Electronic Functional Devices Revenue Share (%), by Application 2025 & 2033
- Figure 28: Asia Pacific 3C Electronic Functional Devices Revenue (billion), by Types 2025 & 2033
- Figure 29: Asia Pacific 3C Electronic Functional Devices Revenue Share (%), by Types 2025 & 2033
- Figure 30: Asia Pacific 3C Electronic Functional Devices Revenue (billion), by Country 2025 & 2033
- Figure 31: Asia Pacific 3C Electronic Functional Devices Revenue Share (%), by Country 2025 & 2033
List of Tables
- Table 1: Global 3C Electronic Functional Devices Revenue billion Forecast, by Application 2020 & 2033
- Table 2: Global 3C Electronic Functional Devices Revenue billion Forecast, by Types 2020 & 2033
- Table 3: Global 3C Electronic Functional Devices Revenue billion Forecast, by Region 2020 & 2033
- Table 4: Global 3C Electronic Functional Devices Revenue billion Forecast, by Application 2020 & 2033
- Table 5: Global 3C Electronic Functional Devices Revenue billion Forecast, by Types 2020 & 2033
- Table 6: Global 3C Electronic Functional Devices Revenue billion Forecast, by Country 2020 & 2033
- Table 7: United States 3C Electronic Functional Devices Revenue (billion) Forecast, by Application 2020 & 2033
- Table 8: Canada 3C Electronic Functional Devices Revenue (billion) Forecast, by Application 2020 & 2033
- Table 9: Mexico 3C Electronic Functional Devices Revenue (billion) Forecast, by Application 2020 & 2033
- Table 10: Global 3C Electronic Functional Devices Revenue billion Forecast, by Application 2020 & 2033
- Table 11: Global 3C Electronic Functional Devices Revenue billion Forecast, by Types 2020 & 2033
- Table 12: Global 3C Electronic Functional Devices Revenue billion Forecast, by Country 2020 & 2033
- Table 13: Brazil 3C Electronic Functional Devices Revenue (billion) Forecast, by Application 2020 & 2033
- Table 14: Argentina 3C Electronic Functional Devices Revenue (billion) Forecast, by Application 2020 & 2033
- Table 15: Rest of South America 3C Electronic Functional Devices Revenue (billion) Forecast, by Application 2020 & 2033
- Table 16: Global 3C Electronic Functional Devices Revenue billion Forecast, by Application 2020 & 2033
- Table 17: Global 3C Electronic Functional Devices Revenue billion Forecast, by Types 2020 & 2033
- Table 18: Global 3C Electronic Functional Devices Revenue billion Forecast, by Country 2020 & 2033
- Table 19: United Kingdom 3C Electronic Functional Devices Revenue (billion) Forecast, by Application 2020 & 2033
- Table 20: Germany 3C Electronic Functional Devices Revenue (billion) Forecast, by Application 2020 & 2033
- Table 21: France 3C Electronic Functional Devices Revenue (billion) Forecast, by Application 2020 & 2033
- Table 22: Italy 3C Electronic Functional Devices Revenue (billion) Forecast, by Application 2020 & 2033
- Table 23: Spain 3C Electronic Functional Devices Revenue (billion) Forecast, by Application 2020 & 2033
- Table 24: Russia 3C Electronic Functional Devices Revenue (billion) Forecast, by Application 2020 & 2033
- Table 25: Benelux 3C Electronic Functional Devices Revenue (billion) Forecast, by Application 2020 & 2033
- Table 26: Nordics 3C Electronic Functional Devices Revenue (billion) Forecast, by Application 2020 & 2033
- Table 27: Rest of Europe 3C Electronic Functional Devices Revenue (billion) Forecast, by Application 2020 & 2033
- Table 28: Global 3C Electronic Functional Devices Revenue billion Forecast, by Application 2020 & 2033
- Table 29: Global 3C Electronic Functional Devices Revenue billion Forecast, by Types 2020 & 2033
- Table 30: Global 3C Electronic Functional Devices Revenue billion Forecast, by Country 2020 & 2033
- Table 31: Turkey 3C Electronic Functional Devices Revenue (billion) Forecast, by Application 2020 & 2033
- Table 32: Israel 3C Electronic Functional Devices Revenue (billion) Forecast, by Application 2020 & 2033
- Table 33: GCC 3C Electronic Functional Devices Revenue (billion) Forecast, by Application 2020 & 2033
- Table 34: North Africa 3C Electronic Functional Devices Revenue (billion) Forecast, by Application 2020 & 2033
- Table 35: South Africa 3C Electronic Functional Devices Revenue (billion) Forecast, by Application 2020 & 2033
- Table 36: Rest of Middle East & Africa 3C Electronic Functional Devices Revenue (billion) Forecast, by Application 2020 & 2033
- Table 37: Global 3C Electronic Functional Devices Revenue billion Forecast, by Application 2020 & 2033
- Table 38: Global 3C Electronic Functional Devices Revenue billion Forecast, by Types 2020 & 2033
- Table 39: Global 3C Electronic Functional Devices Revenue billion Forecast, by Country 2020 & 2033
- Table 40: China 3C Electronic Functional Devices Revenue (billion) Forecast, by Application 2020 & 2033
- Table 41: India 3C Electronic Functional Devices Revenue (billion) Forecast, by Application 2020 & 2033
- Table 42: Japan 3C Electronic Functional Devices Revenue (billion) Forecast, by Application 2020 & 2033
- Table 43: South Korea 3C Electronic Functional Devices Revenue (billion) Forecast, by Application 2020 & 2033
- Table 44: ASEAN 3C Electronic Functional Devices Revenue (billion) Forecast, by Application 2020 & 2033
- Table 45: Oceania 3C Electronic Functional Devices Revenue (billion) Forecast, by Application 2020 & 2033
- Table 46: Rest of Asia Pacific 3C Electronic Functional Devices Revenue (billion) Forecast, by Application 2020 & 2033
Frequently Asked Questions
1. What is the projected Compound Annual Growth Rate (CAGR) of the 3C Electronic Functional Devices?
The projected CAGR is approximately 7.23%.
2. Which companies are prominent players in the 3C Electronic Functional Devices?
Key companies in the market include Marian, Inc, Boyd Corporation, Brady Corporation, Kersentech, Suzhou Anjie Electronics, Suzhou Hengmingda Electronic Technology, Shenzhen FRD, SZCDL, Dgtarry, Shenzhen Hongfuhan Technology, Shanghai Baolong Technology, Jabil, Foxconn, BYD-Electronics, Tongda Group.
3. What are the main segments of the 3C Electronic Functional Devices?
The market segments include Application, Types.
4. Can you provide details about the market size?
The market size is estimated to be USD 15.38 billion as of 2022.
5. What are some drivers contributing to market growth?
N/A
6. What are the notable trends driving market growth?
N/A
7. Are there any restraints impacting market growth?
N/A
8. Can you provide examples of recent developments in the market?
N/A
9. What pricing options are available for accessing the report?
Pricing options include single-user, multi-user, and enterprise licenses priced at USD 2900.00, USD 4350.00, and USD 5800.00 respectively.
10. Is the market size provided in terms of value or volume?
The market size is provided in terms of value, measured in billion.
11. Are there any specific market keywords associated with the report?
Yes, the market keyword associated with the report is "3C Electronic Functional Devices," which aids in identifying and referencing the specific market segment covered.
12. How do I determine which pricing option suits my needs best?
The pricing options vary based on user requirements and access needs. Individual users may opt for single-user licenses, while businesses requiring broader access may choose multi-user or enterprise licenses for cost-effective access to the report.
13. Are there any additional resources or data provided in the 3C Electronic Functional Devices report?
While the report offers comprehensive insights, it's advisable to review the specific contents or supplementary materials provided to ascertain if additional resources or data are available.
14. How can I stay updated on further developments or reports in the 3C Electronic Functional Devices?
To stay informed about further developments, trends, and reports in the 3C Electronic Functional Devices, consider subscribing to industry newsletters, following relevant companies and organizations, or regularly checking reputable industry news sources and publications.
Methodology
Step 1 - Identification of Relevant Samples Size from Population Database


Step 2 - Approaches for Defining Global Market Size (Value, Volume* & Price*)

Note*: In applicable scenarios
Step 3 - Data Sources
Primary Research
- Web Analytics
- Survey Reports
- Research Institute
- Latest Research Reports
- Opinion Leaders
Secondary Research
- Annual Reports
- White Paper
- Latest Press Release
- Industry Association
- Paid Database
- Investor Presentations

Step 4 - Data Triangulation
Involves using different sources of information in order to increase the validity of a study
These sources are likely to be stakeholders in a program - participants, other researchers, program staff, other community members, and so on.
Then we put all data in single framework & apply various statistical tools to find out the dynamic on the market.
During the analysis stage, feedback from the stakeholder groups would be compared to determine areas of agreement as well as areas of divergence