


Key Insights
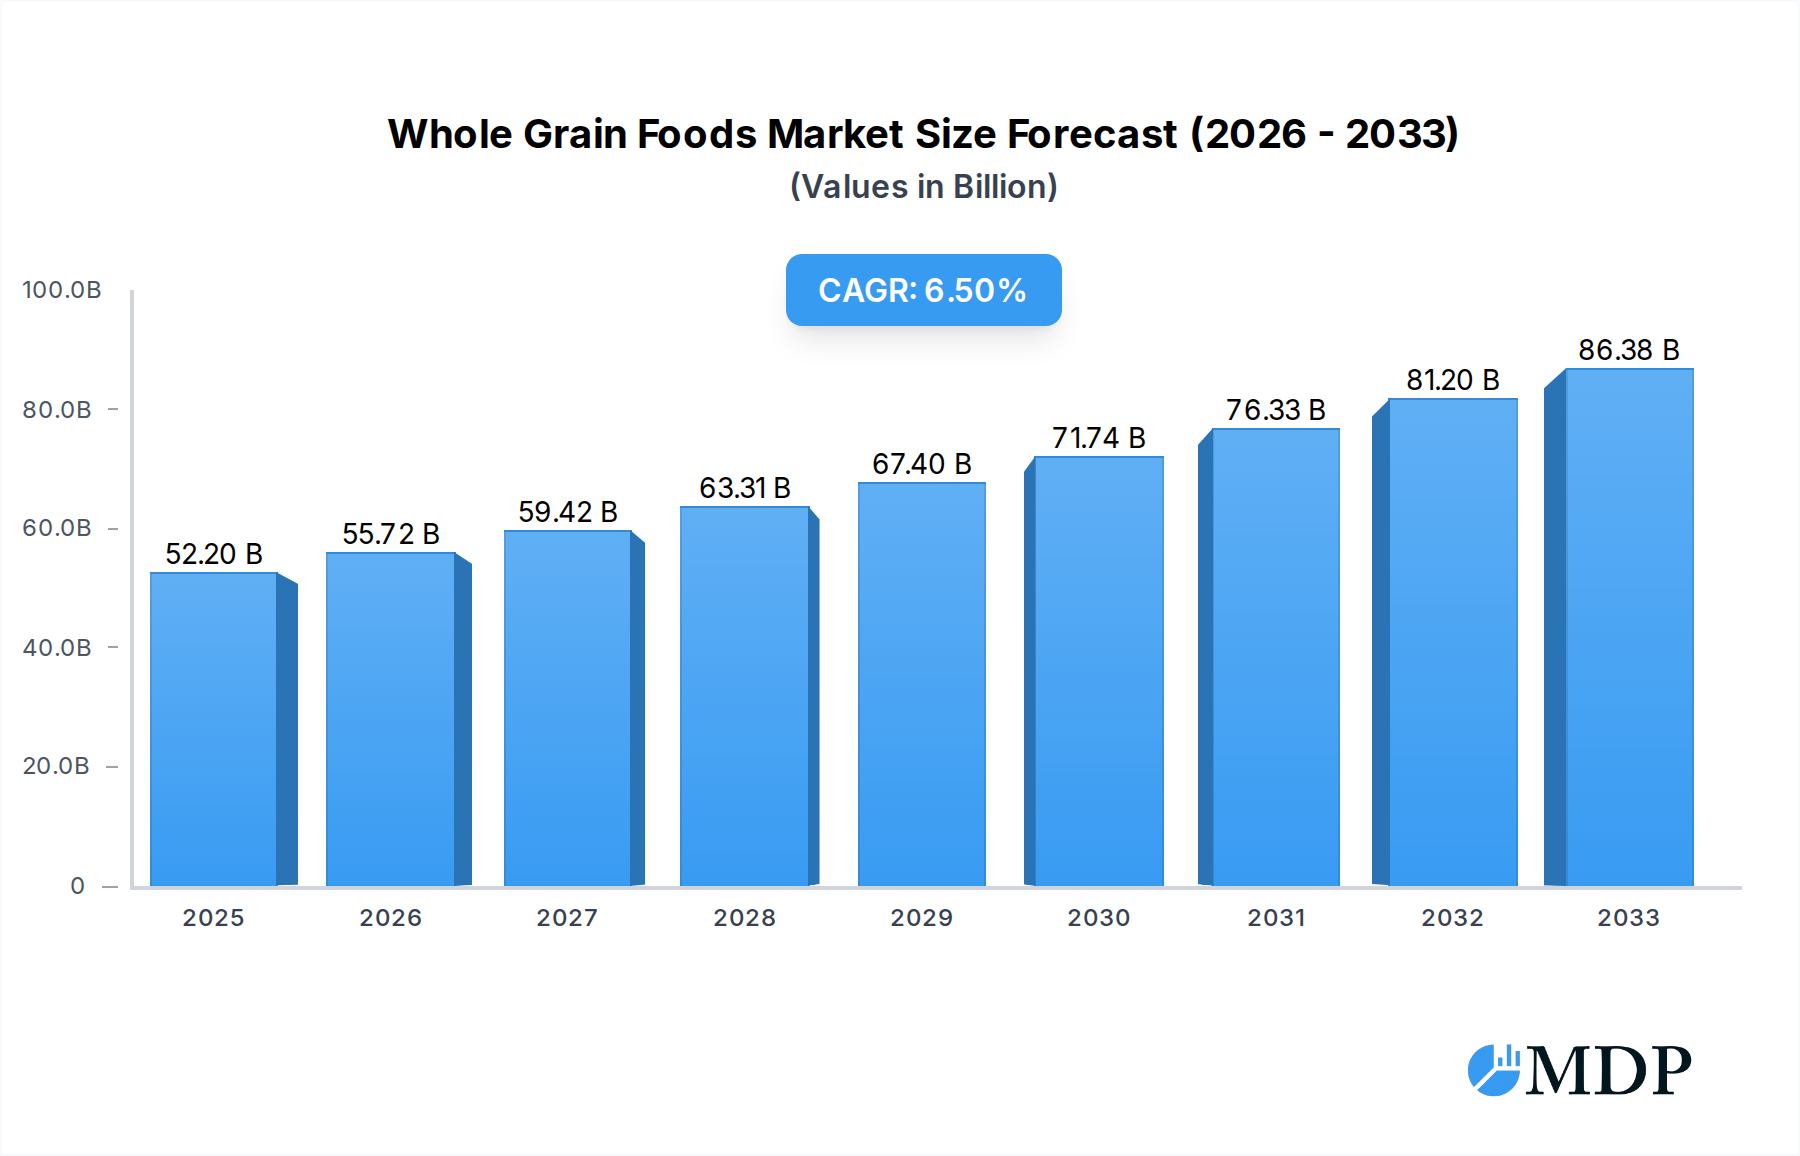
The global Whole Grain Foods market is poised for substantial growth, with a projected market size of $52,200 million in 2025, expanding at a robust Compound Annual Growth Rate (CAGR) of 6.7% through 2033. This upward trajectory is propelled by a growing consumer consciousness regarding health and wellness, a heightened demand for nutritious food options, and increasing awareness of the long-term benefits associated with whole grain consumption. The market is witnessing a significant shift towards healthier dietary choices, with consumers actively seeking products that offer fiber, vitamins, and essential minerals. This trend is particularly evident across various distribution channels, including supermarkets/hypermarkets, the rapidly expanding online/e-commerce sector, and independent retail outlets. The diverse applications, ranging from whole grain cereals and bakery products to whole grain flour and other specialized items, further contribute to the market's broad appeal and potential. Key market drivers include supportive government initiatives promoting healthy eating, advancements in food processing technologies enabling the development of appealing whole grain products, and a general rise in disposable incomes, allowing consumers to prioritize quality and health in their food purchases.
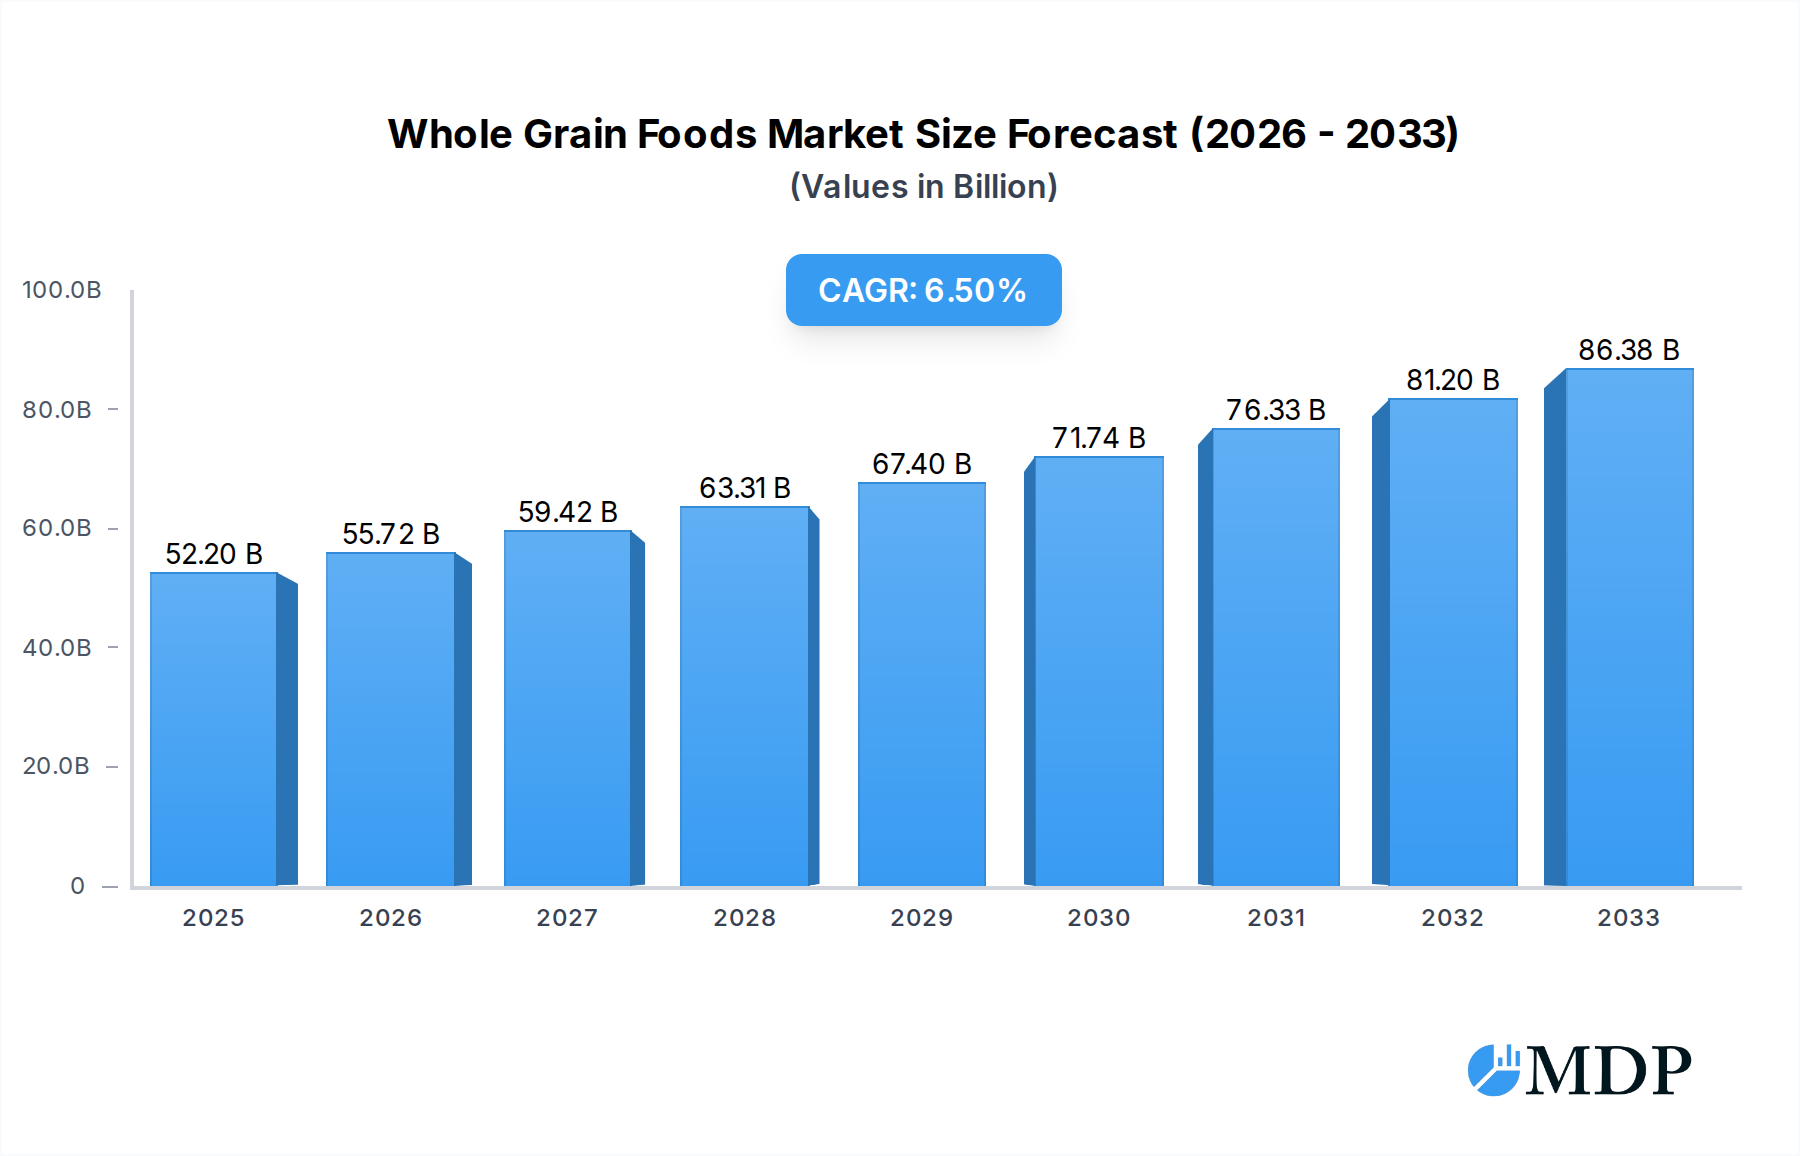
Whole Grain Foods Market Size (In Billion)

The whole grain foods industry is characterized by dynamic trends such as the innovation of novel product formulations, the integration of ancient grains, and the development of gluten-free whole grain options to cater to specific dietary needs. Furthermore, the increasing prevalence of chronic diseases linked to poor diet is acting as a significant catalyst, encouraging a proactive approach to nutrition. However, certain restraints temper this optimistic outlook. These include the higher cost of whole grain ingredients compared to refined grains, which can affect price-sensitive consumer segments, and the ongoing challenge of educating consumers about the distinct benefits of whole grains over their refined counterparts. Despite these hurdles, the market's strong growth potential is supported by major industry players like Cargill, Kellogg, General Mills, and Nestlé, who are actively investing in research and development and expanding their product portfolios. The Asia Pacific region, driven by its large population and growing health consciousness, alongside North America and Europe, is expected to lead market expansion, showcasing a global commitment to healthier eating habits.
Whole Grain Foods Company Market Share
Whole Grain Foods Market: Unlocking Growth and Innovation in a Health-Conscious World
This comprehensive report delves deep into the global whole grain foods market, a rapidly expanding sector driven by surging consumer demand for healthier dietary options. With a study period spanning from 2019 to 2033, this analysis provides an unparalleled view of market dynamics, key trends, and strategic opportunities. Our base year is 2025, with projections extending through a robust forecast period of 2025–2033, building upon extensive historical data from 2019–2024. This report is an essential resource for food manufacturers, ingredient suppliers, distributors, retailers, investors, and industry analysts seeking to capitalize on the burgeoning whole grain market.
Whole Grain Foods Market Dynamics & Concentration
The whole grain foods market exhibits a moderate to high concentration, with a significant portion of market share held by a few dominant global players. Innovation serves as a primary driver, fueled by continuous research and development in ingredient processing, product formulation, and health benefits communication. Regulatory frameworks, particularly those around labeling and health claims, play a crucial role in shaping consumer perception and product development strategies. Product substitutes, including refined grain products and other healthy alternatives, present a constant competitive pressure. End-user trends are overwhelmingly skewed towards health and wellness, with consumers actively seeking out nutrient-dense, fiber-rich food options. M&A activities are prevalent, indicating a strategic consolidation by larger companies to expand their product portfolios and market reach. We observe approximately 35 M&A deal counts within the historical period, with a combined market share for the top 5 companies exceeding 60%.
Whole Grain Foods Industry Trends & Analysis
The global whole grain foods market is poised for substantial growth, projected to witness a Compound Annual Growth Rate (CAGR) of approximately 7.8% from 2025 to 2033. This expansion is propelled by a confluence of factors, including increasing consumer awareness regarding the health benefits associated with whole grains, such as reduced risk of chronic diseases like heart disease and type 2 diabetes. The rising prevalence of lifestyle-related health issues globally acts as a significant market growth driver. Technological disruptions are transforming the industry, with advancements in milling techniques preserving more nutrients and improving palatability, alongside innovations in processing that enable the creation of diverse and appealing whole grain product formats. Consumer preferences are shifting dramatically, with a growing demand for transparent labeling, traceable ingredients, and products that cater to specific dietary needs like gluten-free and plant-based options. The competitive landscape is characterized by intense rivalry among established food giants and emerging niche brands, all vying for market penetration, which is estimated to reach over 45% by the end of the forecast period. Strategic marketing campaigns highlighting the natural goodness and health advantages of whole grains are proving highly effective in capturing consumer attention and loyalty.
Leading Markets & Segments in Whole Grain Foods
The Supermarkets/Hypermarkets segment is the dominant distribution channel in the whole grain foods market, commanding an estimated 55% of the global market share in 2025. This dominance is attributed to their extensive reach, convenience for consumers, and the ability to offer a wide variety of whole grain cereals, whole grain bakery products, and whole grain flour. Economic policies promoting healthy eating habits and the widespread availability of large-format retail infrastructure contribute significantly to this segment's strength.
North America emerges as the leading geographical market, driven by a highly health-conscious consumer base and well-established food distribution networks. The region’s robust regulatory environment, which encourages clear labeling of whole grain content, further bolsters market growth.
In terms of product types, Whole Grain Cereals represent the largest segment, accounting for an estimated 40% of the market in 2025. This is followed closely by Whole Grain Bakery Products, which are experiencing rapid growth due to innovation in product formats and appeal to a broader consumer base. Whole Grain Flour is a vital component, serving as a foundational ingredient for numerous food applications.
Key Drivers for Supermarket/Hypermarket Dominance:
- Extensive product variety and one-stop shopping convenience.
- Promotional activities and attractive pricing strategies.
- Strong supply chain integration and logistical capabilities.
- Increasing adoption of private label whole grain brands.
Drivers for North American Market Leadership:
- High consumer spending power and prioritization of health and wellness.
- Proactive government initiatives promoting healthy diets.
- Strong presence of leading whole grain food manufacturers.
- Well-developed retail infrastructure and e-commerce integration.
Whole Grain Foods Product Developments
Product innovation in the whole grain foods sector is centered on enhancing nutritional profiles, improving taste and texture, and catering to evolving dietary preferences. Companies are actively developing new formulations for whole grain cereals with novel flavor combinations and added functional ingredients like prebiotics and probiotics. In the whole grain bakery products segment, advancements include the creation of gluten-free and allergen-friendly options, as well as extended shelf-life formulations. The competitive advantage lies in offering transparent ingredient lists, sustainable sourcing, and demonstrably superior health benefits, appealing to the growing segment of informed consumers seeking premium, health-focused food choices.
Key Drivers of Whole Grain Foods Growth
The whole grain foods market is propelled by several key drivers. Technologically, advancements in milling and processing techniques are enhancing the nutritional value and palatability of whole grains, making them more accessible and appealing to consumers. Economically, rising disposable incomes in emerging markets are enabling a greater proportion of the population to prioritize health-conscious food choices. Regulatory factors, such as clear labeling guidelines and government-backed health initiatives promoting whole grain consumption, are further stimulating demand. The increasing consumer awareness regarding the link between diet and long-term health outcomes remains a paramount economic driver.
Challenges in the Whole Grain Foods Market
Despite robust growth, the whole grain foods market faces several challenges. Regulatory hurdles, particularly inconsistencies in labeling standards across different regions, can create confusion for consumers and manufacturers alike. Supply chain issues, including the availability and cost of high-quality whole grain ingredients, can impact production and pricing strategies. Competitive pressures from refined grain products and other health food alternatives remain significant, requiring continuous innovation and effective marketing to maintain market share. The perceived cost premium of whole grain products compared to their refined counterparts can also act as a restraint for price-sensitive consumers.
Emerging Opportunities in Whole Grain Foods
Emerging opportunities in the whole grain foods market are multifaceted, promising sustained long-term growth. Technological breakthroughs in plant-based ingredient innovation and fermentation processes are paving the way for novel whole grain product formulations with enhanced functionalities and unique taste profiles. Strategic partnerships between ingredient suppliers and food manufacturers can streamline the development and distribution of innovative whole grain products, fostering wider market penetration. Market expansion strategies targeting underserved demographics and geographical regions, coupled with the growing trend of personalized nutrition, present significant untapped potential for growth and innovation in the whole grain foods industry.
Leading Players in the Whole Grain Foods Sector
- Cargill
- Cereal Ingredients (CII)
- Flowers Foods
- Hodgson Mill
- Kellogg
- Allied Bakeries
- Bob’s Red Mill Natural Foods
- Food For Life
- General Mills
- Grain Millers
- Mondelez International
- Nestlé
- Quaker Oats
Key Milestones in Whole Grain Foods Industry
- 2019: Increased adoption of whole grain labeling standards in key global markets, boosting consumer confidence.
- 2020: Launch of several innovative whole grain snack bars catering to on-the-go consumption.
- 2021: Significant investment in research and development of novel whole grain flours with improved baking properties.
- 2022: Growing consumer demand for plant-based whole grain alternatives, leading to new product introductions.
- 2023: Strategic acquisitions and mergers aimed at expanding product portfolios in the bakery and cereal segments.
- 2024: Enhanced focus on sustainable sourcing and transparent supply chains within the whole grain industry.
Strategic Outlook for Whole Grain Foods Market
The strategic outlook for the whole grain foods market is exceptionally positive, characterized by sustained growth and increasing consumer acceptance. Future market potential lies in further diversifying product offerings to cater to niche dietary needs and preferences, such as keto-friendly or high-protein whole grain options. Strategic opportunities include leveraging advanced digital marketing to educate consumers about the benefits of whole grains and partnering with health and wellness influencers. Expanding into emerging economies with growing health consciousness and investing in sustainable and ethical sourcing practices will be crucial for long-term success and market leadership in the dynamic whole grain foods industry.
Whole Grain Foods Segmentation
-
1. Application
- 1.1. Supermarkets/Hypermarkets
- 1.2. Online/E-Commerce
- 1.3. Independent Retail Outlets
- 1.4. Others
-
2. Type
- 2.1. Whole Grain Cereals
- 2.2. Whole Grain Bakery Products
- 2.3. Whole Grain Flour
- 2.4. Others
Whole Grain Foods Segmentation By Geography
-
1. North America
- 1.1. United States
- 1.2. Canada
- 1.3. Mexico
-
2. South America
- 2.1. Brazil
- 2.2. Argentina
- 2.3. Rest of South America
-
3. Europe
- 3.1. United Kingdom
- 3.2. Germany
- 3.3. France
- 3.4. Italy
- 3.5. Spain
- 3.6. Russia
- 3.7. Benelux
- 3.8. Nordics
- 3.9. Rest of Europe
-
4. Middle East & Africa
- 4.1. Turkey
- 4.2. Israel
- 4.3. GCC
- 4.4. North Africa
- 4.5. South Africa
- 4.6. Rest of Middle East & Africa
-
5. Asia Pacific
- 5.1. China
- 5.2. India
- 5.3. Japan
- 5.4. South Korea
- 5.5. ASEAN
- 5.6. Oceania
- 5.7. Rest of Asia Pacific
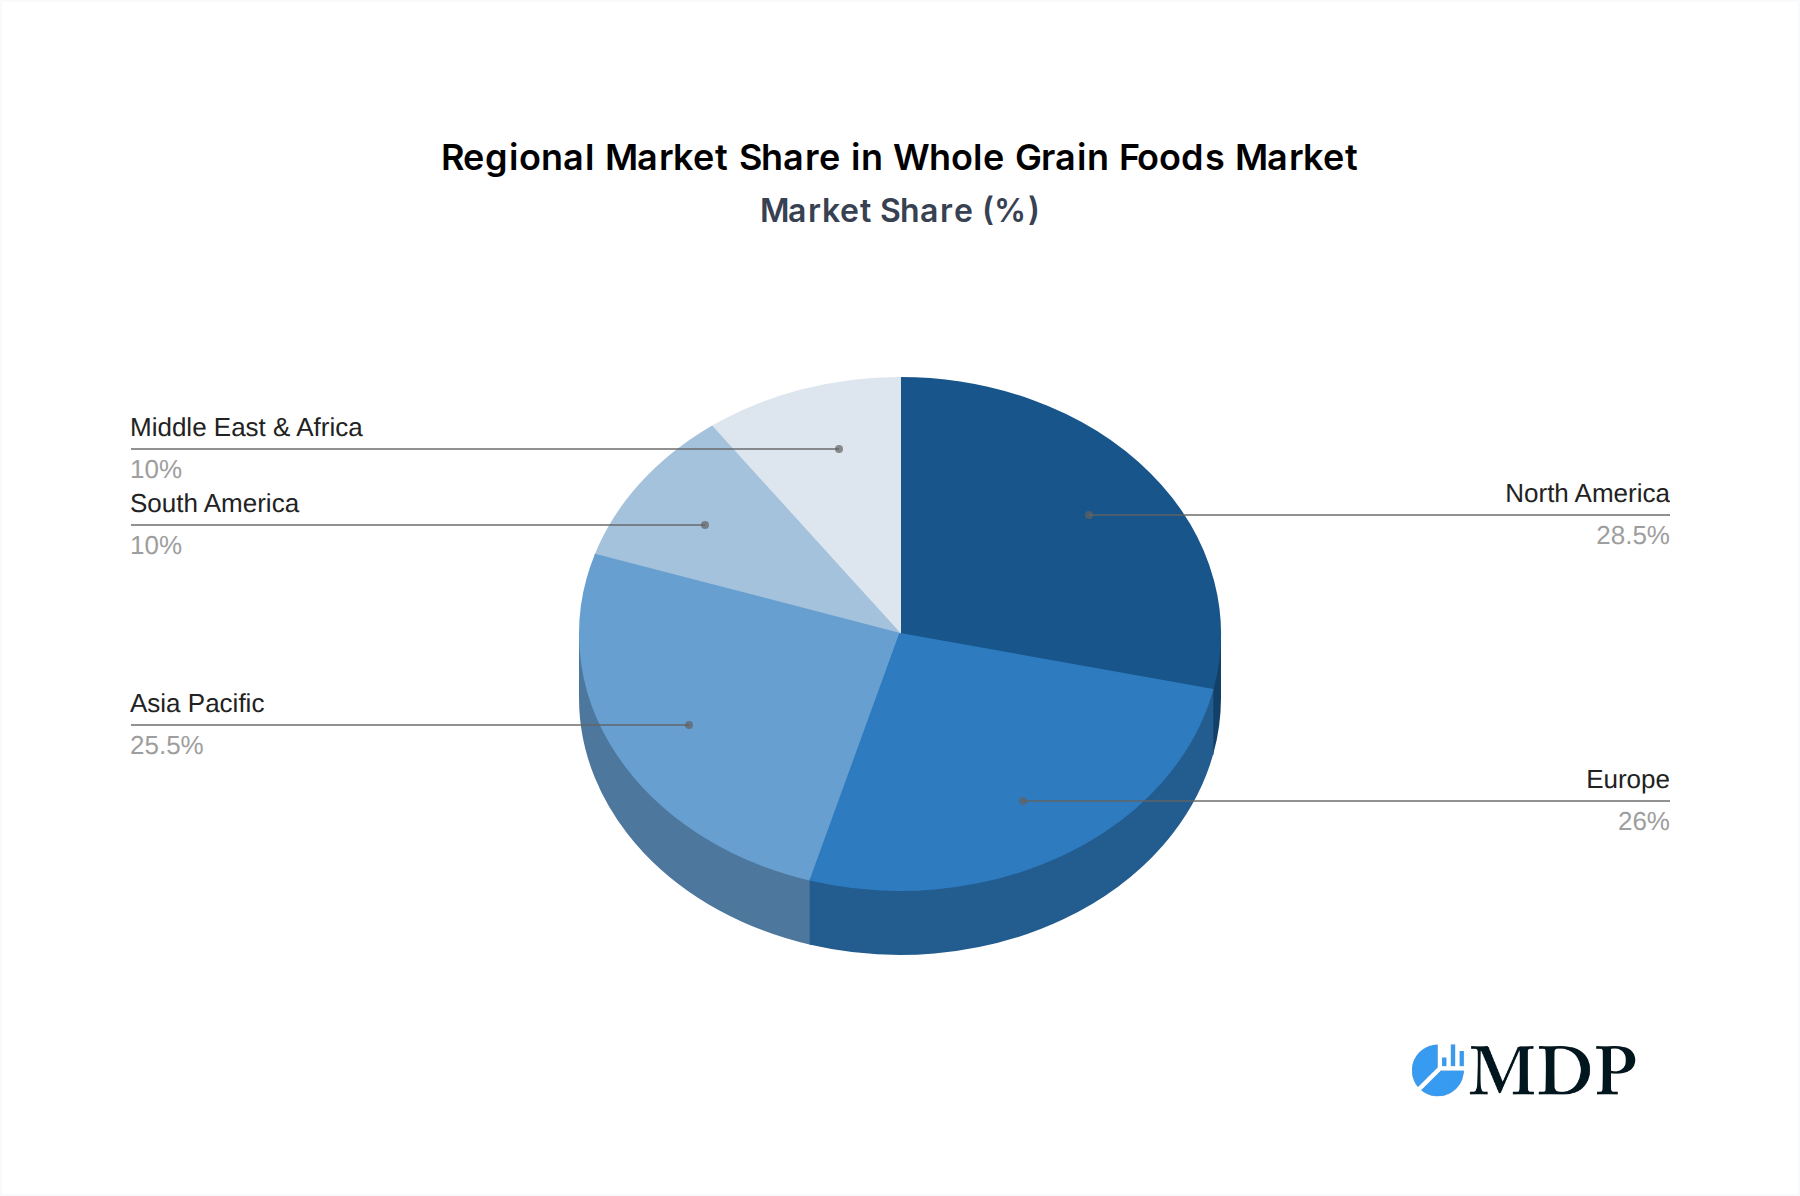
Whole Grain Foods Regional Market Share
Geographic Coverage of Whole Grain Foods
Whole Grain Foods REPORT HIGHLIGHTS
| Aspects | Details |
|---|---|
| Study Period | 2020-2034 |
| Base Year | 2025 |
| Estimated Year | 2026 |
| Forecast Period | 2026-2034 |
| Historical Period | 2020-2025 |
| Growth Rate | CAGR of 6.4% from 2020-2034 |
| Segmentation |
|
Table of Contents
- 1. Introduction
- 1.1. Research Scope
- 1.2. Market Segmentation
- 1.3. Research Objective
- 1.4. Definitions and Assumptions
- 2. Executive Summary
- 2.1. Market Snapshot
- 3. Market Dynamics
- 3.1. Market Drivers
- 3.2. Market Restrains
- 3.3. Market Trends
- 3.4. Market Opportunities
- 4. Market Factor Analysis
- 4.1. Porters Five Forces
- 4.1.1. Bargaining Power of Suppliers
- 4.1.2. Bargaining Power of Buyers
- 4.1.3. Threat of New Entrants
- 4.1.4. Threat of Substitutes
- 4.1.5. Competitive Rivalry
- 4.2. PESTEL analysis
- 4.3. BCG Analysis
- 4.3.1. Stars (High Growth, High Market Share)
- 4.3.2. Cash Cows (Low Growth, High Market Share)
- 4.3.3. Question Mark (High Growth, Low Market Share)
- 4.3.4. Dogs (Low Growth, Low Market Share)
- 4.4. Ansoff Matrix Analysis
- 4.5. Supply Chain Analysis
- 4.6. Regulatory Landscape
- 4.7. Current Market Potential and Opportunity Assessment (TAM–SAM–SOM Framework)
- 4.8. MDP Analyst Note
- 4.1. Porters Five Forces
- 5. Market Analysis, Insights and Forecast 2021-2033
- 5.1. Market Analysis, Insights and Forecast - by Application
- 5.1.1. Supermarkets/Hypermarkets
- 5.1.2. Online/E-Commerce
- 5.1.3. Independent Retail Outlets
- 5.1.4. Others
- 5.2. Market Analysis, Insights and Forecast - by Type
- 5.2.1. Whole Grain Cereals
- 5.2.2. Whole Grain Bakery Products
- 5.2.3. Whole Grain Flour
- 5.2.4. Others
- 5.3. Market Analysis, Insights and Forecast - by Region
- 5.3.1. North America
- 5.3.2. South America
- 5.3.3. Europe
- 5.3.4. Middle East & Africa
- 5.3.5. Asia Pacific
- 5.1. Market Analysis, Insights and Forecast - by Application
- 6. Global Whole Grain Foods Analysis, Insights and Forecast, 2021-2033
- 6.1. Market Analysis, Insights and Forecast - by Application
- 6.1.1. Supermarkets/Hypermarkets
- 6.1.2. Online/E-Commerce
- 6.1.3. Independent Retail Outlets
- 6.1.4. Others
- 6.2. Market Analysis, Insights and Forecast - by Type
- 6.2.1. Whole Grain Cereals
- 6.2.2. Whole Grain Bakery Products
- 6.2.3. Whole Grain Flour
- 6.2.4. Others
- 6.1. Market Analysis, Insights and Forecast - by Application
- 7. North America Whole Grain Foods Analysis, Insights and Forecast, 2020-2032
- 7.1. Market Analysis, Insights and Forecast - by Application
- 7.1.1. Supermarkets/Hypermarkets
- 7.1.2. Online/E-Commerce
- 7.1.3. Independent Retail Outlets
- 7.1.4. Others
- 7.2. Market Analysis, Insights and Forecast - by Type
- 7.2.1. Whole Grain Cereals
- 7.2.2. Whole Grain Bakery Products
- 7.2.3. Whole Grain Flour
- 7.2.4. Others
- 7.1. Market Analysis, Insights and Forecast - by Application
- 8. South America Whole Grain Foods Analysis, Insights and Forecast, 2020-2032
- 8.1. Market Analysis, Insights and Forecast - by Application
- 8.1.1. Supermarkets/Hypermarkets
- 8.1.2. Online/E-Commerce
- 8.1.3. Independent Retail Outlets
- 8.1.4. Others
- 8.2. Market Analysis, Insights and Forecast - by Type
- 8.2.1. Whole Grain Cereals
- 8.2.2. Whole Grain Bakery Products
- 8.2.3. Whole Grain Flour
- 8.2.4. Others
- 8.1. Market Analysis, Insights and Forecast - by Application
- 9. Europe Whole Grain Foods Analysis, Insights and Forecast, 2020-2032
- 9.1. Market Analysis, Insights and Forecast - by Application
- 9.1.1. Supermarkets/Hypermarkets
- 9.1.2. Online/E-Commerce
- 9.1.3. Independent Retail Outlets
- 9.1.4. Others
- 9.2. Market Analysis, Insights and Forecast - by Type
- 9.2.1. Whole Grain Cereals
- 9.2.2. Whole Grain Bakery Products
- 9.2.3. Whole Grain Flour
- 9.2.4. Others
- 9.1. Market Analysis, Insights and Forecast - by Application
- 10. Middle East & Africa Whole Grain Foods Analysis, Insights and Forecast, 2020-2032
- 10.1. Market Analysis, Insights and Forecast - by Application
- 10.1.1. Supermarkets/Hypermarkets
- 10.1.2. Online/E-Commerce
- 10.1.3. Independent Retail Outlets
- 10.1.4. Others
- 10.2. Market Analysis, Insights and Forecast - by Type
- 10.2.1. Whole Grain Cereals
- 10.2.2. Whole Grain Bakery Products
- 10.2.3. Whole Grain Flour
- 10.2.4. Others
- 10.1. Market Analysis, Insights and Forecast - by Application
- 11. Asia Pacific Whole Grain Foods Analysis, Insights and Forecast, 2020-2032
- 11.1. Market Analysis, Insights and Forecast - by Application
- 11.1.1. Supermarkets/Hypermarkets
- 11.1.2. Online/E-Commerce
- 11.1.3. Independent Retail Outlets
- 11.1.4. Others
- 11.2. Market Analysis, Insights and Forecast - by Type
- 11.2.1. Whole Grain Cereals
- 11.2.2. Whole Grain Bakery Products
- 11.2.3. Whole Grain Flour
- 11.2.4. Others
- 11.1. Market Analysis, Insights and Forecast - by Application
- 12. Competitive Analysis
- 12.1. Company Profiles
- 12.1.1 Cargill
- 12.1.1.1. Company Overview
- 12.1.1.2. Products
- 12.1.1.3. Company Financials
- 12.1.1.4. SWOT Analysis
- 12.1.2 Cereal Ingredients (CII)
- 12.1.2.1. Company Overview
- 12.1.2.2. Products
- 12.1.2.3. Company Financials
- 12.1.2.4. SWOT Analysis
- 12.1.3 Flowers Foods
- 12.1.3.1. Company Overview
- 12.1.3.2. Products
- 12.1.3.3. Company Financials
- 12.1.3.4. SWOT Analysis
- 12.1.4 Hodgson Mill
- 12.1.4.1. Company Overview
- 12.1.4.2. Products
- 12.1.4.3. Company Financials
- 12.1.4.4. SWOT Analysis
- 12.1.5 Kellogg
- 12.1.5.1. Company Overview
- 12.1.5.2. Products
- 12.1.5.3. Company Financials
- 12.1.5.4. SWOT Analysis
- 12.1.6 Allied Bakeries
- 12.1.6.1. Company Overview
- 12.1.6.2. Products
- 12.1.6.3. Company Financials
- 12.1.6.4. SWOT Analysis
- 12.1.7 Bob’s Red Mill Natural Foods
- 12.1.7.1. Company Overview
- 12.1.7.2. Products
- 12.1.7.3. Company Financials
- 12.1.7.4. SWOT Analysis
- 12.1.8 Food For Life
- 12.1.8.1. Company Overview
- 12.1.8.2. Products
- 12.1.8.3. Company Financials
- 12.1.8.4. SWOT Analysis
- 12.1.9 General Mills
- 12.1.9.1. Company Overview
- 12.1.9.2. Products
- 12.1.9.3. Company Financials
- 12.1.9.4. SWOT Analysis
- 12.1.10 Grain Millers
- 12.1.10.1. Company Overview
- 12.1.10.2. Products
- 12.1.10.3. Company Financials
- 12.1.10.4. SWOT Analysis
- 12.1.11 Mondelez International
- 12.1.11.1. Company Overview
- 12.1.11.2. Products
- 12.1.11.3. Company Financials
- 12.1.11.4. SWOT Analysis
- 12.1.12 Nestlé
- 12.1.12.1. Company Overview
- 12.1.12.2. Products
- 12.1.12.3. Company Financials
- 12.1.12.4. SWOT Analysis
- 12.1.13 Quaker Oats
- 12.1.13.1. Company Overview
- 12.1.13.2. Products
- 12.1.13.3. Company Financials
- 12.1.13.4. SWOT Analysis
- 12.1.1 Cargill
- 12.2. Market Entropy
- 12.2.1 Company's Key Areas Served
- 12.2.2 Recent Developments
- 12.3. Company Market Share Analysis 2025
- 12.3.1 Top 5 Companies Market Share Analysis
- 12.3.2 Top 3 Companies Market Share Analysis
- 12.4. List of Potential Customers
- 13. Research Methodology
List of Figures
- Figure 1: Global Whole Grain Foods Revenue Breakdown (billion, %) by Region 2025 & 2033
- Figure 2: North America Whole Grain Foods Revenue (billion), by Application 2025 & 2033
- Figure 3: North America Whole Grain Foods Revenue Share (%), by Application 2025 & 2033
- Figure 4: North America Whole Grain Foods Revenue (billion), by Type 2025 & 2033
- Figure 5: North America Whole Grain Foods Revenue Share (%), by Type 2025 & 2033
- Figure 6: North America Whole Grain Foods Revenue (billion), by Country 2025 & 2033
- Figure 7: North America Whole Grain Foods Revenue Share (%), by Country 2025 & 2033
- Figure 8: South America Whole Grain Foods Revenue (billion), by Application 2025 & 2033
- Figure 9: South America Whole Grain Foods Revenue Share (%), by Application 2025 & 2033
- Figure 10: South America Whole Grain Foods Revenue (billion), by Type 2025 & 2033
- Figure 11: South America Whole Grain Foods Revenue Share (%), by Type 2025 & 2033
- Figure 12: South America Whole Grain Foods Revenue (billion), by Country 2025 & 2033
- Figure 13: South America Whole Grain Foods Revenue Share (%), by Country 2025 & 2033
- Figure 14: Europe Whole Grain Foods Revenue (billion), by Application 2025 & 2033
- Figure 15: Europe Whole Grain Foods Revenue Share (%), by Application 2025 & 2033
- Figure 16: Europe Whole Grain Foods Revenue (billion), by Type 2025 & 2033
- Figure 17: Europe Whole Grain Foods Revenue Share (%), by Type 2025 & 2033
- Figure 18: Europe Whole Grain Foods Revenue (billion), by Country 2025 & 2033
- Figure 19: Europe Whole Grain Foods Revenue Share (%), by Country 2025 & 2033
- Figure 20: Middle East & Africa Whole Grain Foods Revenue (billion), by Application 2025 & 2033
- Figure 21: Middle East & Africa Whole Grain Foods Revenue Share (%), by Application 2025 & 2033
- Figure 22: Middle East & Africa Whole Grain Foods Revenue (billion), by Type 2025 & 2033
- Figure 23: Middle East & Africa Whole Grain Foods Revenue Share (%), by Type 2025 & 2033
- Figure 24: Middle East & Africa Whole Grain Foods Revenue (billion), by Country 2025 & 2033
- Figure 25: Middle East & Africa Whole Grain Foods Revenue Share (%), by Country 2025 & 2033
- Figure 26: Asia Pacific Whole Grain Foods Revenue (billion), by Application 2025 & 2033
- Figure 27: Asia Pacific Whole Grain Foods Revenue Share (%), by Application 2025 & 2033
- Figure 28: Asia Pacific Whole Grain Foods Revenue (billion), by Type 2025 & 2033
- Figure 29: Asia Pacific Whole Grain Foods Revenue Share (%), by Type 2025 & 2033
- Figure 30: Asia Pacific Whole Grain Foods Revenue (billion), by Country 2025 & 2033
- Figure 31: Asia Pacific Whole Grain Foods Revenue Share (%), by Country 2025 & 2033
List of Tables
- Table 1: Global Whole Grain Foods Revenue billion Forecast, by Application 2020 & 2033
- Table 2: Global Whole Grain Foods Revenue billion Forecast, by Type 2020 & 2033
- Table 3: Global Whole Grain Foods Revenue billion Forecast, by Region 2020 & 2033
- Table 4: Global Whole Grain Foods Revenue billion Forecast, by Application 2020 & 2033
- Table 5: Global Whole Grain Foods Revenue billion Forecast, by Type 2020 & 2033
- Table 6: Global Whole Grain Foods Revenue billion Forecast, by Country 2020 & 2033
- Table 7: United States Whole Grain Foods Revenue (billion) Forecast, by Application 2020 & 2033
- Table 8: Canada Whole Grain Foods Revenue (billion) Forecast, by Application 2020 & 2033
- Table 9: Mexico Whole Grain Foods Revenue (billion) Forecast, by Application 2020 & 2033
- Table 10: Global Whole Grain Foods Revenue billion Forecast, by Application 2020 & 2033
- Table 11: Global Whole Grain Foods Revenue billion Forecast, by Type 2020 & 2033
- Table 12: Global Whole Grain Foods Revenue billion Forecast, by Country 2020 & 2033
- Table 13: Brazil Whole Grain Foods Revenue (billion) Forecast, by Application 2020 & 2033
- Table 14: Argentina Whole Grain Foods Revenue (billion) Forecast, by Application 2020 & 2033
- Table 15: Rest of South America Whole Grain Foods Revenue (billion) Forecast, by Application 2020 & 2033
- Table 16: Global Whole Grain Foods Revenue billion Forecast, by Application 2020 & 2033
- Table 17: Global Whole Grain Foods Revenue billion Forecast, by Type 2020 & 2033
- Table 18: Global Whole Grain Foods Revenue billion Forecast, by Country 2020 & 2033
- Table 19: United Kingdom Whole Grain Foods Revenue (billion) Forecast, by Application 2020 & 2033
- Table 20: Germany Whole Grain Foods Revenue (billion) Forecast, by Application 2020 & 2033
- Table 21: France Whole Grain Foods Revenue (billion) Forecast, by Application 2020 & 2033
- Table 22: Italy Whole Grain Foods Revenue (billion) Forecast, by Application 2020 & 2033
- Table 23: Spain Whole Grain Foods Revenue (billion) Forecast, by Application 2020 & 2033
- Table 24: Russia Whole Grain Foods Revenue (billion) Forecast, by Application 2020 & 2033
- Table 25: Benelux Whole Grain Foods Revenue (billion) Forecast, by Application 2020 & 2033
- Table 26: Nordics Whole Grain Foods Revenue (billion) Forecast, by Application 2020 & 2033
- Table 27: Rest of Europe Whole Grain Foods Revenue (billion) Forecast, by Application 2020 & 2033
- Table 28: Global Whole Grain Foods Revenue billion Forecast, by Application 2020 & 2033
- Table 29: Global Whole Grain Foods Revenue billion Forecast, by Type 2020 & 2033
- Table 30: Global Whole Grain Foods Revenue billion Forecast, by Country 2020 & 2033
- Table 31: Turkey Whole Grain Foods Revenue (billion) Forecast, by Application 2020 & 2033
- Table 32: Israel Whole Grain Foods Revenue (billion) Forecast, by Application 2020 & 2033
- Table 33: GCC Whole Grain Foods Revenue (billion) Forecast, by Application 2020 & 2033
- Table 34: North Africa Whole Grain Foods Revenue (billion) Forecast, by Application 2020 & 2033
- Table 35: South Africa Whole Grain Foods Revenue (billion) Forecast, by Application 2020 & 2033
- Table 36: Rest of Middle East & Africa Whole Grain Foods Revenue (billion) Forecast, by Application 2020 & 2033
- Table 37: Global Whole Grain Foods Revenue billion Forecast, by Application 2020 & 2033
- Table 38: Global Whole Grain Foods Revenue billion Forecast, by Type 2020 & 2033
- Table 39: Global Whole Grain Foods Revenue billion Forecast, by Country 2020 & 2033
- Table 40: China Whole Grain Foods Revenue (billion) Forecast, by Application 2020 & 2033
- Table 41: India Whole Grain Foods Revenue (billion) Forecast, by Application 2020 & 2033
- Table 42: Japan Whole Grain Foods Revenue (billion) Forecast, by Application 2020 & 2033
- Table 43: South Korea Whole Grain Foods Revenue (billion) Forecast, by Application 2020 & 2033
- Table 44: ASEAN Whole Grain Foods Revenue (billion) Forecast, by Application 2020 & 2033
- Table 45: Oceania Whole Grain Foods Revenue (billion) Forecast, by Application 2020 & 2033
- Table 46: Rest of Asia Pacific Whole Grain Foods Revenue (billion) Forecast, by Application 2020 & 2033
Frequently Asked Questions
1. What is the projected Compound Annual Growth Rate (CAGR) of the Whole Grain Foods?
The projected CAGR is approximately 6.4%.
2. Which companies are prominent players in the Whole Grain Foods?
Key companies in the market include Cargill, Cereal Ingredients (CII), Flowers Foods, Hodgson Mill, Kellogg, Allied Bakeries, Bob’s Red Mill Natural Foods, Food For Life, General Mills, Grain Millers, Mondelez International, Nestlé, Quaker Oats.
3. What are the main segments of the Whole Grain Foods?
The market segments include Application, Type.
4. Can you provide details about the market size?
The market size is estimated to be USD 41.7 billion as of 2022.
5. What are some drivers contributing to market growth?
N/A
6. What are the notable trends driving market growth?
N/A
7. Are there any restraints impacting market growth?
N/A
8. Can you provide examples of recent developments in the market?
N/A
9. What pricing options are available for accessing the report?
Pricing options include single-user, multi-user, and enterprise licenses priced at USD 4250.00, USD 6375.00, and USD 8500.00 respectively.
10. Is the market size provided in terms of value or volume?
The market size is provided in terms of value, measured in billion.
11. Are there any specific market keywords associated with the report?
Yes, the market keyword associated with the report is "Whole Grain Foods," which aids in identifying and referencing the specific market segment covered.
12. How do I determine which pricing option suits my needs best?
The pricing options vary based on user requirements and access needs. Individual users may opt for single-user licenses, while businesses requiring broader access may choose multi-user or enterprise licenses for cost-effective access to the report.
13. Are there any additional resources or data provided in the Whole Grain Foods report?
While the report offers comprehensive insights, it's advisable to review the specific contents or supplementary materials provided to ascertain if additional resources or data are available.
14. How can I stay updated on further developments or reports in the Whole Grain Foods?
To stay informed about further developments, trends, and reports in the Whole Grain Foods, consider subscribing to industry newsletters, following relevant companies and organizations, or regularly checking reputable industry news sources and publications.
Methodology
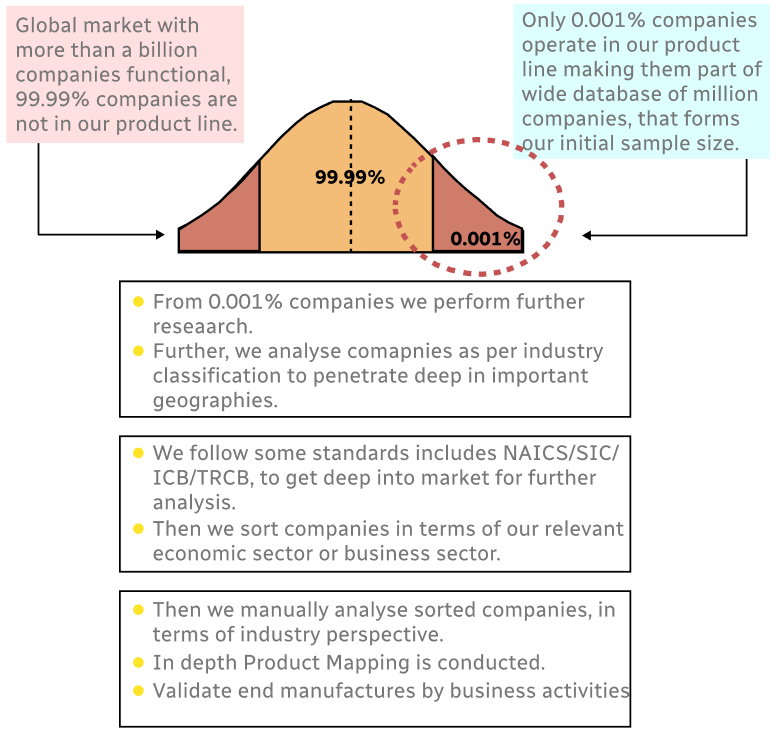
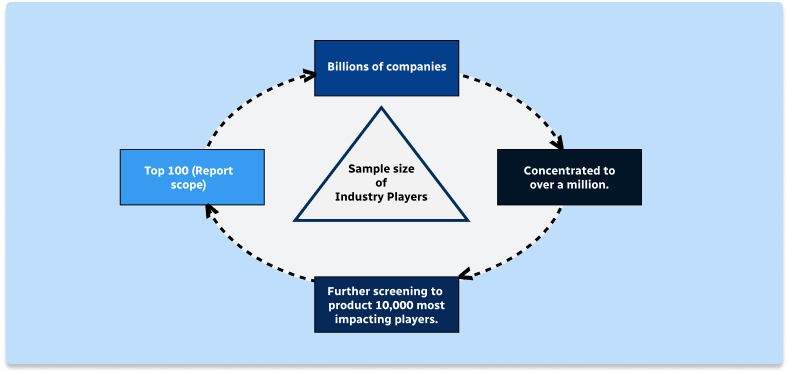
Step 1 - Identification of Relevant Samples Size from Population Database
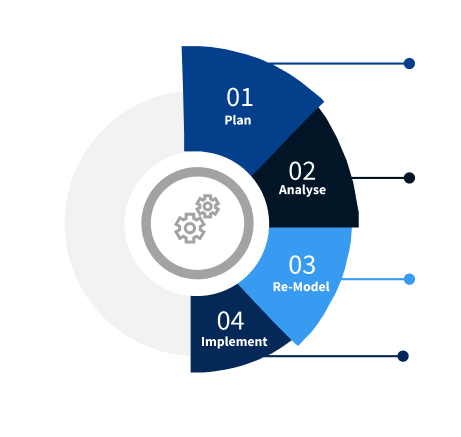
Step 2 - Approaches for Defining Global Market Size (Value, Volume* & Price*)
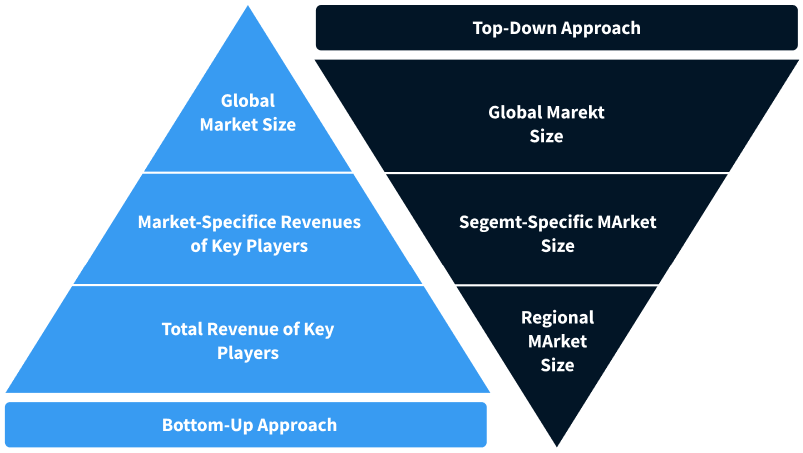
Note*: In applicable scenarios
Step 3 - Data Sources
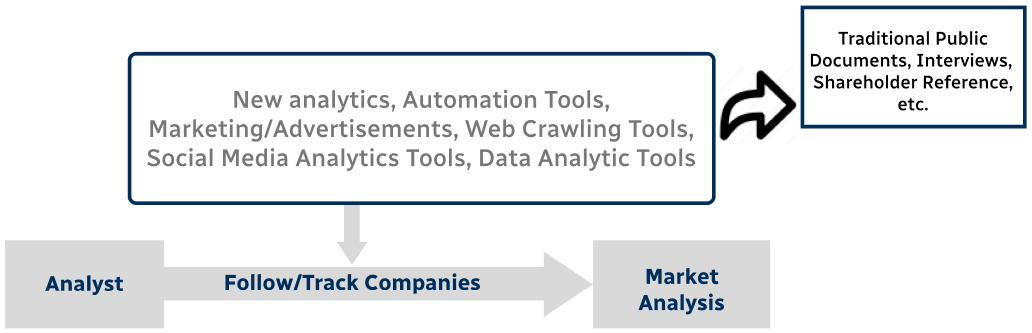
Primary Research
- Web Analytics
- Survey Reports
- Research Institute
- Latest Research Reports
- Opinion Leaders
Secondary Research
- Annual Reports
- White Paper
- Latest Press Release
- Industry Association
- Paid Database
- Investor Presentations
Step 4 - Data Triangulation
Involves using different sources of information in order to increase the validity of a study
These sources are likely to be stakeholders in a program - participants, other researchers, program staff, other community members, and so on.
Then we put all data in single framework & apply various statistical tools to find out the dynamic on the market.
During the analysis stage, feedback from the stakeholder groups would be compared to determine areas of agreement as well as areas of divergence