

Key Insights
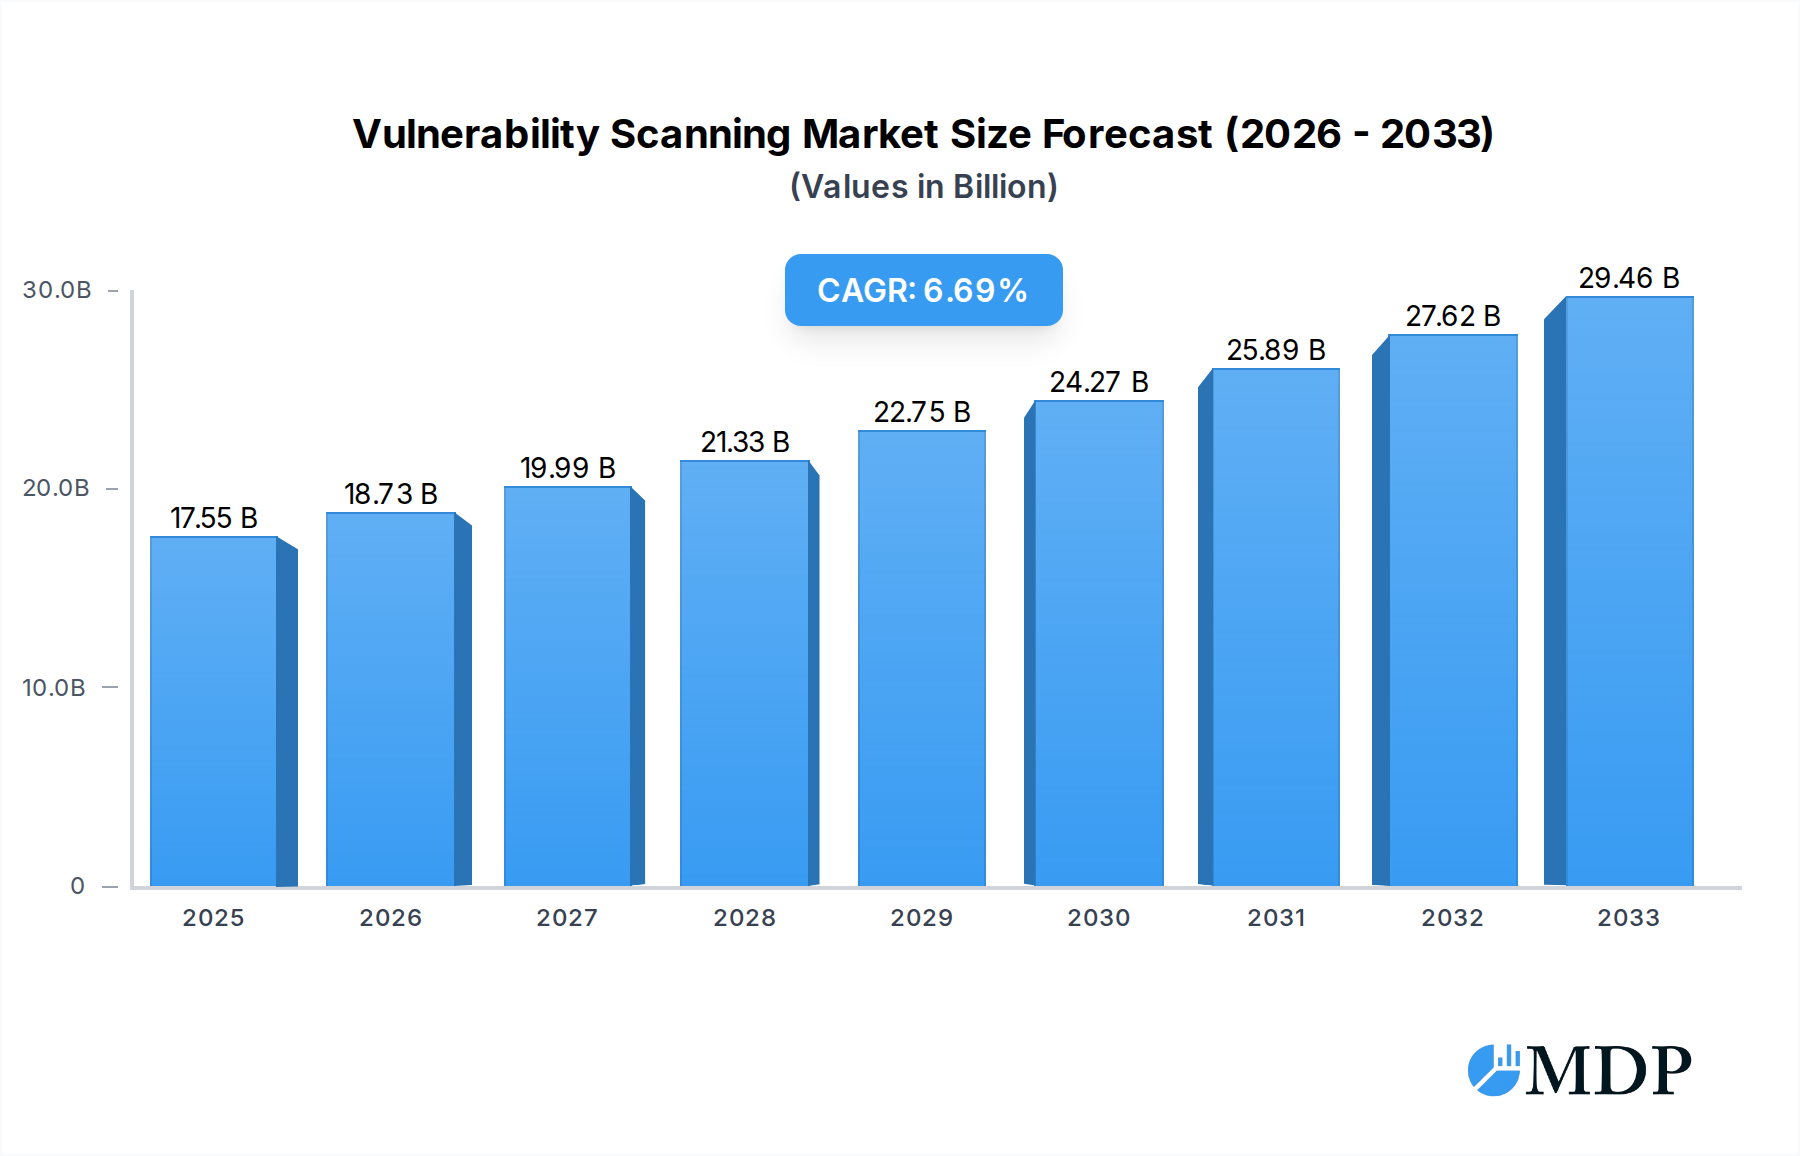
The global Vulnerability Scanning market is poised for significant expansion, projected to reach an estimated $17.55 billion in 2025, with a robust Compound Annual Growth Rate (CAGR) of 6.6%. This upward trajectory is primarily fueled by the escalating sophistication and frequency of cyber threats across all sectors. Organizations are increasingly recognizing vulnerability scanning not as a mere compliance checkbox, but as a critical component of a proactive cybersecurity strategy. The growing adoption of cloud computing, the proliferation of IoT devices, and the complex network infrastructures of modern enterprises present expanded attack surfaces, making continuous vulnerability assessment indispensable. Government mandates for data protection and the rising awareness of the financial and reputational damage from breaches further bolster market demand. Leading players like Symantec, IBM, Cisco, and Microsoft are driving innovation with advanced scanning technologies, including AI-powered anomaly detection and automated remediation capabilities, to address these evolving challenges.

Vulnerability Scanning Market Size (In Billion)
The market's growth is further propelled by the increasing digitization of critical sectors such as healthcare, finance, and defense, where data breaches can have catastrophic consequences. The demand for both software and hardware-based vulnerability scanning solutions is on the rise, catering to diverse organizational needs and deployment models. While the market exhibits strong growth, potential restraints include the high cost of implementing and maintaining advanced scanning solutions, particularly for small and medium-sized businesses, and the persistent shortage of skilled cybersecurity professionals capable of interpreting and acting upon scan results effectively. Nevertheless, the continuous evolution of cyberattack vectors and the imperative for robust security postures across industries, from telecommunications to aerospace, ensure a dynamic and expanding market for vulnerability scanning technologies and services throughout the forecast period.
Vulnerability Scanning Company Market Share
Unleash Robust Cybersecurity: Comprehensive Vulnerability Scanning Market Report (2019-2033)
This in-depth report provides a billion-dollar view of the global Vulnerability Scanning market, offering critical insights for cybersecurity professionals, IT decision-makers, and investment strategists. Covering the study period of 2019–2033, with a base year of 2025 and an estimated year of 2025, this analysis delves into the intricate dynamics, trends, and future trajectory of this vital cybersecurity segment. We dissect market concentration, innovation drivers, regulatory landscapes, and the evolving threat environment across key segments like Government, Education, Enterprise, Financial, Medical, Aerospace, Defense and Intelligence, and Telecommunication. Explore the dominance of Software Type and Hardware Type solutions, and understand the impact of industry developments shaped by leading companies including Symantec, Intel Security, IBM, Cisco, Trend Micro, Dell, Check Point, Juniper Networks, Kaspersky, Hewlett Packard, Microsoft, Huawei, Palo Alto Networks, FireEye, AT&T Cybersecurity, AVG Technologies, Fortinet, ESET, Venustech, H3C Technologies, NSFOCUS**. This report is your indispensable guide to navigating the *billion-dollar vulnerability scanning landscape*.
Vulnerability Scanning Market Dynamics & Concentration
The global vulnerability scanning market exhibits a moderate to high concentration, characterized by a few dominant players and a growing number of specialized vendors. Innovation remains a primary driver, fueled by the relentless evolution of cyber threats and the increasing sophistication of attack vectors. Regulatory frameworks, such as GDPR and CCPA, are increasingly mandating robust vulnerability management practices, bolstering market growth. Product substitutes, while existing in the form of manual assessments, are largely outpaced by the efficiency and scalability of automated scanning solutions. End-user trends show a clear shift towards continuous scanning, cloud-native security, and integrated vulnerability management platforms. Mergers and acquisitions (M&A) are prevalent as larger players seek to consolidate market share and acquire innovative technologies. We observed approximately several billion dollars in M&A deal counts during the historical period. The market share distribution reflects a dynamic competitive environment, with leading companies like Palo Alto Networks and Fortinet holding significant portions.
Vulnerability Scanning Industry Trends & Analysis
The vulnerability scanning industry is poised for substantial growth, driven by an ever-expanding attack surface and the critical need for proactive threat mitigation. Market growth drivers are multi-faceted, encompassing the escalating number of cyberattacks, the increasing adoption of cloud computing and IoT devices, and stringent regulatory compliance requirements. Technological disruptions are at the forefront, with the rise of AI and machine learning enabling more intelligent and adaptive scanning solutions, anomaly detection, and automated remediation. Consumer preferences are leaning towards comprehensive, integrated platforms that offer end-to-end vulnerability management, from discovery to remediation and reporting. The competitive dynamics are intense, with established giants and agile startups constantly innovating to offer advanced features and specialized solutions. The Compound Annual Growth Rate (CAGR) is projected to be in the range of several billion dollars, indicating robust expansion. Market penetration continues to deepen across all sectors, as organizations recognize vulnerability scanning not as a luxury but as a fundamental pillar of their cybersecurity posture. This trend is further amplified by the increasing digitalization of critical infrastructure and sensitive data across industries like Financial Services and Healthcare.
Leading Markets & Segments in Vulnerability Scanning
The Enterprise segment is the dominant force in the global vulnerability scanning market, driven by the sheer volume of digital assets and the critical need to protect sensitive corporate data. Within this segment, Software Type solutions command the largest market share, owing to their scalability, flexibility, and adaptability to diverse IT environments. The Financial sector also represents a significant and rapidly growing market, propelled by stringent regulatory mandates and the high stakes associated with financial data breaches.
- Dominant Region Analysis: North America leads the market due to its advanced technological infrastructure, high cybersecurity spending, and the presence of numerous large enterprises and financial institutions. The stringent regulatory landscape and a proactive approach to cybersecurity further solidify its dominance.
- Key Drivers of Dominance in Enterprise & Financial Segments:
- Economic Policies: Government initiatives and incentives promoting cybersecurity adoption.
- Infrastructure: Widespread adoption of cloud, hybrid, and multi-cloud environments requiring comprehensive security.
- Regulatory Frameworks: Strict compliance demands from bodies like the SEC, PCI DSS, and FINRA.
- Threat Landscape: The continuous barrage of sophisticated cyberattacks targeting valuable financial and corporate data.
- Telecommunication Segment Growth: The telecommunication sector is emerging as a significant growth engine, driven by the expansion of 5G networks and the increased complexity of their IT infrastructure, necessitating robust vulnerability management.
- Types Dominance:
- Software Type: Offers unparalleled flexibility for network scanning, application security testing, and cloud security posture management. These solutions are easily deployable, scalable, and can be integrated with existing security tools.
- Hardware Type: Primarily used for dedicated network appliance-based scanning, offering high performance and specialized security functions for critical network perimeters.
Vulnerability Scanning Product Developments
Recent product developments in vulnerability scanning are focused on intelligent automation, cloud-native security, and comprehensive risk management. Innovations include AI-powered threat detection, which moves beyond signature-based scanning to identify novel vulnerabilities and zero-day exploits. Cloud security posture management (CSPM) tools are evolving to provide continuous visibility and compliance in dynamic cloud environments. Furthermore, the integration of vulnerability data with threat intelligence feeds and security orchestration, automation, and response (SOAR) platforms is creating a more unified and efficient approach to cybersecurity. Competitive advantages are increasingly derived from the ability to provide actionable insights, reduce false positives, and offer seamless integration across the entire security ecosystem, ensuring rapid and effective remediation.
Key Drivers of Vulnerability Scanning Growth
The vulnerability scanning market is experiencing robust growth driven by several key factors. The escalating frequency and sophistication of cyber threats globally necessitate proactive identification and mitigation of security weaknesses. Increasing regulatory compliance mandates across industries, such as HIPAA and GDPR, are compelling organizations to invest in comprehensive vulnerability management solutions. The rapid adoption of cloud computing and the proliferation of IoT devices have expanded the attack surface, creating a critical need for continuous scanning and monitoring. Furthermore, advancements in AI and machine learning are enhancing the accuracy and efficiency of scanning tools, making them more indispensable for modern cybersecurity strategies.
Challenges in the Vulnerability Scanning Market
Despite significant growth, the vulnerability scanning market faces several challenges. The sheer volume of vulnerabilities discovered can overwhelm security teams, leading to "alert fatigue" and difficulties in prioritization. The complexity of modern IT infrastructures, including hybrid cloud environments and legacy systems, can make comprehensive scanning challenging. Competitive pressures and pricing wars among vendors can impact profitability. Furthermore, the shortage of skilled cybersecurity professionals to effectively manage and interpret scanning results remains a significant barrier. Supply chain issues for hardware-based scanning solutions can also cause delays.
Emerging Opportunities in Vulnerability Scanning
Emerging opportunities in the vulnerability scanning market are abundant, driven by technological advancements and evolving security needs. The growing demand for managed security services (MSSPs) for vulnerability management presents a significant avenue for growth. The expansion of DevSecOps practices is creating a market for integrated security testing tools that can be embedded within the software development lifecycle. Furthermore, the increasing focus on OT (Operational Technology) security in critical infrastructure opens up new markets for specialized industrial vulnerability scanning solutions. Strategic partnerships between vulnerability scanning vendors and cloud providers, as well as threat intelligence firms, are poised to enhance product offerings and market reach.
Leading Players in the Vulnerability Scanning Sector
- Palo Alto Networks
- Fortinet
- Cisco
- IBM
- Microsoft
- Trend Micro
- Intel Security
- Symantec
- Check Point
- Juniper Networks
- Kaspersky
- Hewlett Packard
- Huawei
- FireEye
- AT&T Cybersecurity
- AVG Technologies
- ESET
- Venustech
- H3C Technologies
- NSFOCUS
- Dell
Key Milestones in Vulnerability Scanning Industry
- 2019: Increased adoption of AI/ML in vulnerability detection tools.
- 2020: Significant rise in cloud-based vulnerability scanning solutions due to remote work trends.
- 2021: Enhanced focus on API security vulnerability scanning.
- 2022: Integration of vulnerability management with SOAR platforms gains momentum.
- 2023: Emergence of specialized OT security vulnerability scanning.
- 2024: Increased M&A activity as larger players consolidate offerings.
Strategic Outlook for Vulnerability Scanning Market
The strategic outlook for the vulnerability scanning market remains exceptionally positive. Future growth will be accelerated by the ongoing digital transformation across all sectors, demanding more sophisticated and continuous security assessments. The increasing adoption of AI and automation will drive the development of proactive and predictive vulnerability management capabilities. Strategic opportunities lie in expanding into emerging markets, developing specialized solutions for niche industries, and fostering stronger integrations with the broader cybersecurity ecosystem. Continued investment in research and development will be crucial for vendors to stay ahead of the evolving threat landscape and maintain their competitive edge in this dynamic billion-dollar industry.
Vulnerability Scanning Segmentation
-
1. Application
- 1.1. Government
- 1.2. Education
- 1.3. Enterprise
- 1.4. Financial
- 1.5. Medical
- 1.6. Aerospace, Defense and Intelligence
- 1.7. Telecommunication
- 1.8. Others
-
2. Types
- 2.1. Software Type
- 2.2. Hardware Type
Vulnerability Scanning Segmentation By Geography
-
1. North America
- 1.1. United States
- 1.2. Canada
- 1.3. Mexico
-
2. South America
- 2.1. Brazil
- 2.2. Argentina
- 2.3. Rest of South America
-
3. Europe
- 3.1. United Kingdom
- 3.2. Germany
- 3.3. France
- 3.4. Italy
- 3.5. Spain
- 3.6. Russia
- 3.7. Benelux
- 3.8. Nordics
- 3.9. Rest of Europe
-
4. Middle East & Africa
- 4.1. Turkey
- 4.2. Israel
- 4.3. GCC
- 4.4. North Africa
- 4.5. South Africa
- 4.6. Rest of Middle East & Africa
-
5. Asia Pacific
- 5.1. China
- 5.2. India
- 5.3. Japan
- 5.4. South Korea
- 5.5. ASEAN
- 5.6. Oceania
- 5.7. Rest of Asia Pacific
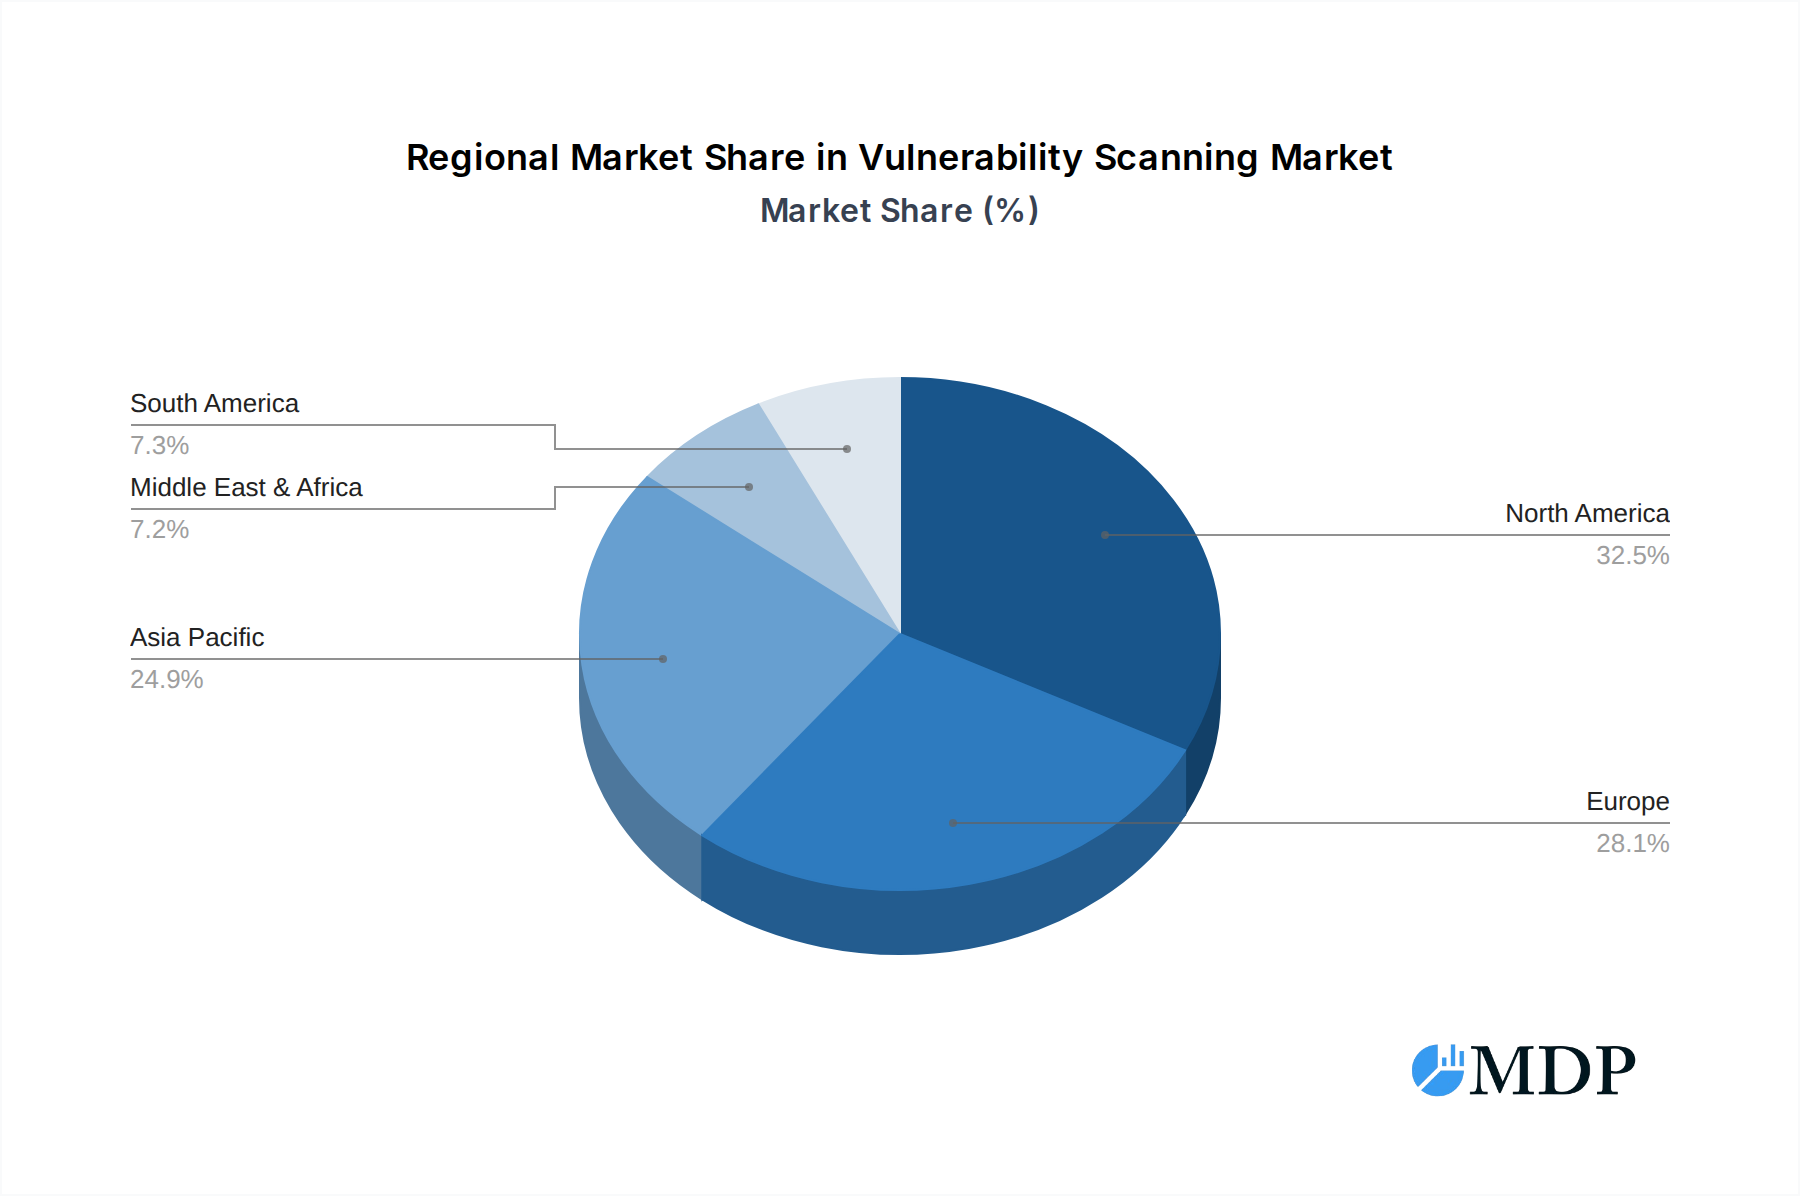
Vulnerability Scanning Regional Market Share
Geographic Coverage of Vulnerability Scanning
Vulnerability Scanning REPORT HIGHLIGHTS
| Aspects | Details |
|---|---|
| Study Period | 2020-2034 |
| Base Year | 2025 |
| Estimated Year | 2026 |
| Forecast Period | 2026-2034 |
| Historical Period | 2020-2025 |
| Growth Rate | CAGR of 6.6% from 2020-2034 |
| Segmentation |
|
Table of Contents
- 1. Introduction
- 1.1. Research Scope
- 1.2. Market Segmentation
- 1.3. Research Methodology
- 1.4. Definitions and Assumptions
- 2. Executive Summary
- 2.1. Introduction
- 3. Market Dynamics
- 3.1. Introduction
- 3.2. Market Drivers
- 3.3. Market Restrains
- 3.4. Market Trends
- 4. Market Factor Analysis
- 4.1. Porters Five Forces
- 4.2. Supply/Value Chain
- 4.3. PESTEL analysis
- 4.4. Market Entropy
- 4.5. Patent/Trademark Analysis
- 5. Global Vulnerability Scanning Analysis, Insights and Forecast, 2020-2032
- 5.1. Market Analysis, Insights and Forecast - by Application
- 5.1.1. Government
- 5.1.2. Education
- 5.1.3. Enterprise
- 5.1.4. Financial
- 5.1.5. Medical
- 5.1.6. Aerospace, Defense and Intelligence
- 5.1.7. Telecommunication
- 5.1.8. Others
- 5.2. Market Analysis, Insights and Forecast - by Types
- 5.2.1. Software Type
- 5.2.2. Hardware Type
- 5.3. Market Analysis, Insights and Forecast - by Region
- 5.3.1. North America
- 5.3.2. South America
- 5.3.3. Europe
- 5.3.4. Middle East & Africa
- 5.3.5. Asia Pacific
- 5.1. Market Analysis, Insights and Forecast - by Application
- 6. North America Vulnerability Scanning Analysis, Insights and Forecast, 2020-2032
- 6.1. Market Analysis, Insights and Forecast - by Application
- 6.1.1. Government
- 6.1.2. Education
- 6.1.3. Enterprise
- 6.1.4. Financial
- 6.1.5. Medical
- 6.1.6. Aerospace, Defense and Intelligence
- 6.1.7. Telecommunication
- 6.1.8. Others
- 6.2. Market Analysis, Insights and Forecast - by Types
- 6.2.1. Software Type
- 6.2.2. Hardware Type
- 6.1. Market Analysis, Insights and Forecast - by Application
- 7. South America Vulnerability Scanning Analysis, Insights and Forecast, 2020-2032
- 7.1. Market Analysis, Insights and Forecast - by Application
- 7.1.1. Government
- 7.1.2. Education
- 7.1.3. Enterprise
- 7.1.4. Financial
- 7.1.5. Medical
- 7.1.6. Aerospace, Defense and Intelligence
- 7.1.7. Telecommunication
- 7.1.8. Others
- 7.2. Market Analysis, Insights and Forecast - by Types
- 7.2.1. Software Type
- 7.2.2. Hardware Type
- 7.1. Market Analysis, Insights and Forecast - by Application
- 8. Europe Vulnerability Scanning Analysis, Insights and Forecast, 2020-2032
- 8.1. Market Analysis, Insights and Forecast - by Application
- 8.1.1. Government
- 8.1.2. Education
- 8.1.3. Enterprise
- 8.1.4. Financial
- 8.1.5. Medical
- 8.1.6. Aerospace, Defense and Intelligence
- 8.1.7. Telecommunication
- 8.1.8. Others
- 8.2. Market Analysis, Insights and Forecast - by Types
- 8.2.1. Software Type
- 8.2.2. Hardware Type
- 8.1. Market Analysis, Insights and Forecast - by Application
- 9. Middle East & Africa Vulnerability Scanning Analysis, Insights and Forecast, 2020-2032
- 9.1. Market Analysis, Insights and Forecast - by Application
- 9.1.1. Government
- 9.1.2. Education
- 9.1.3. Enterprise
- 9.1.4. Financial
- 9.1.5. Medical
- 9.1.6. Aerospace, Defense and Intelligence
- 9.1.7. Telecommunication
- 9.1.8. Others
- 9.2. Market Analysis, Insights and Forecast - by Types
- 9.2.1. Software Type
- 9.2.2. Hardware Type
- 9.1. Market Analysis, Insights and Forecast - by Application
- 10. Asia Pacific Vulnerability Scanning Analysis, Insights and Forecast, 2020-2032
- 10.1. Market Analysis, Insights and Forecast - by Application
- 10.1.1. Government
- 10.1.2. Education
- 10.1.3. Enterprise
- 10.1.4. Financial
- 10.1.5. Medical
- 10.1.6. Aerospace, Defense and Intelligence
- 10.1.7. Telecommunication
- 10.1.8. Others
- 10.2. Market Analysis, Insights and Forecast - by Types
- 10.2.1. Software Type
- 10.2.2. Hardware Type
- 10.1. Market Analysis, Insights and Forecast - by Application
- 11. Competitive Analysis
- 11.1. Global Market Share Analysis 2025
- 11.2. Company Profiles
- 11.2.1 Symantec
- 11.2.1.1. Overview
- 11.2.1.2. Products
- 11.2.1.3. SWOT Analysis
- 11.2.1.4. Recent Developments
- 11.2.1.5. Financials (Based on Availability)
- 11.2.2 Intel Security
- 11.2.2.1. Overview
- 11.2.2.2. Products
- 11.2.2.3. SWOT Analysis
- 11.2.2.4. Recent Developments
- 11.2.2.5. Financials (Based on Availability)
- 11.2.3 IBM
- 11.2.3.1. Overview
- 11.2.3.2. Products
- 11.2.3.3. SWOT Analysis
- 11.2.3.4. Recent Developments
- 11.2.3.5. Financials (Based on Availability)
- 11.2.4 Cisco
- 11.2.4.1. Overview
- 11.2.4.2. Products
- 11.2.4.3. SWOT Analysis
- 11.2.4.4. Recent Developments
- 11.2.4.5. Financials (Based on Availability)
- 11.2.5 Trend Micro
- 11.2.5.1. Overview
- 11.2.5.2. Products
- 11.2.5.3. SWOT Analysis
- 11.2.5.4. Recent Developments
- 11.2.5.5. Financials (Based on Availability)
- 11.2.6 Dell
- 11.2.6.1. Overview
- 11.2.6.2. Products
- 11.2.6.3. SWOT Analysis
- 11.2.6.4. Recent Developments
- 11.2.6.5. Financials (Based on Availability)
- 11.2.7 Check Point
- 11.2.7.1. Overview
- 11.2.7.2. Products
- 11.2.7.3. SWOT Analysis
- 11.2.7.4. Recent Developments
- 11.2.7.5. Financials (Based on Availability)
- 11.2.8 Juniper Networks
- 11.2.8.1. Overview
- 11.2.8.2. Products
- 11.2.8.3. SWOT Analysis
- 11.2.8.4. Recent Developments
- 11.2.8.5. Financials (Based on Availability)
- 11.2.9 Kaspersky
- 11.2.9.1. Overview
- 11.2.9.2. Products
- 11.2.9.3. SWOT Analysis
- 11.2.9.4. Recent Developments
- 11.2.9.5. Financials (Based on Availability)
- 11.2.10 Hewlett Packard
- 11.2.10.1. Overview
- 11.2.10.2. Products
- 11.2.10.3. SWOT Analysis
- 11.2.10.4. Recent Developments
- 11.2.10.5. Financials (Based on Availability)
- 11.2.11 Microsoft
- 11.2.11.1. Overview
- 11.2.11.2. Products
- 11.2.11.3. SWOT Analysis
- 11.2.11.4. Recent Developments
- 11.2.11.5. Financials (Based on Availability)
- 11.2.12 Huawei
- 11.2.12.1. Overview
- 11.2.12.2. Products
- 11.2.12.3. SWOT Analysis
- 11.2.12.4. Recent Developments
- 11.2.12.5. Financials (Based on Availability)
- 11.2.13 Palo Alto Networks
- 11.2.13.1. Overview
- 11.2.13.2. Products
- 11.2.13.3. SWOT Analysis
- 11.2.13.4. Recent Developments
- 11.2.13.5. Financials (Based on Availability)
- 11.2.14 FireEye
- 11.2.14.1. Overview
- 11.2.14.2. Products
- 11.2.14.3. SWOT Analysis
- 11.2.14.4. Recent Developments
- 11.2.14.5. Financials (Based on Availability)
- 11.2.15 AT&T Cybersecurity
- 11.2.15.1. Overview
- 11.2.15.2. Products
- 11.2.15.3. SWOT Analysis
- 11.2.15.4. Recent Developments
- 11.2.15.5. Financials (Based on Availability)
- 11.2.16 AVG Technologies
- 11.2.16.1. Overview
- 11.2.16.2. Products
- 11.2.16.3. SWOT Analysis
- 11.2.16.4. Recent Developments
- 11.2.16.5. Financials (Based on Availability)
- 11.2.17 Fortinet
- 11.2.17.1. Overview
- 11.2.17.2. Products
- 11.2.17.3. SWOT Analysis
- 11.2.17.4. Recent Developments
- 11.2.17.5. Financials (Based on Availability)
- 11.2.18 ESET
- 11.2.18.1. Overview
- 11.2.18.2. Products
- 11.2.18.3. SWOT Analysis
- 11.2.18.4. Recent Developments
- 11.2.18.5. Financials (Based on Availability)
- 11.2.19 Venustech
- 11.2.19.1. Overview
- 11.2.19.2. Products
- 11.2.19.3. SWOT Analysis
- 11.2.19.4. Recent Developments
- 11.2.19.5. Financials (Based on Availability)
- 11.2.20 H3C Technologies
- 11.2.20.1. Overview
- 11.2.20.2. Products
- 11.2.20.3. SWOT Analysis
- 11.2.20.4. Recent Developments
- 11.2.20.5. Financials (Based on Availability)
- 11.2.21 NSFOCUS
- 11.2.21.1. Overview
- 11.2.21.2. Products
- 11.2.21.3. SWOT Analysis
- 11.2.21.4. Recent Developments
- 11.2.21.5. Financials (Based on Availability)
- 11.2.1 Symantec
List of Figures
- Figure 1: Global Vulnerability Scanning Revenue Breakdown (undefined, %) by Region 2025 & 2033
- Figure 2: North America Vulnerability Scanning Revenue (undefined), by Application 2025 & 2033
- Figure 3: North America Vulnerability Scanning Revenue Share (%), by Application 2025 & 2033
- Figure 4: North America Vulnerability Scanning Revenue (undefined), by Types 2025 & 2033
- Figure 5: North America Vulnerability Scanning Revenue Share (%), by Types 2025 & 2033
- Figure 6: North America Vulnerability Scanning Revenue (undefined), by Country 2025 & 2033
- Figure 7: North America Vulnerability Scanning Revenue Share (%), by Country 2025 & 2033
- Figure 8: South America Vulnerability Scanning Revenue (undefined), by Application 2025 & 2033
- Figure 9: South America Vulnerability Scanning Revenue Share (%), by Application 2025 & 2033
- Figure 10: South America Vulnerability Scanning Revenue (undefined), by Types 2025 & 2033
- Figure 11: South America Vulnerability Scanning Revenue Share (%), by Types 2025 & 2033
- Figure 12: South America Vulnerability Scanning Revenue (undefined), by Country 2025 & 2033
- Figure 13: South America Vulnerability Scanning Revenue Share (%), by Country 2025 & 2033
- Figure 14: Europe Vulnerability Scanning Revenue (undefined), by Application 2025 & 2033
- Figure 15: Europe Vulnerability Scanning Revenue Share (%), by Application 2025 & 2033
- Figure 16: Europe Vulnerability Scanning Revenue (undefined), by Types 2025 & 2033
- Figure 17: Europe Vulnerability Scanning Revenue Share (%), by Types 2025 & 2033
- Figure 18: Europe Vulnerability Scanning Revenue (undefined), by Country 2025 & 2033
- Figure 19: Europe Vulnerability Scanning Revenue Share (%), by Country 2025 & 2033
- Figure 20: Middle East & Africa Vulnerability Scanning Revenue (undefined), by Application 2025 & 2033
- Figure 21: Middle East & Africa Vulnerability Scanning Revenue Share (%), by Application 2025 & 2033
- Figure 22: Middle East & Africa Vulnerability Scanning Revenue (undefined), by Types 2025 & 2033
- Figure 23: Middle East & Africa Vulnerability Scanning Revenue Share (%), by Types 2025 & 2033
- Figure 24: Middle East & Africa Vulnerability Scanning Revenue (undefined), by Country 2025 & 2033
- Figure 25: Middle East & Africa Vulnerability Scanning Revenue Share (%), by Country 2025 & 2033
- Figure 26: Asia Pacific Vulnerability Scanning Revenue (undefined), by Application 2025 & 2033
- Figure 27: Asia Pacific Vulnerability Scanning Revenue Share (%), by Application 2025 & 2033
- Figure 28: Asia Pacific Vulnerability Scanning Revenue (undefined), by Types 2025 & 2033
- Figure 29: Asia Pacific Vulnerability Scanning Revenue Share (%), by Types 2025 & 2033
- Figure 30: Asia Pacific Vulnerability Scanning Revenue (undefined), by Country 2025 & 2033
- Figure 31: Asia Pacific Vulnerability Scanning Revenue Share (%), by Country 2025 & 2033
List of Tables
- Table 1: Global Vulnerability Scanning Revenue undefined Forecast, by Application 2020 & 2033
- Table 2: Global Vulnerability Scanning Revenue undefined Forecast, by Types 2020 & 2033
- Table 3: Global Vulnerability Scanning Revenue undefined Forecast, by Region 2020 & 2033
- Table 4: Global Vulnerability Scanning Revenue undefined Forecast, by Application 2020 & 2033
- Table 5: Global Vulnerability Scanning Revenue undefined Forecast, by Types 2020 & 2033
- Table 6: Global Vulnerability Scanning Revenue undefined Forecast, by Country 2020 & 2033
- Table 7: United States Vulnerability Scanning Revenue (undefined) Forecast, by Application 2020 & 2033
- Table 8: Canada Vulnerability Scanning Revenue (undefined) Forecast, by Application 2020 & 2033
- Table 9: Mexico Vulnerability Scanning Revenue (undefined) Forecast, by Application 2020 & 2033
- Table 10: Global Vulnerability Scanning Revenue undefined Forecast, by Application 2020 & 2033
- Table 11: Global Vulnerability Scanning Revenue undefined Forecast, by Types 2020 & 2033
- Table 12: Global Vulnerability Scanning Revenue undefined Forecast, by Country 2020 & 2033
- Table 13: Brazil Vulnerability Scanning Revenue (undefined) Forecast, by Application 2020 & 2033
- Table 14: Argentina Vulnerability Scanning Revenue (undefined) Forecast, by Application 2020 & 2033
- Table 15: Rest of South America Vulnerability Scanning Revenue (undefined) Forecast, by Application 2020 & 2033
- Table 16: Global Vulnerability Scanning Revenue undefined Forecast, by Application 2020 & 2033
- Table 17: Global Vulnerability Scanning Revenue undefined Forecast, by Types 2020 & 2033
- Table 18: Global Vulnerability Scanning Revenue undefined Forecast, by Country 2020 & 2033
- Table 19: United Kingdom Vulnerability Scanning Revenue (undefined) Forecast, by Application 2020 & 2033
- Table 20: Germany Vulnerability Scanning Revenue (undefined) Forecast, by Application 2020 & 2033
- Table 21: France Vulnerability Scanning Revenue (undefined) Forecast, by Application 2020 & 2033
- Table 22: Italy Vulnerability Scanning Revenue (undefined) Forecast, by Application 2020 & 2033
- Table 23: Spain Vulnerability Scanning Revenue (undefined) Forecast, by Application 2020 & 2033
- Table 24: Russia Vulnerability Scanning Revenue (undefined) Forecast, by Application 2020 & 2033
- Table 25: Benelux Vulnerability Scanning Revenue (undefined) Forecast, by Application 2020 & 2033
- Table 26: Nordics Vulnerability Scanning Revenue (undefined) Forecast, by Application 2020 & 2033
- Table 27: Rest of Europe Vulnerability Scanning Revenue (undefined) Forecast, by Application 2020 & 2033
- Table 28: Global Vulnerability Scanning Revenue undefined Forecast, by Application 2020 & 2033
- Table 29: Global Vulnerability Scanning Revenue undefined Forecast, by Types 2020 & 2033
- Table 30: Global Vulnerability Scanning Revenue undefined Forecast, by Country 2020 & 2033
- Table 31: Turkey Vulnerability Scanning Revenue (undefined) Forecast, by Application 2020 & 2033
- Table 32: Israel Vulnerability Scanning Revenue (undefined) Forecast, by Application 2020 & 2033
- Table 33: GCC Vulnerability Scanning Revenue (undefined) Forecast, by Application 2020 & 2033
- Table 34: North Africa Vulnerability Scanning Revenue (undefined) Forecast, by Application 2020 & 2033
- Table 35: South Africa Vulnerability Scanning Revenue (undefined) Forecast, by Application 2020 & 2033
- Table 36: Rest of Middle East & Africa Vulnerability Scanning Revenue (undefined) Forecast, by Application 2020 & 2033
- Table 37: Global Vulnerability Scanning Revenue undefined Forecast, by Application 2020 & 2033
- Table 38: Global Vulnerability Scanning Revenue undefined Forecast, by Types 2020 & 2033
- Table 39: Global Vulnerability Scanning Revenue undefined Forecast, by Country 2020 & 2033
- Table 40: China Vulnerability Scanning Revenue (undefined) Forecast, by Application 2020 & 2033
- Table 41: India Vulnerability Scanning Revenue (undefined) Forecast, by Application 2020 & 2033
- Table 42: Japan Vulnerability Scanning Revenue (undefined) Forecast, by Application 2020 & 2033
- Table 43: South Korea Vulnerability Scanning Revenue (undefined) Forecast, by Application 2020 & 2033
- Table 44: ASEAN Vulnerability Scanning Revenue (undefined) Forecast, by Application 2020 & 2033
- Table 45: Oceania Vulnerability Scanning Revenue (undefined) Forecast, by Application 2020 & 2033
- Table 46: Rest of Asia Pacific Vulnerability Scanning Revenue (undefined) Forecast, by Application 2020 & 2033
Frequently Asked Questions
1. What is the projected Compound Annual Growth Rate (CAGR) of the Vulnerability Scanning?
The projected CAGR is approximately 6.6%.
2. Which companies are prominent players in the Vulnerability Scanning?
Key companies in the market include Symantec, Intel Security, IBM, Cisco, Trend Micro, Dell, Check Point, Juniper Networks, Kaspersky, Hewlett Packard, Microsoft, Huawei, Palo Alto Networks, FireEye, AT&T Cybersecurity, AVG Technologies, Fortinet, ESET, Venustech, H3C Technologies, NSFOCUS.
3. What are the main segments of the Vulnerability Scanning?
The market segments include Application, Types.
4. Can you provide details about the market size?
The market size is estimated to be USD XXX N/A as of 2022.
5. What are some drivers contributing to market growth?
N/A
6. What are the notable trends driving market growth?
N/A
7. Are there any restraints impacting market growth?
N/A
8. Can you provide examples of recent developments in the market?
N/A
9. What pricing options are available for accessing the report?
Pricing options include single-user, multi-user, and enterprise licenses priced at USD 2900.00, USD 4350.00, and USD 5800.00 respectively.
10. Is the market size provided in terms of value or volume?
The market size is provided in terms of value, measured in N/A.
11. Are there any specific market keywords associated with the report?
Yes, the market keyword associated with the report is "Vulnerability Scanning," which aids in identifying and referencing the specific market segment covered.
12. How do I determine which pricing option suits my needs best?
The pricing options vary based on user requirements and access needs. Individual users may opt for single-user licenses, while businesses requiring broader access may choose multi-user or enterprise licenses for cost-effective access to the report.
13. Are there any additional resources or data provided in the Vulnerability Scanning report?
While the report offers comprehensive insights, it's advisable to review the specific contents or supplementary materials provided to ascertain if additional resources or data are available.
14. How can I stay updated on further developments or reports in the Vulnerability Scanning?
To stay informed about further developments, trends, and reports in the Vulnerability Scanning, consider subscribing to industry newsletters, following relevant companies and organizations, or regularly checking reputable industry news sources and publications.
Methodology
Step 1 - Identification of Relevant Samples Size from Population Database


Step 2 - Approaches for Defining Global Market Size (Value, Volume* & Price*)

Note*: In applicable scenarios
Step 3 - Data Sources
Primary Research
- Web Analytics
- Survey Reports
- Research Institute
- Latest Research Reports
- Opinion Leaders
Secondary Research
- Annual Reports
- White Paper
- Latest Press Release
- Industry Association
- Paid Database
- Investor Presentations

Step 4 - Data Triangulation
Involves using different sources of information in order to increase the validity of a study
These sources are likely to be stakeholders in a program - participants, other researchers, program staff, other community members, and so on.
Then we put all data in single framework & apply various statistical tools to find out the dynamic on the market.
During the analysis stage, feedback from the stakeholder groups would be compared to determine areas of agreement as well as areas of divergence