

Key Insights
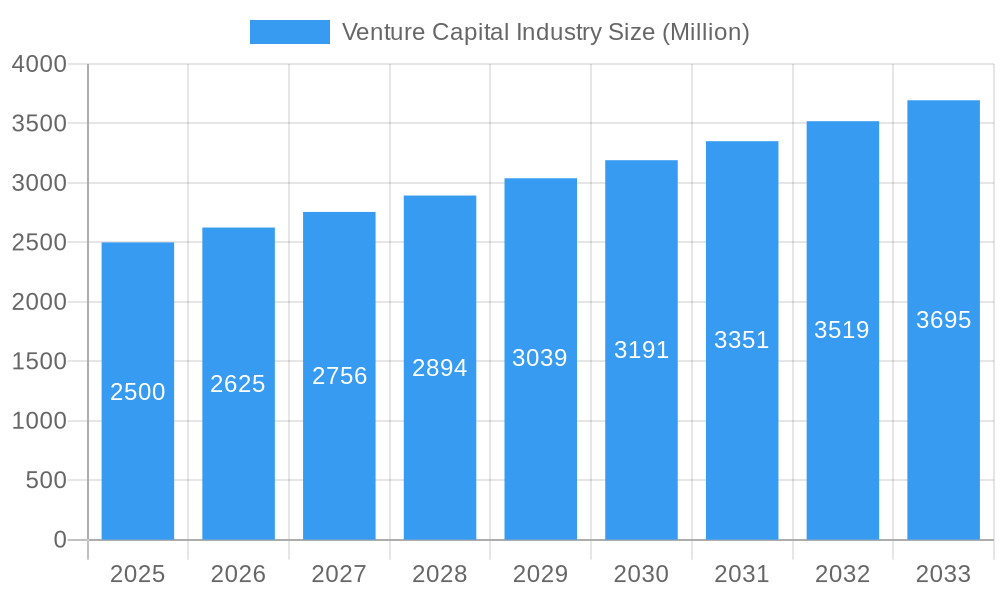
The venture capital (VC) industry is experiencing robust growth, with a Compound Annual Growth Rate (CAGR) exceeding 5% from 2019 to 2033. This expansion is driven by several factors, including the increasing number of high-growth startups across various sectors like technology, healthcare, and renewable energy. The rise of digital transformation and technological advancements continues to fuel innovation, creating lucrative opportunities for VC investments. Furthermore, a favorable regulatory environment in many regions, coupled with readily available capital from both institutional and individual investors, is contributing to the industry's expansion. Leading VC firms such as Tiger Global Management, Sequoia Capital, and others actively seek and invest in promising ventures, further stimulating market activity. While competition among VC firms is intense, the overall market demonstrates resilience, with continued strong demand from entrepreneurs seeking funding and expansion opportunities.
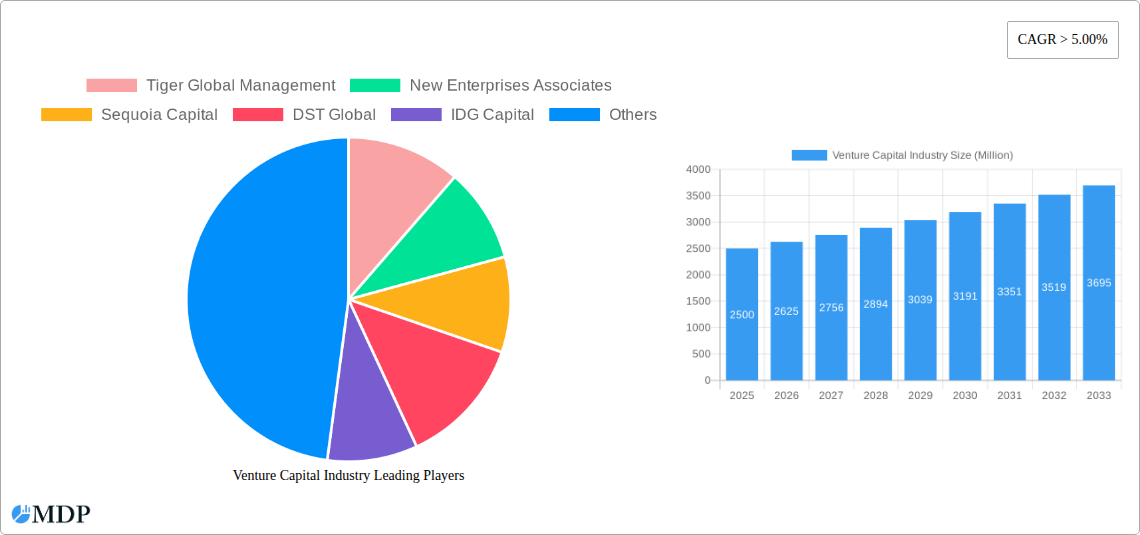
Venture Capital Industry Market Size (In Billion)
However, the VC industry also faces challenges. Economic downturns can significantly impact investment activity, leading to reduced funding rounds and decreased valuations. Geopolitical instability and regulatory changes can also create uncertainty. Furthermore, the high-risk nature of VC investments means that not all ventures succeed, leading to potential losses for investors. The increasing focus on environmental, social, and governance (ESG) factors is also influencing investment decisions, pushing VCs to consider the long-term societal impact of their portfolio companies. Despite these restraints, the long-term outlook for the VC industry remains positive, driven by continued innovation and the ongoing need for capital to support the growth of high-potential businesses. Successful navigation of market fluctuations and adaptation to evolving investor preferences will be crucial for VC firms to maintain their competitive edge.
Venture Capital Industry Company Market Share
Venture Capital Industry Report: 2019-2033
This comprehensive report provides a detailed analysis of the Venture Capital industry, offering invaluable insights for investors, entrepreneurs, and industry stakeholders. The study period spans from 2019 to 2033, with a base year of 2025 and a forecast period from 2025 to 2033. We analyze key market dynamics, trends, and leading players, providing a clear picture of this rapidly evolving landscape. The report incorporates extensive data analysis and expert insights to reveal both challenges and emerging opportunities. Expected value of USD Million is used throughout the report.
Venture Capital Industry Market Dynamics & Concentration
The Venture Capital (VC) industry is characterized by significant concentration among leading firms, with a few players dominating market share. This concentration is driven by factors including significant capital under management, strong network effects, and expertise in identifying and nurturing high-growth potential startups. However, the industry is also marked by substantial innovation, fueled by continuous technological advancements and the emergence of new business models.
Market Concentration Metrics (2024 Estimates):
- Top 5 firms hold xx% of market share.
- Average deal size: xx Million USD.
- Total M&A deals in 2024: xx deals.
Regulatory frameworks, while evolving, play a crucial role in shaping industry practices and investor behavior. The increasing scrutiny around data privacy, environmental, social, and governance (ESG) factors, and anti-trust regulations are reshaping the investment landscape. Substitutes, such as angel investors, crowdfunding platforms, and private equity, offer alternative funding avenues, impacting the VC market's share of the total early-stage funding. End-user trends, characterized by a rise in technology-driven businesses and a focus on sustainability and impact investing, drive significant investment in specific sectors. Finally, the VC industry sees considerable Merger & Acquisition (M&A) activity, with established firms acquiring smaller players to expand their portfolio, expertise, and market reach.
Venture Capital Industry Industry Trends & Analysis
The Venture Capital industry is experiencing robust growth, driven by several key factors. Technological disruptions, particularly in areas like artificial intelligence, biotechnology, and fintech, are creating numerous high-growth investment opportunities. Consumer preferences are shifting towards digital solutions and sustainable practices, further accelerating the demand for VC funding in related sectors. The competitive dynamics are intense, with established players continuously innovating and new entrants vying for market share. The market's growth is expected to accelerate, with a Compound Annual Growth Rate (CAGR) of xx% projected from 2025 to 2033. Market penetration is expected to reach xx% by 2033, driven by increasing startup activity and a favorable investment climate in key regions.
Leading Markets & Segments in Venture Capital Industry
The Americas, specifically the United States, remain the dominant region for VC investment. This dominance is attributable to several factors:
- Robust entrepreneurial ecosystem: A large pool of talented entrepreneurs and a culture that encourages innovation.
- Abundant capital: The presence of large institutional investors and high-net-worth individuals willing to invest in high-risk, high-reward opportunities.
- Favorable regulatory environment: Relatively less stringent regulations compared to other regions, facilitating easier capital flow.
- Strong infrastructure: Well-developed financial markets and support services for startups.
Europe is also a significant market, experiencing substantial growth, particularly in the UK and Germany. Asia, while showing considerable potential, faces challenges related to regulatory hurdles and market complexities. The technology sector consistently attracts the largest share of VC investment globally, followed by healthcare and fintech.
Venture Capital Industry Product Developments
Product innovations in the Venture Capital industry are less about tangible products and more about innovative investment strategies and portfolio management techniques. Advancements in data analytics and AI are used to identify promising investment opportunities and predict market trends. These innovative approaches, coupled with a focus on value-creation for portfolio companies, offer significant competitive advantages in a rapidly evolving market. The industry is also witnessing the adoption of alternative investment vehicles, such as impact investing and venture debt, reflecting changing investor preferences and market demands.
Key Drivers of Venture Capital Industry Growth
Several factors fuel the growth of the Venture Capital industry. Technological advancements, like AI and blockchain, create numerous new opportunities. Favorable economic conditions, including low interest rates and readily available capital, encourage investment. Supportive government policies and regulations also help foster a healthy startup ecosystem. For example, initiatives promoting innovation and providing tax breaks for investors stimulate growth.
Challenges in the Venture Capital Industry Market
The Venture Capital industry faces several challenges. Stringent regulations, such as those related to data privacy and ESG, increase compliance costs. Supply chain disruptions can impact portfolio companies, particularly those in manufacturing or logistics. Intense competition from other investors and alternative funding sources puts pressure on margins. The fluctuating global economic climate also presents significant risk.
Emerging Opportunities in Venture Capital Industry
Several opportunities are emerging for the Venture Capital industry. Breakthroughs in technology, such as quantum computing and advanced materials, present exciting new investment areas. Strategic partnerships between VCs and corporations allow for collaborative innovation and faster market penetration. Expansion into emerging markets, such as Southeast Asia and Africa, offers significant growth potential.
Leading Players in the Venture Capital Industry Sector
- Tiger Global Management
- New Enterprises Associates
- Sequoia Capital
- DST Global
- IDG Capital
- Index Ventures
- Healthcare Royalty Partners
- GGV Capital
- Nanjing Zijin Investment
- Greylock Partners (List Not Exhaustive)
Key Milestones in Venture Capital Industry Industry
- Q4 2020: USD 41 billion invested in The Americas across 2,725 deals (USD 38.8 billion in the US alone). This demonstrates the significant concentration of VC investment in the US market.
- Q4 2020: Europe sets a second consecutive quarterly record with USD 14.3 billion raised across 1,192 deals, highlighting the strong growth in European VC investment.
- 2022: IDG Capital Vietnam's investment in METAIN marks the firm's ambition to lead the NFT-empowered real estate trend in Vietnam. This highlights the emergence of innovative technologies impacting real estate and the expansion of VC investment into emerging markets.
Strategic Outlook for Venture Capital Industry Market
The Venture Capital industry is poised for continued growth, driven by technological innovation and increasing demand for funding from high-growth startups. Strategic partnerships, expansion into new markets, and the adoption of innovative investment strategies will be key factors in determining success. The focus on sustainability and impact investing will further shape investment decisions and long-term industry growth.
Venture Capital Industry Segmentation
-
1. Type
- 1.1. Local Investors
- 1.2. International Investors
-
2. Industry
- 2.1. Real Estate
- 2.2. Financial Services
- 2.3. Food & Beverages
- 2.4. Healthcare
- 2.5. Transport & Logistics
- 2.6. IT & ITeS
- 2.7. Education
- 2.8. Other Industries
Venture Capital Industry Segmentation By Geography
- 1. North America
- 2. Latin America
- 3. Europe
- 4. Asia Pacific
- 5. Middle East and Africa
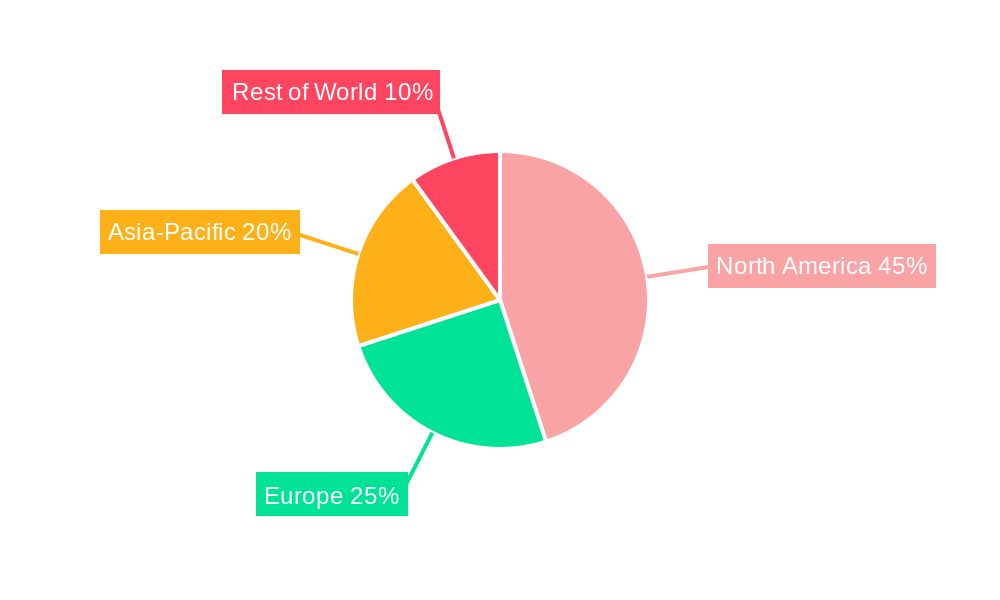
Venture Capital Industry Regional Market Share
Geographic Coverage of Venture Capital Industry
Venture Capital Industry REPORT HIGHLIGHTS
| Aspects | Details |
|---|---|
| Study Period | 2020-2034 |
| Base Year | 2025 |
| Estimated Year | 2026 |
| Forecast Period | 2026-2034 |
| Historical Period | 2020-2025 |
| Growth Rate | CAGR of 16.68% from 2020-2034 |
| Segmentation |
|
Table of Contents
- 1. Introduction
- 1.1. Research Scope
- 1.2. Market Segmentation
- 1.3. Research Objective
- 1.4. Definitions and Assumptions
- 2. Executive Summary
- 2.1. Market Snapshot
- 3. Market Dynamics
- 3.1. Market Drivers
- 3.2. Market Restrains
- 3.3. Market Trends
- 3.4. Market Opportunities
- 4. Market Factor Analysis
- 4.1. Porters Five Forces
- 4.1.1. Bargaining Power of Suppliers
- 4.1.2. Bargaining Power of Buyers
- 4.1.3. Threat of New Entrants
- 4.1.4. Threat of Substitutes
- 4.1.5. Competitive Rivalry
- 4.2. PESTEL analysis
- 4.3. BCG Analysis
- 4.3.1. Stars (High Growth, High Market Share)
- 4.3.2. Cash Cows (Low Growth, High Market Share)
- 4.3.3. Question Mark (High Growth, Low Market Share)
- 4.3.4. Dogs (Low Growth, Low Market Share)
- 4.4. Ansoff Matrix Analysis
- 4.5. Supply Chain Analysis
- 4.6. Regulatory Landscape
- 4.7. Current Market Potential and Opportunity Assessment (TAM–SAM–SOM Framework)
- 4.8. MDP Analyst Note
- 4.1. Porters Five Forces
- 5. Market Analysis, Insights and Forecast 2021-2033
- 5.1. Market Analysis, Insights and Forecast - by Type
- 5.1.1. Local Investors
- 5.1.2. International Investors
- 5.2. Market Analysis, Insights and Forecast - by Industry
- 5.2.1. Real Estate
- 5.2.2. Financial Services
- 5.2.3. Food & Beverages
- 5.2.4. Healthcare
- 5.2.5. Transport & Logistics
- 5.2.6. IT & ITeS
- 5.2.7. Education
- 5.2.8. Other Industries
- 5.3. Market Analysis, Insights and Forecast - by Region
- 5.3.1. North America
- 5.3.2. Latin America
- 5.3.3. Europe
- 5.3.4. Asia Pacific
- 5.3.5. Middle East and Africa
- 5.1. Market Analysis, Insights and Forecast - by Type
- 6. Global Venture Capital Industry Analysis, Insights and Forecast, 2021-2033
- 6.1. Market Analysis, Insights and Forecast - by Type
- 6.1.1. Local Investors
- 6.1.2. International Investors
- 6.2. Market Analysis, Insights and Forecast - by Industry
- 6.2.1. Real Estate
- 6.2.2. Financial Services
- 6.2.3. Food & Beverages
- 6.2.4. Healthcare
- 6.2.5. Transport & Logistics
- 6.2.6. IT & ITeS
- 6.2.7. Education
- 6.2.8. Other Industries
- 6.1. Market Analysis, Insights and Forecast - by Type
- 7. North America Venture Capital Industry Analysis, Insights and Forecast, 2020-2032
- 7.1. Market Analysis, Insights and Forecast - by Type
- 7.1.1. Local Investors
- 7.1.2. International Investors
- 7.2. Market Analysis, Insights and Forecast - by Industry
- 7.2.1. Real Estate
- 7.2.2. Financial Services
- 7.2.3. Food & Beverages
- 7.2.4. Healthcare
- 7.2.5. Transport & Logistics
- 7.2.6. IT & ITeS
- 7.2.7. Education
- 7.2.8. Other Industries
- 7.1. Market Analysis, Insights and Forecast - by Type
- 8. Latin America Venture Capital Industry Analysis, Insights and Forecast, 2020-2032
- 8.1. Market Analysis, Insights and Forecast - by Type
- 8.1.1. Local Investors
- 8.1.2. International Investors
- 8.2. Market Analysis, Insights and Forecast - by Industry
- 8.2.1. Real Estate
- 8.2.2. Financial Services
- 8.2.3. Food & Beverages
- 8.2.4. Healthcare
- 8.2.5. Transport & Logistics
- 8.2.6. IT & ITeS
- 8.2.7. Education
- 8.2.8. Other Industries
- 8.1. Market Analysis, Insights and Forecast - by Type
- 9. Europe Venture Capital Industry Analysis, Insights and Forecast, 2020-2032
- 9.1. Market Analysis, Insights and Forecast - by Type
- 9.1.1. Local Investors
- 9.1.2. International Investors
- 9.2. Market Analysis, Insights and Forecast - by Industry
- 9.2.1. Real Estate
- 9.2.2. Financial Services
- 9.2.3. Food & Beverages
- 9.2.4. Healthcare
- 9.2.5. Transport & Logistics
- 9.2.6. IT & ITeS
- 9.2.7. Education
- 9.2.8. Other Industries
- 9.1. Market Analysis, Insights and Forecast - by Type
- 10. Asia Pacific Venture Capital Industry Analysis, Insights and Forecast, 2020-2032
- 10.1. Market Analysis, Insights and Forecast - by Type
- 10.1.1. Local Investors
- 10.1.2. International Investors
- 10.2. Market Analysis, Insights and Forecast - by Industry
- 10.2.1. Real Estate
- 10.2.2. Financial Services
- 10.2.3. Food & Beverages
- 10.2.4. Healthcare
- 10.2.5. Transport & Logistics
- 10.2.6. IT & ITeS
- 10.2.7. Education
- 10.2.8. Other Industries
- 10.1. Market Analysis, Insights and Forecast - by Type
- 11. Middle East and Africa Venture Capital Industry Analysis, Insights and Forecast, 2020-2032
- 11.1. Market Analysis, Insights and Forecast - by Type
- 11.1.1. Local Investors
- 11.1.2. International Investors
- 11.2. Market Analysis, Insights and Forecast - by Industry
- 11.2.1. Real Estate
- 11.2.2. Financial Services
- 11.2.3. Food & Beverages
- 11.2.4. Healthcare
- 11.2.5. Transport & Logistics
- 11.2.6. IT & ITeS
- 11.2.7. Education
- 11.2.8. Other Industries
- 11.1. Market Analysis, Insights and Forecast - by Type
- 12. Competitive Analysis
- 12.1. Company Profiles
- 12.1.1 Tiger Global Management
- 12.1.1.1. Company Overview
- 12.1.1.2. Products
- 12.1.1.3. Company Financials
- 12.1.1.4. SWOT Analysis
- 12.1.2 New Enterprises Associates
- 12.1.2.1. Company Overview
- 12.1.2.2. Products
- 12.1.2.3. Company Financials
- 12.1.2.4. SWOT Analysis
- 12.1.3 Sequoia Capital
- 12.1.3.1. Company Overview
- 12.1.3.2. Products
- 12.1.3.3. Company Financials
- 12.1.3.4. SWOT Analysis
- 12.1.4 DST Global
- 12.1.4.1. Company Overview
- 12.1.4.2. Products
- 12.1.4.3. Company Financials
- 12.1.4.4. SWOT Analysis
- 12.1.5 IDG Capital
- 12.1.5.1. Company Overview
- 12.1.5.2. Products
- 12.1.5.3. Company Financials
- 12.1.5.4. SWOT Analysis
- 12.1.6 Index Ventures
- 12.1.6.1. Company Overview
- 12.1.6.2. Products
- 12.1.6.3. Company Financials
- 12.1.6.4. SWOT Analysis
- 12.1.7 Healthcare Royalty Partners
- 12.1.7.1. Company Overview
- 12.1.7.2. Products
- 12.1.7.3. Company Financials
- 12.1.7.4. SWOT Analysis
- 12.1.8 GGV Capital
- 12.1.8.1. Company Overview
- 12.1.8.2. Products
- 12.1.8.3. Company Financials
- 12.1.8.4. SWOT Analysis
- 12.1.9 Nanjing Zijin Investment
- 12.1.9.1. Company Overview
- 12.1.9.2. Products
- 12.1.9.3. Company Financials
- 12.1.9.4. SWOT Analysis
- 12.1.10 Greylock Partners**List Not Exhaustive
- 12.1.10.1. Company Overview
- 12.1.10.2. Products
- 12.1.10.3. Company Financials
- 12.1.10.4. SWOT Analysis
- 12.1.1 Tiger Global Management
- 12.2. Market Entropy
- 12.2.1 Company's Key Areas Served
- 12.2.2 Recent Developments
- 12.3. Company Market Share Analysis 2025
- 12.3.1 Top 5 Companies Market Share Analysis
- 12.3.2 Top 3 Companies Market Share Analysis
- 12.4. List of Potential Customers
- 13. Research Methodology
List of Figures
- Figure 1: Global Venture Capital Industry Revenue Breakdown (billion, %) by Region 2025 & 2033
- Figure 2: North America Venture Capital Industry Revenue (billion), by Type 2025 & 2033
- Figure 3: North America Venture Capital Industry Revenue Share (%), by Type 2025 & 2033
- Figure 4: North America Venture Capital Industry Revenue (billion), by Industry 2025 & 2033
- Figure 5: North America Venture Capital Industry Revenue Share (%), by Industry 2025 & 2033
- Figure 6: North America Venture Capital Industry Revenue (billion), by Country 2025 & 2033
- Figure 7: North America Venture Capital Industry Revenue Share (%), by Country 2025 & 2033
- Figure 8: Latin America Venture Capital Industry Revenue (billion), by Type 2025 & 2033
- Figure 9: Latin America Venture Capital Industry Revenue Share (%), by Type 2025 & 2033
- Figure 10: Latin America Venture Capital Industry Revenue (billion), by Industry 2025 & 2033
- Figure 11: Latin America Venture Capital Industry Revenue Share (%), by Industry 2025 & 2033
- Figure 12: Latin America Venture Capital Industry Revenue (billion), by Country 2025 & 2033
- Figure 13: Latin America Venture Capital Industry Revenue Share (%), by Country 2025 & 2033
- Figure 14: Europe Venture Capital Industry Revenue (billion), by Type 2025 & 2033
- Figure 15: Europe Venture Capital Industry Revenue Share (%), by Type 2025 & 2033
- Figure 16: Europe Venture Capital Industry Revenue (billion), by Industry 2025 & 2033
- Figure 17: Europe Venture Capital Industry Revenue Share (%), by Industry 2025 & 2033
- Figure 18: Europe Venture Capital Industry Revenue (billion), by Country 2025 & 2033
- Figure 19: Europe Venture Capital Industry Revenue Share (%), by Country 2025 & 2033
- Figure 20: Asia Pacific Venture Capital Industry Revenue (billion), by Type 2025 & 2033
- Figure 21: Asia Pacific Venture Capital Industry Revenue Share (%), by Type 2025 & 2033
- Figure 22: Asia Pacific Venture Capital Industry Revenue (billion), by Industry 2025 & 2033
- Figure 23: Asia Pacific Venture Capital Industry Revenue Share (%), by Industry 2025 & 2033
- Figure 24: Asia Pacific Venture Capital Industry Revenue (billion), by Country 2025 & 2033
- Figure 25: Asia Pacific Venture Capital Industry Revenue Share (%), by Country 2025 & 2033
- Figure 26: Middle East and Africa Venture Capital Industry Revenue (billion), by Type 2025 & 2033
- Figure 27: Middle East and Africa Venture Capital Industry Revenue Share (%), by Type 2025 & 2033
- Figure 28: Middle East and Africa Venture Capital Industry Revenue (billion), by Industry 2025 & 2033
- Figure 29: Middle East and Africa Venture Capital Industry Revenue Share (%), by Industry 2025 & 2033
- Figure 30: Middle East and Africa Venture Capital Industry Revenue (billion), by Country 2025 & 2033
- Figure 31: Middle East and Africa Venture Capital Industry Revenue Share (%), by Country 2025 & 2033
List of Tables
- Table 1: Global Venture Capital Industry Revenue billion Forecast, by Type 2020 & 2033
- Table 2: Global Venture Capital Industry Revenue billion Forecast, by Industry 2020 & 2033
- Table 3: Global Venture Capital Industry Revenue billion Forecast, by Region 2020 & 2033
- Table 4: Global Venture Capital Industry Revenue billion Forecast, by Type 2020 & 2033
- Table 5: Global Venture Capital Industry Revenue billion Forecast, by Industry 2020 & 2033
- Table 6: Global Venture Capital Industry Revenue billion Forecast, by Country 2020 & 2033
- Table 7: Global Venture Capital Industry Revenue billion Forecast, by Type 2020 & 2033
- Table 8: Global Venture Capital Industry Revenue billion Forecast, by Industry 2020 & 2033
- Table 9: Global Venture Capital Industry Revenue billion Forecast, by Country 2020 & 2033
- Table 10: Global Venture Capital Industry Revenue billion Forecast, by Type 2020 & 2033
- Table 11: Global Venture Capital Industry Revenue billion Forecast, by Industry 2020 & 2033
- Table 12: Global Venture Capital Industry Revenue billion Forecast, by Country 2020 & 2033
- Table 13: Global Venture Capital Industry Revenue billion Forecast, by Type 2020 & 2033
- Table 14: Global Venture Capital Industry Revenue billion Forecast, by Industry 2020 & 2033
- Table 15: Global Venture Capital Industry Revenue billion Forecast, by Country 2020 & 2033
- Table 16: Global Venture Capital Industry Revenue billion Forecast, by Type 2020 & 2033
- Table 17: Global Venture Capital Industry Revenue billion Forecast, by Industry 2020 & 2033
- Table 18: Global Venture Capital Industry Revenue billion Forecast, by Country 2020 & 2033
Frequently Asked Questions
1. What is the projected Compound Annual Growth Rate (CAGR) of the Venture Capital Industry?
The projected CAGR is approximately 16.68%.
2. Which companies are prominent players in the Venture Capital Industry?
Key companies in the market include Tiger Global Management, New Enterprises Associates, Sequoia Capital, DST Global, IDG Capital, Index Ventures, Healthcare Royalty Partners, GGV Capital, Nanjing Zijin Investment, Greylock Partners**List Not Exhaustive.
3. What are the main segments of the Venture Capital Industry?
The market segments include Type, Industry.
4. Can you provide details about the market size?
The market size is estimated to be USD 396.7 billion as of 2022.
5. What are some drivers contributing to market growth?
N/A
6. What are the notable trends driving market growth?
Distribution of Start-Ups Witnessing Venture Capital Industry Globally.
7. Are there any restraints impacting market growth?
N/A
8. Can you provide examples of recent developments in the market?
In 2022, IDG Capital Vietnam Confirms Investment in METAIN to Lead NFT-Empowered Real Estate Trend in Vietnam. IDG Capital also shows its ambition to lead the NFT Real estate trend and reveals its plan to proactively engage with global investors to attract investment into the Vietnam real estate market. With the high security, instantaneous settlement, transparent, seamless transaction process, blockchain, smart contract, and NFT (Non-fungible token) technology is transforming the real estate industry and will become the key trend in the next decades.
9. What pricing options are available for accessing the report?
Pricing options include single-user, multi-user, and enterprise licenses priced at USD 4750, USD 5250, and USD 8750 respectively.
10. Is the market size provided in terms of value or volume?
The market size is provided in terms of value, measured in billion.
11. Are there any specific market keywords associated with the report?
Yes, the market keyword associated with the report is "Venture Capital Industry," which aids in identifying and referencing the specific market segment covered.
12. How do I determine which pricing option suits my needs best?
The pricing options vary based on user requirements and access needs. Individual users may opt for single-user licenses, while businesses requiring broader access may choose multi-user or enterprise licenses for cost-effective access to the report.
13. Are there any additional resources or data provided in the Venture Capital Industry report?
While the report offers comprehensive insights, it's advisable to review the specific contents or supplementary materials provided to ascertain if additional resources or data are available.
14. How can I stay updated on further developments or reports in the Venture Capital Industry?
To stay informed about further developments, trends, and reports in the Venture Capital Industry, consider subscribing to industry newsletters, following relevant companies and organizations, or regularly checking reputable industry news sources and publications.
Methodology
Step 1 - Identification of Relevant Samples Size from Population Database


Step 2 - Approaches for Defining Global Market Size (Value, Volume* & Price*)

Note*: In applicable scenarios
Step 3 - Data Sources
Primary Research
- Web Analytics
- Survey Reports
- Research Institute
- Latest Research Reports
- Opinion Leaders
Secondary Research
- Annual Reports
- White Paper
- Latest Press Release
- Industry Association
- Paid Database
- Investor Presentations

Step 4 - Data Triangulation
Involves using different sources of information in order to increase the validity of a study
These sources are likely to be stakeholders in a program - participants, other researchers, program staff, other community members, and so on.
Then we put all data in single framework & apply various statistical tools to find out the dynamic on the market.
During the analysis stage, feedback from the stakeholder groups would be compared to determine areas of agreement as well as areas of divergence