

Key Insights
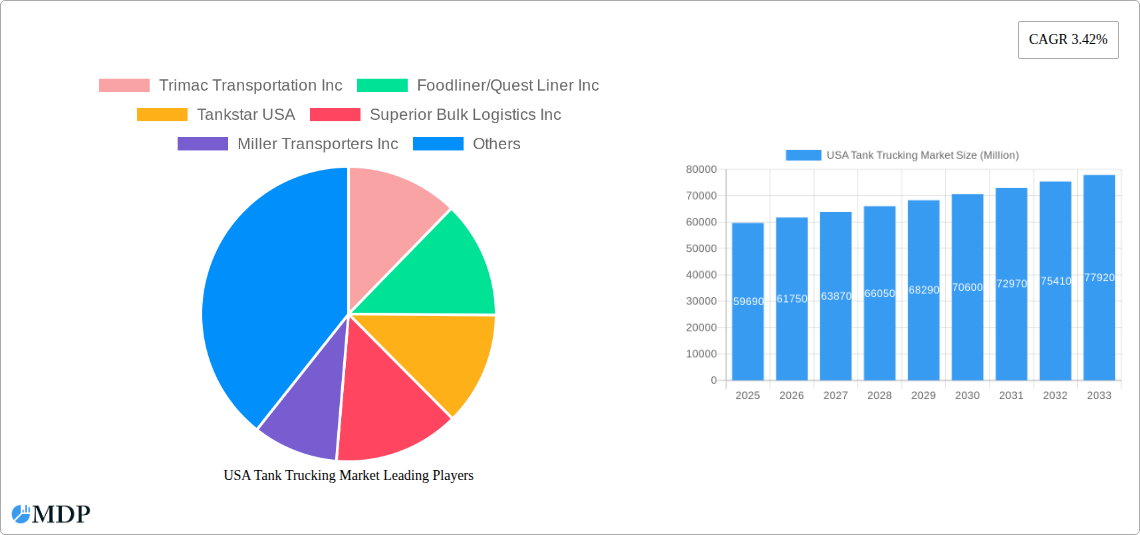
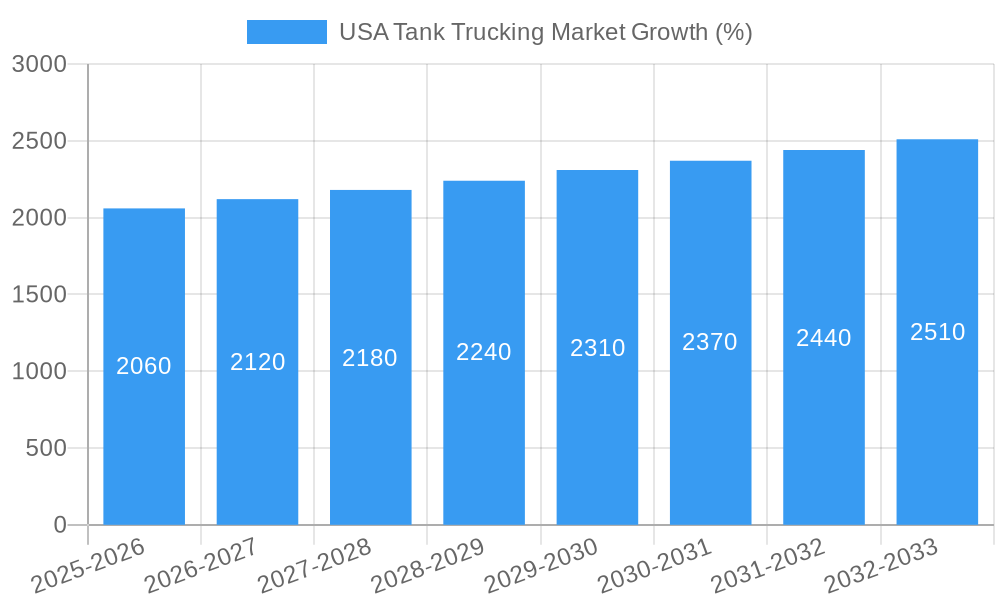
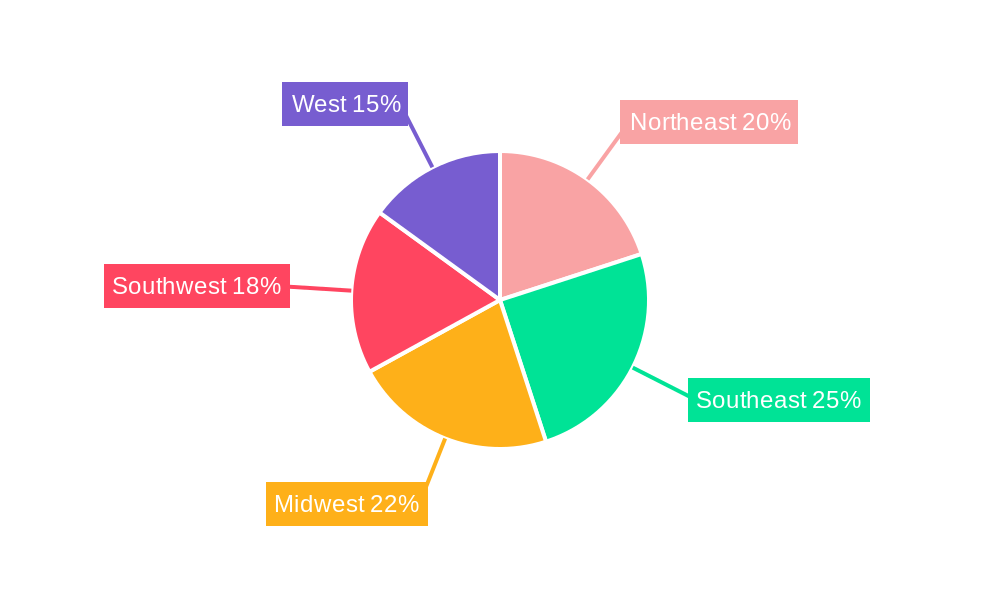
The US Tank Trucking market, valued at $59.69 billion in 2025, is projected to experience steady growth, driven by a robust economy, increasing demand for petroleum products, and the expansion of the chemical and food & beverage industries. The market's Compound Annual Growth Rate (CAGR) of 3.42% from 2025 to 2033 reflects a consistent, albeit moderate, expansion. This growth is fueled by several key factors, including the rising need for efficient transportation of hazardous materials, increased infrastructure development, and the ongoing shift towards just-in-time delivery models. The market is segmented by fleet type (for-hire and private), capacity (light, medium, and heavy duty), and product category (crude petroleum, petroleum products, chemicals, food and beverages, fertilizers, and others). The competitive landscape is fragmented, with numerous players such as Trimac Transportation, Foodliner/Quest Liner, and Tankstar USA vying for market share. Regional variations exist, with the Southeast, Midwest, and Southwest likely exhibiting robust growth due to their industrial concentration and extensive highway networks.
However, the market faces certain challenges. Fluctuations in fuel prices represent a significant headwind, impacting operational costs and profitability. Stringent environmental regulations and the increasing adoption of sustainable transportation solutions necessitate investments in newer, more fuel-efficient vehicles and operational strategies. Driver shortages continue to be a persistent issue affecting the industry's capacity and operational efficiency. Despite these constraints, the long-term outlook for the US tank trucking market remains positive, fueled by the fundamental growth of the industries it serves and the continued demand for reliable, specialized transportation services. The market is expected to continue its expansion throughout the forecast period (2025-2033), driven by long-term trends in industrial production and consumption.
USA Tank Trucking Market: A Comprehensive Report (2019-2033)
This comprehensive report provides an in-depth analysis of the USA Tank Trucking Market, offering invaluable insights for industry stakeholders, investors, and strategic decision-makers. Covering the period from 2019 to 2033, with a focus on 2025, this report dissects market dynamics, trends, leading players, and future growth opportunities within this vital sector. The report leverages rigorous data analysis and expert insights to provide a clear and actionable understanding of the market landscape. Expected market value is predicted at xx Million by 2033.
USA Tank Trucking Market Market Dynamics & Concentration
The USA tank trucking market exhibits a moderately concentrated landscape, with several major players holding significant market share. However, a multitude of smaller, regional operators also contribute significantly to the overall market volume. Market concentration is influenced by factors such as economies of scale, access to capital, and technological capabilities. Innovation, driven by the need for enhanced efficiency and safety, plays a crucial role. Stringent regulatory frameworks, including those pertaining to safety and environmental regulations (e.g., emissions standards), shape the operational landscape. The availability of alternative transportation methods (rail, pipelines) serves as a substitute, impacting market share. End-user trends, particularly in manufacturing, energy, and food & beverage, directly influence demand. The market also witnesses consistent mergers and acquisitions (M&A) activity, as larger players seek to expand their geographical reach and service offerings.
- Market Share: The top five players account for approximately xx% of the market share in 2025.
- M&A Activity: An average of xx M&A deals were recorded annually between 2019 and 2024.
- Innovation Drivers: Technological advancements in fleet management, telematics, and fuel efficiency are key drivers.
- Regulatory Frameworks: Compliance with EPA regulations and DOT safety standards is paramount.
- Product Substitutes: Rail and pipeline transportation pose competitive pressure on certain segments.
- End-User Trends: Growth in the chemical and energy sectors boosts demand for tank trucking services.
USA Tank Trucking Market Industry Trends & Analysis
The USA tank trucking market is projected to experience a CAGR of xx% during the forecast period (2025-2033). This growth is fueled by several factors, including rising demand for the transportation of various goods (petroleum products, chemicals, food, etc.), infrastructural development, increased e-commerce activities, and economic growth across various sectors. Technological advancements, such as the adoption of advanced telematics systems and autonomous driving technologies, are expected to enhance efficiency and safety. However, challenges like driver shortages, fluctuating fuel prices, and stringent regulations can potentially impede growth. Consumer preferences for faster and more reliable delivery solutions are creating pressure on service providers to improve their operational efficiency. Intense competition among existing players and new entrants necessitates continuous improvement in service quality, pricing strategies, and technological adaptation.
- Market Growth Drivers: Increasing industrial production, expanding e-commerce, and improved infrastructure development contribute to market growth.
- Technological Disruptions: Adoption of telematics, driver assistance systems, and route optimization software is improving efficiency.
- Consumer Preferences: Demand for faster, reliable delivery, and real-time tracking fuels the market.
- Competitive Dynamics: Intense competition based on price, service quality, and technology adoption.
Leading Markets & Segments in USA Tank Trucking Market
The Heavy Duty segment within the For-hire fleet type holds the largest market share across all capacity and fleet type segments. This dominance is due to increased demand from the chemicals and petroleum sectors. The Petroleum Products segment (including gasoline, diesel, and aviation fuels) constitutes the largest portion of product categories transported. Geographically, the South and Midwest regions represent the strongest markets, driven by higher industrial activities and a greater concentration of key industries.
- By Fleet Type: For-hire dominates due to its flexibility and service diversity.
- By Capacity: Heavy-duty vehicles dominate due to higher transport volumes.
- By Product Category: Petroleum products have the largest market share due to consistent high demand.
- Key Drivers (Geographical): Strong industrial activity in the South and Midwest regions fuels market growth. Favorable economic policies and well-developed infrastructure are significant growth contributors.
USA Tank Trucking Market Product Developments
Recent product developments focus on enhancing safety features, improving fuel efficiency, and integrating advanced telematics systems. The adoption of lightweight materials in trailer construction reduces fuel consumption, thereby lowering operating costs. Real-time tracking and monitoring systems enable better fleet management and enhance operational efficiency. These advancements contribute to improved service offerings and a stronger competitive advantage.
Key Drivers of USA Tank Trucking Market Growth
The USA tank trucking market's growth is primarily driven by the expansion of industrial sectors, including chemicals, food & beverages, and energy. Strong infrastructure investment supports enhanced logistics and connectivity. Favorable government policies aimed at improving the transportation sector also stimulate market growth. Technological innovation and the adoption of newer, more efficient vehicles play a key role in driving market expansion.
Challenges in the USA Tank Trucking Market Market
The tank trucking industry faces challenges such as driver shortages, leading to increased labor costs and operational inefficiencies. Fluctuating fuel prices impact profitability. Stricter environmental regulations and compliance costs create additional operational burden. Intense competition from other modes of transportation and the emergence of new technologies present significant challenges to maintaining a competitive edge.
Emerging Opportunities in USA Tank Trucking Market
The integration of autonomous driving technologies and advanced telematics presents significant opportunities for enhanced safety, improved efficiency, and reduced operating costs. Strategic partnerships between tank trucking companies and technology providers could lead to the development of innovative solutions for optimizing logistics and improving fleet management. Market expansion into new regions and growth in emerging sectors offer additional opportunities for market growth.
Leading Players in the USA Tank Trucking Market Sector
- Trimac Transportation Inc
- Foodliner/Quest Liner Inc
- Tankstar USA
- Superior Bulk Logistics Inc
- Miller Transporters Inc
- Groendyke Transport Inc
- Martin Transport Inc
- Florida Rock & Tank Lines Inc
- Slay Transportation Co Inc
- Apex Logistics LLC
- Mission Petroleum Carriers
- Genox Transportation Inc
- J&M Tank Lines Inc
- CLI Transport LP
- Tidewater Transit Co Inc
- Herman R Ewell Inc
- Service Transport Company
- Schilli Bulk Carriers Group
- Andrews Logistics
- CTL Transportation LLC
- Eagle Transport Corp
- Ruan Transportation Management Systems
- Kenan Advantage Group
- Dupre Logistics LLC
Key Milestones in USA Tank Trucking Market Industry
- April 2023: Trimac Transportation's acquisition of AIP Logistics expands its bulk terminal services and warehousing capabilities.
- February 2024: Kenan Advantage Group's acquisition of Northern Dry Bulk strengthens its position in the plastic resin transportation market.
Strategic Outlook for USA Tank Trucking Market Market
The USA tank trucking market is poised for continued growth, driven by robust industrial activity and technological advancements. Strategic investments in technology, fleet modernization, and talent acquisition will be crucial for maintaining competitiveness. Expanding into new segments and exploring strategic partnerships will further enhance market penetration and profitability. The focus on sustainability and environmentally friendly transportation solutions will also present significant opportunities.
USA Tank Trucking Market Segmentation
-
1. Fleet Type
- 1.1. For-hire
- 1.2. Private
-
2. Capacity
- 2.1. Light Duty
- 2.2. Medium Duty
- 2.3. Heavy Duty
-
3. Product Category
- 3.1. Crude Petroleum
- 3.2. Petroleu
- 3.3. Chemicals
- 3.4. Food and Beverages
- 3.5. Fertilizers
- 3.6. Other Product Categories
USA Tank Trucking Market Segmentation By Geography
-
1. North America
- 1.1. United States
- 1.2. Canada
- 1.3. Mexico
-
2. South America
- 2.1. Brazil
- 2.2. Argentina
- 2.3. Rest of South America
-
3. Europe
- 3.1. United Kingdom
- 3.2. Germany
- 3.3. France
- 3.4. Italy
- 3.5. Spain
- 3.6. Russia
- 3.7. Benelux
- 3.8. Nordics
- 3.9. Rest of Europe
-
4. Middle East & Africa
- 4.1. Turkey
- 4.2. Israel
- 4.3. GCC
- 4.4. North Africa
- 4.5. South Africa
- 4.6. Rest of Middle East & Africa
-
5. Asia Pacific
- 5.1. China
- 5.2. India
- 5.3. Japan
- 5.4. South Korea
- 5.5. ASEAN
- 5.6. Oceania
- 5.7. Rest of Asia Pacific
USA Tank Trucking Market REPORT HIGHLIGHTS
| Aspects | Details |
|---|---|
| Study Period | 2019-2033 |
| Base Year | 2024 |
| Estimated Year | 2025 |
| Forecast Period | 2025-2033 |
| Historical Period | 2019-2024 |
| Growth Rate | CAGR of 3.42% from 2019-2033 |
| Segmentation |
|
Table of Contents
- 1. Introduction
- 1.1. Research Scope
- 1.2. Market Segmentation
- 1.3. Research Methodology
- 1.4. Definitions and Assumptions
- 2. Executive Summary
- 2.1. Introduction
- 3. Market Dynamics
- 3.1. Introduction
- 3.2. Market Drivers
- 3.2.1. Rise in Demand for Oil and Natural Gas; Technological Advancements
- 3.3. Market Restrains
- 3.3.1. Increasing Regulatory Burden and Compliance Costs; Volatility of Fuel Prices
- 3.4. Market Trends
- 3.4.1. Fuel Tank Trailers as Petroleum Carriers are Boosting the Market's Growth in the United States
- 4. Market Factor Analysis
- 4.1. Porters Five Forces
- 4.2. Supply/Value Chain
- 4.3. PESTEL analysis
- 4.4. Market Entropy
- 4.5. Patent/Trademark Analysis
- 5. Global USA Tank Trucking Market Analysis, Insights and Forecast, 2019-2031
- 5.1. Market Analysis, Insights and Forecast - by Fleet Type
- 5.1.1. For-hire
- 5.1.2. Private
- 5.2. Market Analysis, Insights and Forecast - by Capacity
- 5.2.1. Light Duty
- 5.2.2. Medium Duty
- 5.2.3. Heavy Duty
- 5.3. Market Analysis, Insights and Forecast - by Product Category
- 5.3.1. Crude Petroleum
- 5.3.2. Petroleu
- 5.3.3. Chemicals
- 5.3.4. Food and Beverages
- 5.3.5. Fertilizers
- 5.3.6. Other Product Categories
- 5.4. Market Analysis, Insights and Forecast - by Region
- 5.4.1. North America
- 5.4.2. South America
- 5.4.3. Europe
- 5.4.4. Middle East & Africa
- 5.4.5. Asia Pacific
- 5.1. Market Analysis, Insights and Forecast - by Fleet Type
- 6. North America USA Tank Trucking Market Analysis, Insights and Forecast, 2019-2031
- 6.1. Market Analysis, Insights and Forecast - by Fleet Type
- 6.1.1. For-hire
- 6.1.2. Private
- 6.2. Market Analysis, Insights and Forecast - by Capacity
- 6.2.1. Light Duty
- 6.2.2. Medium Duty
- 6.2.3. Heavy Duty
- 6.3. Market Analysis, Insights and Forecast - by Product Category
- 6.3.1. Crude Petroleum
- 6.3.2. Petroleu
- 6.3.3. Chemicals
- 6.3.4. Food and Beverages
- 6.3.5. Fertilizers
- 6.3.6. Other Product Categories
- 6.1. Market Analysis, Insights and Forecast - by Fleet Type
- 7. South America USA Tank Trucking Market Analysis, Insights and Forecast, 2019-2031
- 7.1. Market Analysis, Insights and Forecast - by Fleet Type
- 7.1.1. For-hire
- 7.1.2. Private
- 7.2. Market Analysis, Insights and Forecast - by Capacity
- 7.2.1. Light Duty
- 7.2.2. Medium Duty
- 7.2.3. Heavy Duty
- 7.3. Market Analysis, Insights and Forecast - by Product Category
- 7.3.1. Crude Petroleum
- 7.3.2. Petroleu
- 7.3.3. Chemicals
- 7.3.4. Food and Beverages
- 7.3.5. Fertilizers
- 7.3.6. Other Product Categories
- 7.1. Market Analysis, Insights and Forecast - by Fleet Type
- 8. Europe USA Tank Trucking Market Analysis, Insights and Forecast, 2019-2031
- 8.1. Market Analysis, Insights and Forecast - by Fleet Type
- 8.1.1. For-hire
- 8.1.2. Private
- 8.2. Market Analysis, Insights and Forecast - by Capacity
- 8.2.1. Light Duty
- 8.2.2. Medium Duty
- 8.2.3. Heavy Duty
- 8.3. Market Analysis, Insights and Forecast - by Product Category
- 8.3.1. Crude Petroleum
- 8.3.2. Petroleu
- 8.3.3. Chemicals
- 8.3.4. Food and Beverages
- 8.3.5. Fertilizers
- 8.3.6. Other Product Categories
- 8.1. Market Analysis, Insights and Forecast - by Fleet Type
- 9. Middle East & Africa USA Tank Trucking Market Analysis, Insights and Forecast, 2019-2031
- 9.1. Market Analysis, Insights and Forecast - by Fleet Type
- 9.1.1. For-hire
- 9.1.2. Private
- 9.2. Market Analysis, Insights and Forecast - by Capacity
- 9.2.1. Light Duty
- 9.2.2. Medium Duty
- 9.2.3. Heavy Duty
- 9.3. Market Analysis, Insights and Forecast - by Product Category
- 9.3.1. Crude Petroleum
- 9.3.2. Petroleu
- 9.3.3. Chemicals
- 9.3.4. Food and Beverages
- 9.3.5. Fertilizers
- 9.3.6. Other Product Categories
- 9.1. Market Analysis, Insights and Forecast - by Fleet Type
- 10. Asia Pacific USA Tank Trucking Market Analysis, Insights and Forecast, 2019-2031
- 10.1. Market Analysis, Insights and Forecast - by Fleet Type
- 10.1.1. For-hire
- 10.1.2. Private
- 10.2. Market Analysis, Insights and Forecast - by Capacity
- 10.2.1. Light Duty
- 10.2.2. Medium Duty
- 10.2.3. Heavy Duty
- 10.3. Market Analysis, Insights and Forecast - by Product Category
- 10.3.1. Crude Petroleum
- 10.3.2. Petroleu
- 10.3.3. Chemicals
- 10.3.4. Food and Beverages
- 10.3.5. Fertilizers
- 10.3.6. Other Product Categories
- 10.1. Market Analysis, Insights and Forecast - by Fleet Type
- 11. Northeast USA Tank Trucking Market Analysis, Insights and Forecast, 2019-2031
- 12. Southeast USA Tank Trucking Market Analysis, Insights and Forecast, 2019-2031
- 13. Midwest USA Tank Trucking Market Analysis, Insights and Forecast, 2019-2031
- 14. Southwest USA Tank Trucking Market Analysis, Insights and Forecast, 2019-2031
- 15. West USA Tank Trucking Market Analysis, Insights and Forecast, 2019-2031
- 16. Competitive Analysis
- 16.1. Global Market Share Analysis 2024
- 16.2. Company Profiles
- 16.2.1 Trimac Transportation Inc
- 16.2.1.1. Overview
- 16.2.1.2. Products
- 16.2.1.3. SWOT Analysis
- 16.2.1.4. Recent Developments
- 16.2.1.5. Financials (Based on Availability)
- 16.2.2 Foodliner/Quest Liner Inc
- 16.2.2.1. Overview
- 16.2.2.2. Products
- 16.2.2.3. SWOT Analysis
- 16.2.2.4. Recent Developments
- 16.2.2.5. Financials (Based on Availability)
- 16.2.3 Tankstar USA
- 16.2.3.1. Overview
- 16.2.3.2. Products
- 16.2.3.3. SWOT Analysis
- 16.2.3.4. Recent Developments
- 16.2.3.5. Financials (Based on Availability)
- 16.2.4 Superior Bulk Logistics Inc
- 16.2.4.1. Overview
- 16.2.4.2. Products
- 16.2.4.3. SWOT Analysis
- 16.2.4.4. Recent Developments
- 16.2.4.5. Financials (Based on Availability)
- 16.2.5 Miller Transporters Inc
- 16.2.5.1. Overview
- 16.2.5.2. Products
- 16.2.5.3. SWOT Analysis
- 16.2.5.4. Recent Developments
- 16.2.5.5. Financials (Based on Availability)
- 16.2.6 Groendyke Transport Inc
- 16.2.6.1. Overview
- 16.2.6.2. Products
- 16.2.6.3. SWOT Analysis
- 16.2.6.4. Recent Developments
- 16.2.6.5. Financials (Based on Availability)
- 16.2.7 Martin Transport Inc
- 16.2.7.1. Overview
- 16.2.7.2. Products
- 16.2.7.3. SWOT Analysis
- 16.2.7.4. Recent Developments
- 16.2.7.5. Financials (Based on Availability)
- 16.2.8 Florida Rock & Tank Lines Inc **List Not Exhaustive 7 3 Other Companies (Slay Transportation Co Inc Apex Logistics LLC Mission Petroleum Carriers Genox Transportation Inc J&M Tank Lines Inc CLI Transport LP Tidewater Transit Co Inc Herman R Ewell Inc Service Transport Company Schilli Bulk Carriers Group Andrews Logistics and CTL Transportation LLC
- 16.2.8.1. Overview
- 16.2.8.2. Products
- 16.2.8.3. SWOT Analysis
- 16.2.8.4. Recent Developments
- 16.2.8.5. Financials (Based on Availability)
- 16.2.9 Eagle Transport Corp
- 16.2.9.1. Overview
- 16.2.9.2. Products
- 16.2.9.3. SWOT Analysis
- 16.2.9.4. Recent Developments
- 16.2.9.5. Financials (Based on Availability)
- 16.2.10 Ruan Transportation Management Systems
- 16.2.10.1. Overview
- 16.2.10.2. Products
- 16.2.10.3. SWOT Analysis
- 16.2.10.4. Recent Developments
- 16.2.10.5. Financials (Based on Availability)
- 16.2.11 Kenan Advantage Group
- 16.2.11.1. Overview
- 16.2.11.2. Products
- 16.2.11.3. SWOT Analysis
- 16.2.11.4. Recent Developments
- 16.2.11.5. Financials (Based on Availability)
- 16.2.12 Dupre Logistics LLC
- 16.2.12.1. Overview
- 16.2.12.2. Products
- 16.2.12.3. SWOT Analysis
- 16.2.12.4. Recent Developments
- 16.2.12.5. Financials (Based on Availability)
- 16.2.1 Trimac Transportation Inc
List of Figures
- Figure 1: Global USA Tank Trucking Market Revenue Breakdown (Million, %) by Region 2024 & 2032
- Figure 2: United states USA Tank Trucking Market Revenue (Million), by Country 2024 & 2032
- Figure 3: United states USA Tank Trucking Market Revenue Share (%), by Country 2024 & 2032
- Figure 4: North America USA Tank Trucking Market Revenue (Million), by Fleet Type 2024 & 2032
- Figure 5: North America USA Tank Trucking Market Revenue Share (%), by Fleet Type 2024 & 2032
- Figure 6: North America USA Tank Trucking Market Revenue (Million), by Capacity 2024 & 2032
- Figure 7: North America USA Tank Trucking Market Revenue Share (%), by Capacity 2024 & 2032
- Figure 8: North America USA Tank Trucking Market Revenue (Million), by Product Category 2024 & 2032
- Figure 9: North America USA Tank Trucking Market Revenue Share (%), by Product Category 2024 & 2032
- Figure 10: North America USA Tank Trucking Market Revenue (Million), by Country 2024 & 2032
- Figure 11: North America USA Tank Trucking Market Revenue Share (%), by Country 2024 & 2032
- Figure 12: South America USA Tank Trucking Market Revenue (Million), by Fleet Type 2024 & 2032
- Figure 13: South America USA Tank Trucking Market Revenue Share (%), by Fleet Type 2024 & 2032
- Figure 14: South America USA Tank Trucking Market Revenue (Million), by Capacity 2024 & 2032
- Figure 15: South America USA Tank Trucking Market Revenue Share (%), by Capacity 2024 & 2032
- Figure 16: South America USA Tank Trucking Market Revenue (Million), by Product Category 2024 & 2032
- Figure 17: South America USA Tank Trucking Market Revenue Share (%), by Product Category 2024 & 2032
- Figure 18: South America USA Tank Trucking Market Revenue (Million), by Country 2024 & 2032
- Figure 19: South America USA Tank Trucking Market Revenue Share (%), by Country 2024 & 2032
- Figure 20: Europe USA Tank Trucking Market Revenue (Million), by Fleet Type 2024 & 2032
- Figure 21: Europe USA Tank Trucking Market Revenue Share (%), by Fleet Type 2024 & 2032
- Figure 22: Europe USA Tank Trucking Market Revenue (Million), by Capacity 2024 & 2032
- Figure 23: Europe USA Tank Trucking Market Revenue Share (%), by Capacity 2024 & 2032
- Figure 24: Europe USA Tank Trucking Market Revenue (Million), by Product Category 2024 & 2032
- Figure 25: Europe USA Tank Trucking Market Revenue Share (%), by Product Category 2024 & 2032
- Figure 26: Europe USA Tank Trucking Market Revenue (Million), by Country 2024 & 2032
- Figure 27: Europe USA Tank Trucking Market Revenue Share (%), by Country 2024 & 2032
- Figure 28: Middle East & Africa USA Tank Trucking Market Revenue (Million), by Fleet Type 2024 & 2032
- Figure 29: Middle East & Africa USA Tank Trucking Market Revenue Share (%), by Fleet Type 2024 & 2032
- Figure 30: Middle East & Africa USA Tank Trucking Market Revenue (Million), by Capacity 2024 & 2032
- Figure 31: Middle East & Africa USA Tank Trucking Market Revenue Share (%), by Capacity 2024 & 2032
- Figure 32: Middle East & Africa USA Tank Trucking Market Revenue (Million), by Product Category 2024 & 2032
- Figure 33: Middle East & Africa USA Tank Trucking Market Revenue Share (%), by Product Category 2024 & 2032
- Figure 34: Middle East & Africa USA Tank Trucking Market Revenue (Million), by Country 2024 & 2032
- Figure 35: Middle East & Africa USA Tank Trucking Market Revenue Share (%), by Country 2024 & 2032
- Figure 36: Asia Pacific USA Tank Trucking Market Revenue (Million), by Fleet Type 2024 & 2032
- Figure 37: Asia Pacific USA Tank Trucking Market Revenue Share (%), by Fleet Type 2024 & 2032
- Figure 38: Asia Pacific USA Tank Trucking Market Revenue (Million), by Capacity 2024 & 2032
- Figure 39: Asia Pacific USA Tank Trucking Market Revenue Share (%), by Capacity 2024 & 2032
- Figure 40: Asia Pacific USA Tank Trucking Market Revenue (Million), by Product Category 2024 & 2032
- Figure 41: Asia Pacific USA Tank Trucking Market Revenue Share (%), by Product Category 2024 & 2032
- Figure 42: Asia Pacific USA Tank Trucking Market Revenue (Million), by Country 2024 & 2032
- Figure 43: Asia Pacific USA Tank Trucking Market Revenue Share (%), by Country 2024 & 2032
List of Tables
- Table 1: Global USA Tank Trucking Market Revenue Million Forecast, by Region 2019 & 2032
- Table 2: Global USA Tank Trucking Market Revenue Million Forecast, by Fleet Type 2019 & 2032
- Table 3: Global USA Tank Trucking Market Revenue Million Forecast, by Capacity 2019 & 2032
- Table 4: Global USA Tank Trucking Market Revenue Million Forecast, by Product Category 2019 & 2032
- Table 5: Global USA Tank Trucking Market Revenue Million Forecast, by Region 2019 & 2032
- Table 6: Global USA Tank Trucking Market Revenue Million Forecast, by Country 2019 & 2032
- Table 7: Northeast USA Tank Trucking Market Revenue (Million) Forecast, by Application 2019 & 2032
- Table 8: Southeast USA Tank Trucking Market Revenue (Million) Forecast, by Application 2019 & 2032
- Table 9: Midwest USA Tank Trucking Market Revenue (Million) Forecast, by Application 2019 & 2032
- Table 10: Southwest USA Tank Trucking Market Revenue (Million) Forecast, by Application 2019 & 2032
- Table 11: West USA Tank Trucking Market Revenue (Million) Forecast, by Application 2019 & 2032
- Table 12: Global USA Tank Trucking Market Revenue Million Forecast, by Fleet Type 2019 & 2032
- Table 13: Global USA Tank Trucking Market Revenue Million Forecast, by Capacity 2019 & 2032
- Table 14: Global USA Tank Trucking Market Revenue Million Forecast, by Product Category 2019 & 2032
- Table 15: Global USA Tank Trucking Market Revenue Million Forecast, by Country 2019 & 2032
- Table 16: United States USA Tank Trucking Market Revenue (Million) Forecast, by Application 2019 & 2032
- Table 17: Canada USA Tank Trucking Market Revenue (Million) Forecast, by Application 2019 & 2032
- Table 18: Mexico USA Tank Trucking Market Revenue (Million) Forecast, by Application 2019 & 2032
- Table 19: Global USA Tank Trucking Market Revenue Million Forecast, by Fleet Type 2019 & 2032
- Table 20: Global USA Tank Trucking Market Revenue Million Forecast, by Capacity 2019 & 2032
- Table 21: Global USA Tank Trucking Market Revenue Million Forecast, by Product Category 2019 & 2032
- Table 22: Global USA Tank Trucking Market Revenue Million Forecast, by Country 2019 & 2032
- Table 23: Brazil USA Tank Trucking Market Revenue (Million) Forecast, by Application 2019 & 2032
- Table 24: Argentina USA Tank Trucking Market Revenue (Million) Forecast, by Application 2019 & 2032
- Table 25: Rest of South America USA Tank Trucking Market Revenue (Million) Forecast, by Application 2019 & 2032
- Table 26: Global USA Tank Trucking Market Revenue Million Forecast, by Fleet Type 2019 & 2032
- Table 27: Global USA Tank Trucking Market Revenue Million Forecast, by Capacity 2019 & 2032
- Table 28: Global USA Tank Trucking Market Revenue Million Forecast, by Product Category 2019 & 2032
- Table 29: Global USA Tank Trucking Market Revenue Million Forecast, by Country 2019 & 2032
- Table 30: United Kingdom USA Tank Trucking Market Revenue (Million) Forecast, by Application 2019 & 2032
- Table 31: Germany USA Tank Trucking Market Revenue (Million) Forecast, by Application 2019 & 2032
- Table 32: France USA Tank Trucking Market Revenue (Million) Forecast, by Application 2019 & 2032
- Table 33: Italy USA Tank Trucking Market Revenue (Million) Forecast, by Application 2019 & 2032
- Table 34: Spain USA Tank Trucking Market Revenue (Million) Forecast, by Application 2019 & 2032
- Table 35: Russia USA Tank Trucking Market Revenue (Million) Forecast, by Application 2019 & 2032
- Table 36: Benelux USA Tank Trucking Market Revenue (Million) Forecast, by Application 2019 & 2032
- Table 37: Nordics USA Tank Trucking Market Revenue (Million) Forecast, by Application 2019 & 2032
- Table 38: Rest of Europe USA Tank Trucking Market Revenue (Million) Forecast, by Application 2019 & 2032
- Table 39: Global USA Tank Trucking Market Revenue Million Forecast, by Fleet Type 2019 & 2032
- Table 40: Global USA Tank Trucking Market Revenue Million Forecast, by Capacity 2019 & 2032
- Table 41: Global USA Tank Trucking Market Revenue Million Forecast, by Product Category 2019 & 2032
- Table 42: Global USA Tank Trucking Market Revenue Million Forecast, by Country 2019 & 2032
- Table 43: Turkey USA Tank Trucking Market Revenue (Million) Forecast, by Application 2019 & 2032
- Table 44: Israel USA Tank Trucking Market Revenue (Million) Forecast, by Application 2019 & 2032
- Table 45: GCC USA Tank Trucking Market Revenue (Million) Forecast, by Application 2019 & 2032
- Table 46: North Africa USA Tank Trucking Market Revenue (Million) Forecast, by Application 2019 & 2032
- Table 47: South Africa USA Tank Trucking Market Revenue (Million) Forecast, by Application 2019 & 2032
- Table 48: Rest of Middle East & Africa USA Tank Trucking Market Revenue (Million) Forecast, by Application 2019 & 2032
- Table 49: Global USA Tank Trucking Market Revenue Million Forecast, by Fleet Type 2019 & 2032
- Table 50: Global USA Tank Trucking Market Revenue Million Forecast, by Capacity 2019 & 2032
- Table 51: Global USA Tank Trucking Market Revenue Million Forecast, by Product Category 2019 & 2032
- Table 52: Global USA Tank Trucking Market Revenue Million Forecast, by Country 2019 & 2032
- Table 53: China USA Tank Trucking Market Revenue (Million) Forecast, by Application 2019 & 2032
- Table 54: India USA Tank Trucking Market Revenue (Million) Forecast, by Application 2019 & 2032
- Table 55: Japan USA Tank Trucking Market Revenue (Million) Forecast, by Application 2019 & 2032
- Table 56: South Korea USA Tank Trucking Market Revenue (Million) Forecast, by Application 2019 & 2032
- Table 57: ASEAN USA Tank Trucking Market Revenue (Million) Forecast, by Application 2019 & 2032
- Table 58: Oceania USA Tank Trucking Market Revenue (Million) Forecast, by Application 2019 & 2032
- Table 59: Rest of Asia Pacific USA Tank Trucking Market Revenue (Million) Forecast, by Application 2019 & 2032
Frequently Asked Questions
1. What is the projected Compound Annual Growth Rate (CAGR) of the USA Tank Trucking Market?
The projected CAGR is approximately 3.42%.
2. Which companies are prominent players in the USA Tank Trucking Market?
Key companies in the market include Trimac Transportation Inc, Foodliner/Quest Liner Inc, Tankstar USA, Superior Bulk Logistics Inc, Miller Transporters Inc, Groendyke Transport Inc, Martin Transport Inc, Florida Rock & Tank Lines Inc **List Not Exhaustive 7 3 Other Companies (Slay Transportation Co Inc Apex Logistics LLC Mission Petroleum Carriers Genox Transportation Inc J&M Tank Lines Inc CLI Transport LP Tidewater Transit Co Inc Herman R Ewell Inc Service Transport Company Schilli Bulk Carriers Group Andrews Logistics and CTL Transportation LLC, Eagle Transport Corp, Ruan Transportation Management Systems, Kenan Advantage Group, Dupre Logistics LLC.
3. What are the main segments of the USA Tank Trucking Market?
The market segments include Fleet Type, Capacity, Product Category.
4. Can you provide details about the market size?
The market size is estimated to be USD 59.69 Million as of 2022.
5. What are some drivers contributing to market growth?
Rise in Demand for Oil and Natural Gas; Technological Advancements.
6. What are the notable trends driving market growth?
Fuel Tank Trailers as Petroleum Carriers are Boosting the Market's Growth in the United States.
7. Are there any restraints impacting market growth?
Increasing Regulatory Burden and Compliance Costs; Volatility of Fuel Prices.
8. Can you provide examples of recent developments in the market?
February 2024: Kenan Advantage Group, the largest tank truck transporter and logistics provider in North America, acquired Northern Dry Bulk, a company specializing in the transportation and storage of plastic resins for clients in the automotive, packaging, and electronics sectors across the United States and Canada. This acquisition brought 36 tractors, 91 trailers, and two terminals with two maintenance bays, along with warehouse space and trans-loading capabilities, into the KAG portfolio.
9. What pricing options are available for accessing the report?
Pricing options include single-user, multi-user, and enterprise licenses priced at USD 3800, USD 4500, and USD 5800 respectively.
10. Is the market size provided in terms of value or volume?
The market size is provided in terms of value, measured in Million.
11. Are there any specific market keywords associated with the report?
Yes, the market keyword associated with the report is "USA Tank Trucking Market," which aids in identifying and referencing the specific market segment covered.
12. How do I determine which pricing option suits my needs best?
The pricing options vary based on user requirements and access needs. Individual users may opt for single-user licenses, while businesses requiring broader access may choose multi-user or enterprise licenses for cost-effective access to the report.
13. Are there any additional resources or data provided in the USA Tank Trucking Market report?
While the report offers comprehensive insights, it's advisable to review the specific contents or supplementary materials provided to ascertain if additional resources or data are available.
14. How can I stay updated on further developments or reports in the USA Tank Trucking Market?
To stay informed about further developments, trends, and reports in the USA Tank Trucking Market, consider subscribing to industry newsletters, following relevant companies and organizations, or regularly checking reputable industry news sources and publications.
Methodology
Step 1 - Identification of Relevant Samples Size from Population Database


Step 2 - Approaches for Defining Global Market Size (Value, Volume* & Price*)

Note*: In applicable scenarios
Step 3 - Data Sources
Primary Research
- Web Analytics
- Survey Reports
- Research Institute
- Latest Research Reports
- Opinion Leaders
Secondary Research
- Annual Reports
- White Paper
- Latest Press Release
- Industry Association
- Paid Database
- Investor Presentations

Step 4 - Data Triangulation
Involves using different sources of information in order to increase the validity of a study
These sources are likely to be stakeholders in a program - participants, other researchers, program staff, other community members, and so on.
Then we put all data in single framework & apply various statistical tools to find out the dynamic on the market.
During the analysis stage, feedback from the stakeholder groups would be compared to determine areas of agreement as well as areas of divergence
