

Key Insights
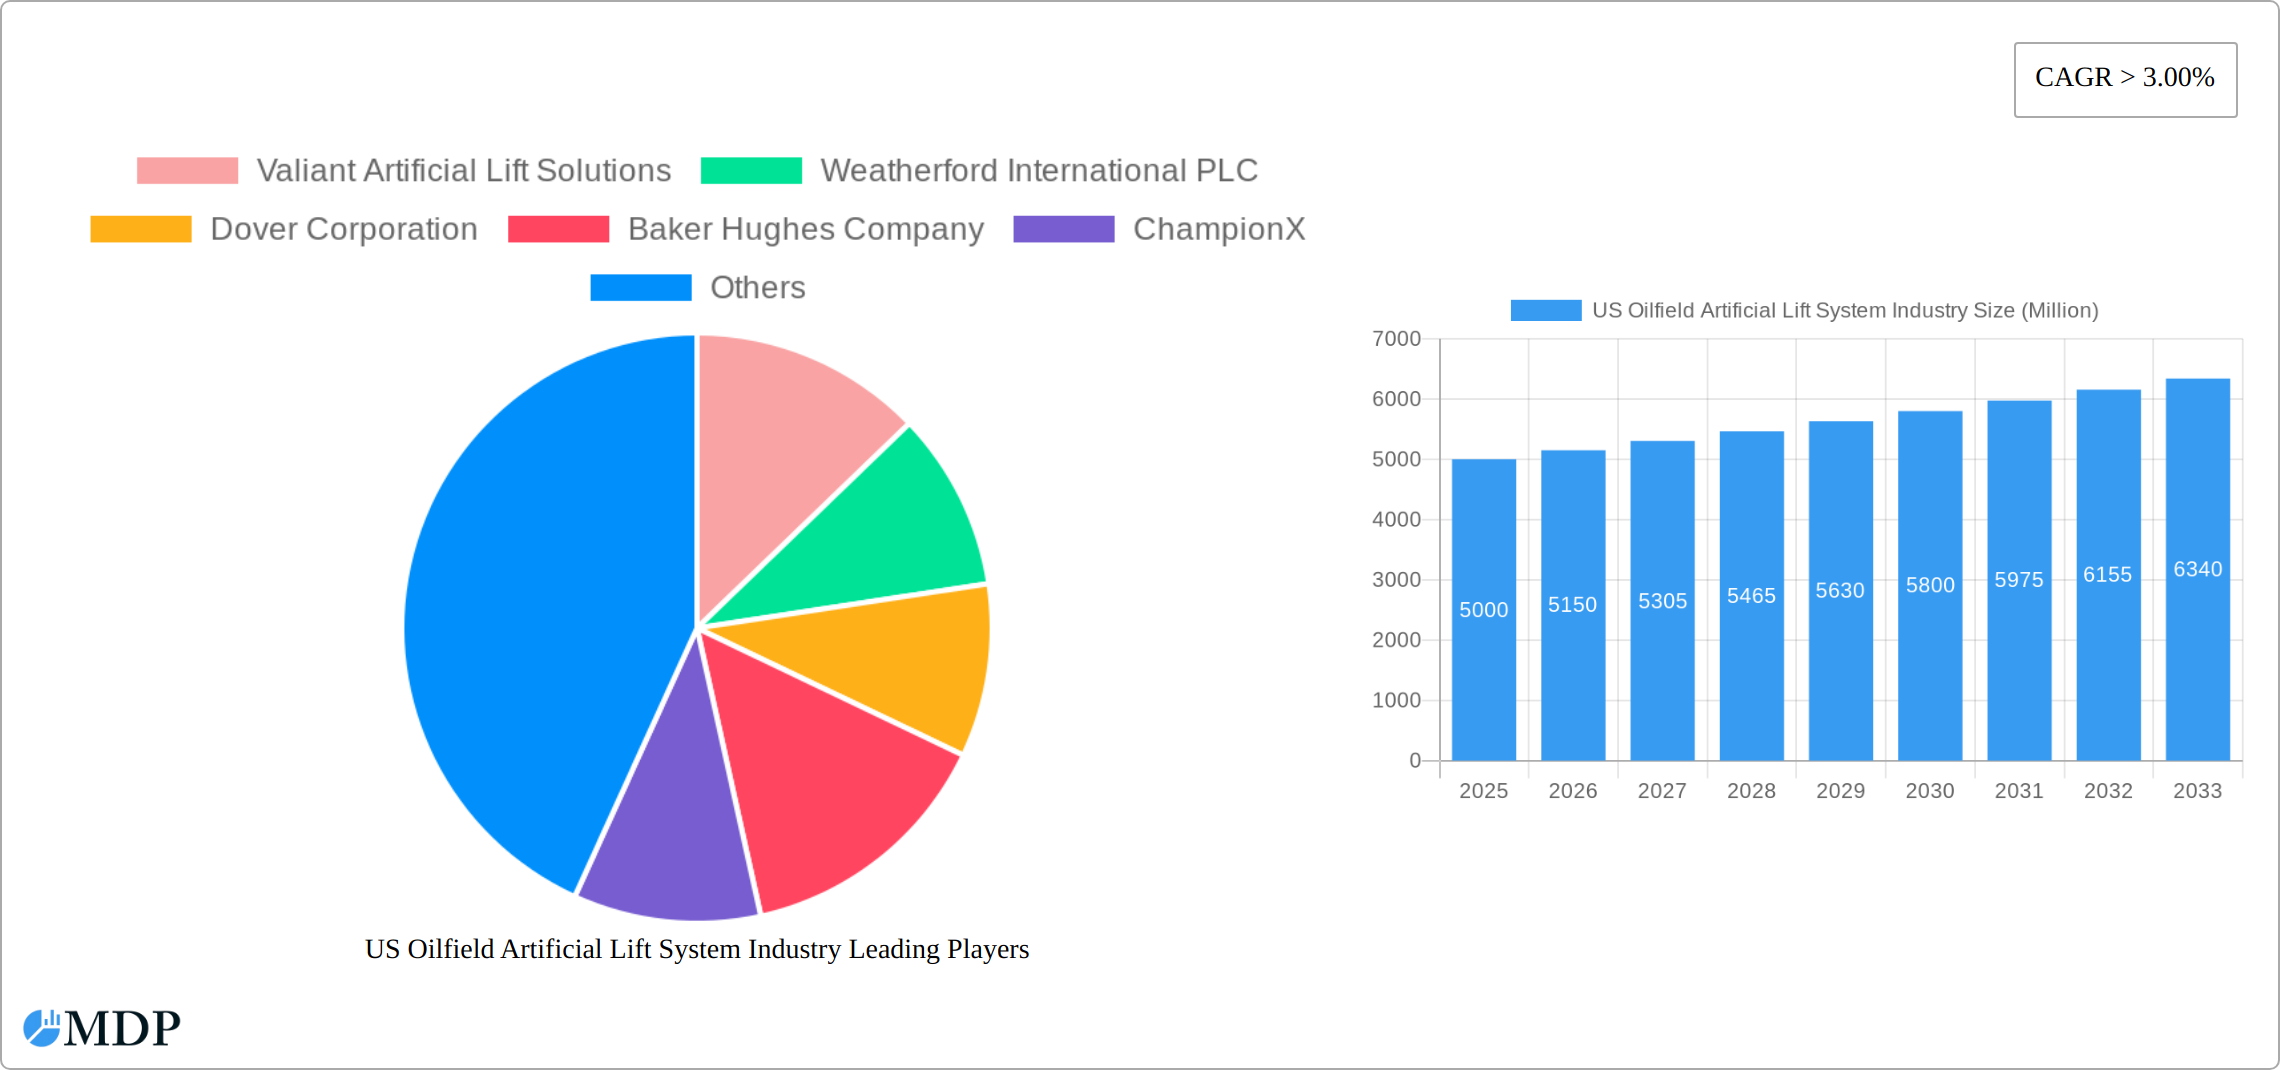
The US oilfield artificial lift system market, valued at approximately $5 billion in 2025, is experiencing robust growth, projected to maintain a CAGR exceeding 3% from 2025 to 2033. This expansion is driven by several key factors. Increasing oil and gas production, particularly from mature and challenging reservoirs, necessitates the deployment of advanced artificial lift technologies to enhance extraction efficiency. The ongoing shift towards automation and digitalization within the oil and gas sector is further fueling demand for sophisticated artificial lift systems capable of remote monitoring and control. Moreover, the sustained focus on improving operational efficiency and reducing operational costs is encouraging adoption of technologically advanced, energy-efficient solutions like electric submersible pumps (ESPs) over traditional methods. Regional variations exist, with onshore deployments currently dominating the market, although offshore activity is expected to gradually increase alongside investments in deepwater exploration and production.
The market segmentation reveals a dynamic landscape. Progressive Cavity Pumps (PCPs) and Electric Submersible Pumps (ESPs) represent significant portions of the market share, each catering to specific well conditions and operational requirements. Gas lift systems maintain a strong presence, while other artificial lift technologies, including hydraulic pumping systems, are experiencing niche growth. Competition is intense, with major players like Schlumberger, Halliburton, Baker Hughes, and Weatherford holding significant market share, alongside other established and emerging players. The competitive landscape is characterized by technological innovation, strategic acquisitions, and a focus on providing integrated artificial lift solutions that address the evolving needs of oil and gas operators across different geographical regions and well types. The Northeast and Southwest regions of the US are anticipated to showcase stronger growth compared to other regions due to their respective oil and gas production profiles and infrastructure development.
US Oilfield Artificial Lift System Industry Report: 2019-2033
This comprehensive report provides a detailed analysis of the US oilfield artificial lift system industry, offering valuable insights for stakeholders, investors, and industry professionals. Covering the period from 2019 to 2033, with a focus on 2025, this report analyzes market dynamics, trends, leading players, and future growth potential. The US Oilfield Artificial Lift System market is projected to reach xx Million by 2033, exhibiting a CAGR of xx% during the forecast period (2025-2033).
US Oilfield Artificial Lift System Industry Market Dynamics & Concentration
The US oilfield artificial lift system market is characterized by moderate concentration, with a few major players holding significant market share. The market share of the top five players is estimated to be around xx% in 2025. Innovation is a key driver, with companies constantly developing new technologies to improve efficiency and reduce costs. Stringent regulatory frameworks, particularly concerning environmental protection and worker safety, significantly influence market operations. Product substitutes, such as alternative well completion techniques, exert competitive pressure. End-user trends, driven by the need for enhanced production and reduced operational expenditure, shape demand. Mergers and acquisitions (M&A) activity is relatively frequent, with an estimated xx M&A deals in the historical period (2019-2024), reflecting consolidation and expansion efforts within the industry.
- Market Concentration: Top 5 players hold approximately xx% market share in 2025.
- Innovation Drivers: Development of advanced automation, improved energy efficiency, and reduced environmental impact technologies.
- Regulatory Framework: Stringent environmental regulations and safety standards impact operational costs and product development.
- Product Substitutes: Competition from alternative well completion and production enhancement methods.
- End-User Trends: Focus on maximizing production efficiency and minimizing operational costs.
- M&A Activity: xx M&A deals observed between 2019 and 2024.
US Oilfield Artificial Lift System Industry Industry Trends & Analysis
The US oilfield artificial lift system market is experiencing robust growth, driven by increasing oil and gas production activities and the ongoing need for enhanced oil recovery (EOR) techniques. Technological advancements, such as the adoption of smart artificial lift systems and automation, are significantly improving operational efficiency and reducing downtime. Consumer preference for sustainable and environmentally friendly solutions is pushing the market towards the development of energy-efficient systems with reduced emissions. Intense competition among established players and the emergence of new entrants are shaping market dynamics. The market is witnessing a shift towards more advanced and automated systems, increasing market penetration of smart technologies. This trend is expected to continue, with a projected CAGR of xx% during the forecast period (2025-2033), driven primarily by technological advancements and increasing demand from the oil and gas industry.

Leading Markets & Segments in US Oilfield Artificial Lift System Industry
The onshore segment currently dominates the US oilfield artificial lift system market, accounting for approximately xx% of the total market value in 2025. This dominance is attributable to the larger number of onshore oil and gas wells compared to offshore wells. Among the different types of artificial lift systems, Electric Submersible Pumps (ESPs) hold the largest market share, followed by Progressive Cavity Pumps (PCPs) and Gas Lift Systems.
- Onshore Dominance: Larger number of onshore wells, lower installation and operational costs.
- ESP Market Leadership: High efficiency, reliable performance, and suitability for various well conditions.
- PCP Significant Share: Robustness, versatility in handling high viscosity fluids, and relatively low maintenance needs.
- Gas Lift Growth Potential: Increasing application in gas-rich wells and improved efficiency technologies.
Key Drivers:
- Economic Policies: Government incentives and tax benefits promoting oil and gas exploration.
- Infrastructure Development: Expansion of oil and gas pipelines and transportation infrastructure.
- Technological Advancements: Continuous innovation in artificial lift technologies, leading to higher efficiency and reduced operational costs.
US Oilfield Artificial Lift System Industry Product Developments
Recent product innovations focus on enhancing system efficiency, reliability, and environmental sustainability. Smart artificial lift systems, incorporating advanced sensors and data analytics, are gaining traction, offering real-time monitoring and optimized performance. New materials and designs are improving durability and extending system lifespan. These advancements are improving market fit by offering operators greater control, reduced maintenance, and improved environmental performance.
Key Drivers of US Oilfield Artificial Lift System Industry Growth
The growth of the US oilfield artificial lift system industry is propelled by several key factors. Firstly, the continuous increase in oil and gas production necessitates efficient and reliable artificial lift solutions. Secondly, technological advancements leading to the development of more efficient and cost-effective systems contribute to market expansion. Lastly, favorable government policies and regulations supporting domestic energy production further stimulate industry growth.
Challenges in the US Oilfield Artificial Lift System Industry Market
The industry faces challenges such as fluctuating oil and gas prices, impacting investment decisions and project profitability. Supply chain disruptions, particularly in sourcing critical components, can lead to project delays and increased costs. Furthermore, intense competition among industry players creates pressure on pricing and profitability. These factors combine to present significant operational hurdles.
Emerging Opportunities in US Oilfield Artificial Lift System Industry
Significant opportunities exist for industry players to capitalize on technological advancements, particularly in areas like artificial intelligence and machine learning, to enhance system performance and efficiency. Strategic partnerships and collaborations can facilitate technological innovation and market expansion. The growing demand for sustainable energy solutions presents a significant opportunity for the development and deployment of environmentally friendly artificial lift systems.
Leading Players in the US Oilfield Artificial Lift System Industry Sector
- Valiant Artificial Lift Solutions
- Weatherford International PLC
- Dover Corporation
- Baker Hughes Company
- ChampionX
- Halliburton Company
- Schlumberger Limited
- NOV Inc
- JJ Tech
- KBA Engineering
Key Milestones in US Oilfield Artificial Lift System Industry Industry
- September 2021: Vine Energy contracts Baker Hughes for ProductionLink Edge deployment across 100 Haynesville Shale wells, showcasing the adoption of advanced analytics and smart edge technology for production optimization and methane emission reduction.
Strategic Outlook for US Oilfield Artificial Lift System Industry Market
The future of the US oilfield artificial lift system market is promising, driven by continuous technological advancements, increasing demand for efficient oil and gas production, and the growing adoption of sustainable practices. Strategic opportunities lie in developing innovative solutions, focusing on automation, and exploring strategic partnerships to consolidate market share and enhance operational efficiency. The market is poised for sustained growth, driven by technological innovation and a focus on sustainable energy solutions.
US Oilfield Artificial Lift System Industry Segmentation
-
1. Type
- 1.1. Progressive Cavity Pumps (PCP)
- 1.2. Electric Submersible Pumps (ESP)
- 1.3. Gas Lift Systems
- 1.4. Other Types
-
2. Area of Deployment
- 2.1. Onshore
- 2.2. Offshore
US Oilfield Artificial Lift System Industry Segmentation By Geography
-
1. North America
- 1.1. United States
- 1.2. Canada
- 1.3. Mexico
-
2. South America
- 2.1. Brazil
- 2.2. Argentina
- 2.3. Rest of South America
-
3. Europe
- 3.1. United Kingdom
- 3.2. Germany
- 3.3. France
- 3.4. Italy
- 3.5. Spain
- 3.6. Russia
- 3.7. Benelux
- 3.8. Nordics
- 3.9. Rest of Europe
-
4. Middle East & Africa
- 4.1. Turkey
- 4.2. Israel
- 4.3. GCC
- 4.4. North Africa
- 4.5. South Africa
- 4.6. Rest of Middle East & Africa
-
5. Asia Pacific
- 5.1. China
- 5.2. India
- 5.3. Japan
- 5.4. South Korea
- 5.5. ASEAN
- 5.6. Oceania
- 5.7. Rest of Asia Pacific

US Oilfield Artificial Lift System Industry REPORT HIGHLIGHTS
| Aspects | Details |
|---|---|
| Study Period | 2019-2033 |
| Base Year | 2024 |
| Estimated Year | 2025 |
| Forecast Period | 2025-2033 |
| Historical Period | 2019-2024 |
| Growth Rate | CAGR of > 3.00% from 2019-2033 |
| Segmentation |
|
Table of Contents
- 1. Introduction
- 1.1. Research Scope
- 1.2. Market Segmentation
- 1.3. Research Methodology
- 1.4. Definitions and Assumptions
- 2. Executive Summary
- 2.1. Introduction
- 3. Market Dynamics
- 3.1. Introduction
- 3.2. Market Drivers
- 3.2.1. 4.; Declining Cost of Solar PV Installations4.; Supportive Government Policies For Renewable Energy
- 3.3. Market Restrains
- 3.3.1. 4.; Penetration of Other Energy Sources
- 3.4. Market Trends
- 3.4.1. Offshore Segment to Witness Significant Growth
- 4. Market Factor Analysis
- 4.1. Porters Five Forces
- 4.2. Supply/Value Chain
- 4.3. PESTEL analysis
- 4.4. Market Entropy
- 4.5. Patent/Trademark Analysis
- 5. Global US Oilfield Artificial Lift System Industry Analysis, Insights and Forecast, 2019-2031
- 5.1. Market Analysis, Insights and Forecast - by Type
- 5.1.1. Progressive Cavity Pumps (PCP)
- 5.1.2. Electric Submersible Pumps (ESP)
- 5.1.3. Gas Lift Systems
- 5.1.4. Other Types
- 5.2. Market Analysis, Insights and Forecast - by Area of Deployment
- 5.2.1. Onshore
- 5.2.2. Offshore
- 5.3. Market Analysis, Insights and Forecast - by Region
- 5.3.1. North America
- 5.3.2. South America
- 5.3.3. Europe
- 5.3.4. Middle East & Africa
- 5.3.5. Asia Pacific
- 5.1. Market Analysis, Insights and Forecast - by Type
- 6. North America US Oilfield Artificial Lift System Industry Analysis, Insights and Forecast, 2019-2031
- 6.1. Market Analysis, Insights and Forecast - by Type
- 6.1.1. Progressive Cavity Pumps (PCP)
- 6.1.2. Electric Submersible Pumps (ESP)
- 6.1.3. Gas Lift Systems
- 6.1.4. Other Types
- 6.2. Market Analysis, Insights and Forecast - by Area of Deployment
- 6.2.1. Onshore
- 6.2.2. Offshore
- 6.1. Market Analysis, Insights and Forecast - by Type
- 7. South America US Oilfield Artificial Lift System Industry Analysis, Insights and Forecast, 2019-2031
- 7.1. Market Analysis, Insights and Forecast - by Type
- 7.1.1. Progressive Cavity Pumps (PCP)
- 7.1.2. Electric Submersible Pumps (ESP)
- 7.1.3. Gas Lift Systems
- 7.1.4. Other Types
- 7.2. Market Analysis, Insights and Forecast - by Area of Deployment
- 7.2.1. Onshore
- 7.2.2. Offshore
- 7.1. Market Analysis, Insights and Forecast - by Type
- 8. Europe US Oilfield Artificial Lift System Industry Analysis, Insights and Forecast, 2019-2031
- 8.1. Market Analysis, Insights and Forecast - by Type
- 8.1.1. Progressive Cavity Pumps (PCP)
- 8.1.2. Electric Submersible Pumps (ESP)
- 8.1.3. Gas Lift Systems
- 8.1.4. Other Types
- 8.2. Market Analysis, Insights and Forecast - by Area of Deployment
- 8.2.1. Onshore
- 8.2.2. Offshore
- 8.1. Market Analysis, Insights and Forecast - by Type
- 9. Middle East & Africa US Oilfield Artificial Lift System Industry Analysis, Insights and Forecast, 2019-2031
- 9.1. Market Analysis, Insights and Forecast - by Type
- 9.1.1. Progressive Cavity Pumps (PCP)
- 9.1.2. Electric Submersible Pumps (ESP)
- 9.1.3. Gas Lift Systems
- 9.1.4. Other Types
- 9.2. Market Analysis, Insights and Forecast - by Area of Deployment
- 9.2.1. Onshore
- 9.2.2. Offshore
- 9.1. Market Analysis, Insights and Forecast - by Type
- 10. Asia Pacific US Oilfield Artificial Lift System Industry Analysis, Insights and Forecast, 2019-2031
- 10.1. Market Analysis, Insights and Forecast - by Type
- 10.1.1. Progressive Cavity Pumps (PCP)
- 10.1.2. Electric Submersible Pumps (ESP)
- 10.1.3. Gas Lift Systems
- 10.1.4. Other Types
- 10.2. Market Analysis, Insights and Forecast - by Area of Deployment
- 10.2.1. Onshore
- 10.2.2. Offshore
- 10.1. Market Analysis, Insights and Forecast - by Type
- 11. Northeast US Oilfield Artificial Lift System Industry Analysis, Insights and Forecast, 2019-2031
- 12. Southeast US Oilfield Artificial Lift System Industry Analysis, Insights and Forecast, 2019-2031
- 13. Midwest US Oilfield Artificial Lift System Industry Analysis, Insights and Forecast, 2019-2031
- 14. Southwest US Oilfield Artificial Lift System Industry Analysis, Insights and Forecast, 2019-2031
- 15. West US Oilfield Artificial Lift System Industry Analysis, Insights and Forecast, 2019-2031
- 16. Competitive Analysis
- 16.1. Global Market Share Analysis 2024
- 16.2. Company Profiles
- 16.2.1 Valiant Artificial Lift Solutions
- 16.2.1.1. Overview
- 16.2.1.2. Products
- 16.2.1.3. SWOT Analysis
- 16.2.1.4. Recent Developments
- 16.2.1.5. Financials (Based on Availability)
- 16.2.2 Weatherford International PLC
- 16.2.2.1. Overview
- 16.2.2.2. Products
- 16.2.2.3. SWOT Analysis
- 16.2.2.4. Recent Developments
- 16.2.2.5. Financials (Based on Availability)
- 16.2.3 Dover Corporation
- 16.2.3.1. Overview
- 16.2.3.2. Products
- 16.2.3.3. SWOT Analysis
- 16.2.3.4. Recent Developments
- 16.2.3.5. Financials (Based on Availability)
- 16.2.4 Baker Hughes Company
- 16.2.4.1. Overview
- 16.2.4.2. Products
- 16.2.4.3. SWOT Analysis
- 16.2.4.4. Recent Developments
- 16.2.4.5. Financials (Based on Availability)
- 16.2.5 ChampionX
- 16.2.5.1. Overview
- 16.2.5.2. Products
- 16.2.5.3. SWOT Analysis
- 16.2.5.4. Recent Developments
- 16.2.5.5. Financials (Based on Availability)
- 16.2.6 Halliburton Company
- 16.2.6.1. Overview
- 16.2.6.2. Products
- 16.2.6.3. SWOT Analysis
- 16.2.6.4. Recent Developments
- 16.2.6.5. Financials (Based on Availability)
- 16.2.7 Schlumberger Limited
- 16.2.7.1. Overview
- 16.2.7.2. Products
- 16.2.7.3. SWOT Analysis
- 16.2.7.4. Recent Developments
- 16.2.7.5. Financials (Based on Availability)
- 16.2.8 NOV Inc
- 16.2.8.1. Overview
- 16.2.8.2. Products
- 16.2.8.3. SWOT Analysis
- 16.2.8.4. Recent Developments
- 16.2.8.5. Financials (Based on Availability)
- 16.2.9 JJ Tech
- 16.2.9.1. Overview
- 16.2.9.2. Products
- 16.2.9.3. SWOT Analysis
- 16.2.9.4. Recent Developments
- 16.2.9.5. Financials (Based on Availability)
- 16.2.10 KBA Engineering
- 16.2.10.1. Overview
- 16.2.10.2. Products
- 16.2.10.3. SWOT Analysis
- 16.2.10.4. Recent Developments
- 16.2.10.5. Financials (Based on Availability)
- 16.2.1 Valiant Artificial Lift Solutions
List of Figures
- Figure 1: Global US Oilfield Artificial Lift System Industry Revenue Breakdown (Million, %) by Region 2024 & 2032
- Figure 2: United states US Oilfield Artificial Lift System Industry Revenue (Million), by Country 2024 & 2032
- Figure 3: United states US Oilfield Artificial Lift System Industry Revenue Share (%), by Country 2024 & 2032
- Figure 4: North America US Oilfield Artificial Lift System Industry Revenue (Million), by Type 2024 & 2032
- Figure 5: North America US Oilfield Artificial Lift System Industry Revenue Share (%), by Type 2024 & 2032
- Figure 6: North America US Oilfield Artificial Lift System Industry Revenue (Million), by Area of Deployment 2024 & 2032
- Figure 7: North America US Oilfield Artificial Lift System Industry Revenue Share (%), by Area of Deployment 2024 & 2032
- Figure 8: North America US Oilfield Artificial Lift System Industry Revenue (Million), by Country 2024 & 2032
- Figure 9: North America US Oilfield Artificial Lift System Industry Revenue Share (%), by Country 2024 & 2032
- Figure 10: South America US Oilfield Artificial Lift System Industry Revenue (Million), by Type 2024 & 2032
- Figure 11: South America US Oilfield Artificial Lift System Industry Revenue Share (%), by Type 2024 & 2032
- Figure 12: South America US Oilfield Artificial Lift System Industry Revenue (Million), by Area of Deployment 2024 & 2032
- Figure 13: South America US Oilfield Artificial Lift System Industry Revenue Share (%), by Area of Deployment 2024 & 2032
- Figure 14: South America US Oilfield Artificial Lift System Industry Revenue (Million), by Country 2024 & 2032
- Figure 15: South America US Oilfield Artificial Lift System Industry Revenue Share (%), by Country 2024 & 2032
- Figure 16: Europe US Oilfield Artificial Lift System Industry Revenue (Million), by Type 2024 & 2032
- Figure 17: Europe US Oilfield Artificial Lift System Industry Revenue Share (%), by Type 2024 & 2032
- Figure 18: Europe US Oilfield Artificial Lift System Industry Revenue (Million), by Area of Deployment 2024 & 2032
- Figure 19: Europe US Oilfield Artificial Lift System Industry Revenue Share (%), by Area of Deployment 2024 & 2032
- Figure 20: Europe US Oilfield Artificial Lift System Industry Revenue (Million), by Country 2024 & 2032
- Figure 21: Europe US Oilfield Artificial Lift System Industry Revenue Share (%), by Country 2024 & 2032
- Figure 22: Middle East & Africa US Oilfield Artificial Lift System Industry Revenue (Million), by Type 2024 & 2032
- Figure 23: Middle East & Africa US Oilfield Artificial Lift System Industry Revenue Share (%), by Type 2024 & 2032
- Figure 24: Middle East & Africa US Oilfield Artificial Lift System Industry Revenue (Million), by Area of Deployment 2024 & 2032
- Figure 25: Middle East & Africa US Oilfield Artificial Lift System Industry Revenue Share (%), by Area of Deployment 2024 & 2032
- Figure 26: Middle East & Africa US Oilfield Artificial Lift System Industry Revenue (Million), by Country 2024 & 2032
- Figure 27: Middle East & Africa US Oilfield Artificial Lift System Industry Revenue Share (%), by Country 2024 & 2032
- Figure 28: Asia Pacific US Oilfield Artificial Lift System Industry Revenue (Million), by Type 2024 & 2032
- Figure 29: Asia Pacific US Oilfield Artificial Lift System Industry Revenue Share (%), by Type 2024 & 2032
- Figure 30: Asia Pacific US Oilfield Artificial Lift System Industry Revenue (Million), by Area of Deployment 2024 & 2032
- Figure 31: Asia Pacific US Oilfield Artificial Lift System Industry Revenue Share (%), by Area of Deployment 2024 & 2032
- Figure 32: Asia Pacific US Oilfield Artificial Lift System Industry Revenue (Million), by Country 2024 & 2032
- Figure 33: Asia Pacific US Oilfield Artificial Lift System Industry Revenue Share (%), by Country 2024 & 2032
List of Tables
- Table 1: Global US Oilfield Artificial Lift System Industry Revenue Million Forecast, by Region 2019 & 2032
- Table 2: Global US Oilfield Artificial Lift System Industry Revenue Million Forecast, by Type 2019 & 2032
- Table 3: Global US Oilfield Artificial Lift System Industry Revenue Million Forecast, by Area of Deployment 2019 & 2032
- Table 4: Global US Oilfield Artificial Lift System Industry Revenue Million Forecast, by Region 2019 & 2032
- Table 5: Global US Oilfield Artificial Lift System Industry Revenue Million Forecast, by Country 2019 & 2032
- Table 6: Northeast US Oilfield Artificial Lift System Industry Revenue (Million) Forecast, by Application 2019 & 2032
- Table 7: Southeast US Oilfield Artificial Lift System Industry Revenue (Million) Forecast, by Application 2019 & 2032
- Table 8: Midwest US Oilfield Artificial Lift System Industry Revenue (Million) Forecast, by Application 2019 & 2032
- Table 9: Southwest US Oilfield Artificial Lift System Industry Revenue (Million) Forecast, by Application 2019 & 2032
- Table 10: West US Oilfield Artificial Lift System Industry Revenue (Million) Forecast, by Application 2019 & 2032
- Table 11: Global US Oilfield Artificial Lift System Industry Revenue Million Forecast, by Type 2019 & 2032
- Table 12: Global US Oilfield Artificial Lift System Industry Revenue Million Forecast, by Area of Deployment 2019 & 2032
- Table 13: Global US Oilfield Artificial Lift System Industry Revenue Million Forecast, by Country 2019 & 2032
- Table 14: United States US Oilfield Artificial Lift System Industry Revenue (Million) Forecast, by Application 2019 & 2032
- Table 15: Canada US Oilfield Artificial Lift System Industry Revenue (Million) Forecast, by Application 2019 & 2032
- Table 16: Mexico US Oilfield Artificial Lift System Industry Revenue (Million) Forecast, by Application 2019 & 2032
- Table 17: Global US Oilfield Artificial Lift System Industry Revenue Million Forecast, by Type 2019 & 2032
- Table 18: Global US Oilfield Artificial Lift System Industry Revenue Million Forecast, by Area of Deployment 2019 & 2032
- Table 19: Global US Oilfield Artificial Lift System Industry Revenue Million Forecast, by Country 2019 & 2032
- Table 20: Brazil US Oilfield Artificial Lift System Industry Revenue (Million) Forecast, by Application 2019 & 2032
- Table 21: Argentina US Oilfield Artificial Lift System Industry Revenue (Million) Forecast, by Application 2019 & 2032
- Table 22: Rest of South America US Oilfield Artificial Lift System Industry Revenue (Million) Forecast, by Application 2019 & 2032
- Table 23: Global US Oilfield Artificial Lift System Industry Revenue Million Forecast, by Type 2019 & 2032
- Table 24: Global US Oilfield Artificial Lift System Industry Revenue Million Forecast, by Area of Deployment 2019 & 2032
- Table 25: Global US Oilfield Artificial Lift System Industry Revenue Million Forecast, by Country 2019 & 2032
- Table 26: United Kingdom US Oilfield Artificial Lift System Industry Revenue (Million) Forecast, by Application 2019 & 2032
- Table 27: Germany US Oilfield Artificial Lift System Industry Revenue (Million) Forecast, by Application 2019 & 2032
- Table 28: France US Oilfield Artificial Lift System Industry Revenue (Million) Forecast, by Application 2019 & 2032
- Table 29: Italy US Oilfield Artificial Lift System Industry Revenue (Million) Forecast, by Application 2019 & 2032
- Table 30: Spain US Oilfield Artificial Lift System Industry Revenue (Million) Forecast, by Application 2019 & 2032
- Table 31: Russia US Oilfield Artificial Lift System Industry Revenue (Million) Forecast, by Application 2019 & 2032
- Table 32: Benelux US Oilfield Artificial Lift System Industry Revenue (Million) Forecast, by Application 2019 & 2032
- Table 33: Nordics US Oilfield Artificial Lift System Industry Revenue (Million) Forecast, by Application 2019 & 2032
- Table 34: Rest of Europe US Oilfield Artificial Lift System Industry Revenue (Million) Forecast, by Application 2019 & 2032
- Table 35: Global US Oilfield Artificial Lift System Industry Revenue Million Forecast, by Type 2019 & 2032
- Table 36: Global US Oilfield Artificial Lift System Industry Revenue Million Forecast, by Area of Deployment 2019 & 2032
- Table 37: Global US Oilfield Artificial Lift System Industry Revenue Million Forecast, by Country 2019 & 2032
- Table 38: Turkey US Oilfield Artificial Lift System Industry Revenue (Million) Forecast, by Application 2019 & 2032
- Table 39: Israel US Oilfield Artificial Lift System Industry Revenue (Million) Forecast, by Application 2019 & 2032
- Table 40: GCC US Oilfield Artificial Lift System Industry Revenue (Million) Forecast, by Application 2019 & 2032
- Table 41: North Africa US Oilfield Artificial Lift System Industry Revenue (Million) Forecast, by Application 2019 & 2032
- Table 42: South Africa US Oilfield Artificial Lift System Industry Revenue (Million) Forecast, by Application 2019 & 2032
- Table 43: Rest of Middle East & Africa US Oilfield Artificial Lift System Industry Revenue (Million) Forecast, by Application 2019 & 2032
- Table 44: Global US Oilfield Artificial Lift System Industry Revenue Million Forecast, by Type 2019 & 2032
- Table 45: Global US Oilfield Artificial Lift System Industry Revenue Million Forecast, by Area of Deployment 2019 & 2032
- Table 46: Global US Oilfield Artificial Lift System Industry Revenue Million Forecast, by Country 2019 & 2032
- Table 47: China US Oilfield Artificial Lift System Industry Revenue (Million) Forecast, by Application 2019 & 2032
- Table 48: India US Oilfield Artificial Lift System Industry Revenue (Million) Forecast, by Application 2019 & 2032
- Table 49: Japan US Oilfield Artificial Lift System Industry Revenue (Million) Forecast, by Application 2019 & 2032
- Table 50: South Korea US Oilfield Artificial Lift System Industry Revenue (Million) Forecast, by Application 2019 & 2032
- Table 51: ASEAN US Oilfield Artificial Lift System Industry Revenue (Million) Forecast, by Application 2019 & 2032
- Table 52: Oceania US Oilfield Artificial Lift System Industry Revenue (Million) Forecast, by Application 2019 & 2032
- Table 53: Rest of Asia Pacific US Oilfield Artificial Lift System Industry Revenue (Million) Forecast, by Application 2019 & 2032
Frequently Asked Questions
1. What is the projected Compound Annual Growth Rate (CAGR) of the US Oilfield Artificial Lift System Industry?
The projected CAGR is approximately > 3.00%.
2. Which companies are prominent players in the US Oilfield Artificial Lift System Industry?
Key companies in the market include Valiant Artificial Lift Solutions, Weatherford International PLC, Dover Corporation, Baker Hughes Company, ChampionX, Halliburton Company, Schlumberger Limited, NOV Inc, JJ Tech, KBA Engineering.
3. What are the main segments of the US Oilfield Artificial Lift System Industry?
The market segments include Type, Area of Deployment.
4. Can you provide details about the market size?
The market size is estimated to be USD XX Million as of 2022.
5. What are some drivers contributing to market growth?
4.; Declining Cost of Solar PV Installations4.; Supportive Government Policies For Renewable Energy.
6. What are the notable trends driving market growth?
Offshore Segment to Witness Significant Growth.
7. Are there any restraints impacting market growth?
4.; Penetration of Other Energy Sources.
8. Can you provide examples of recent developments in the market?
In September 2021, natural gas producer Vine Energy signed a contract with Baker Hughes to deploy its artificial lift solution, ProductionLink Edge, across 100 natural gas wells in Louisiana's Haynesville Shale. The automation solution uses advanced analytics and 'smart' edge technology to boost production and reduce associated methane emissions from oil and gas wells.
9. What pricing options are available for accessing the report?
Pricing options include single-user, multi-user, and enterprise licenses priced at USD 3800, USD 4500, and USD 5800 respectively.
10. Is the market size provided in terms of value or volume?
The market size is provided in terms of value, measured in Million.
11. Are there any specific market keywords associated with the report?
Yes, the market keyword associated with the report is "US Oilfield Artificial Lift System Industry," which aids in identifying and referencing the specific market segment covered.
12. How do I determine which pricing option suits my needs best?
The pricing options vary based on user requirements and access needs. Individual users may opt for single-user licenses, while businesses requiring broader access may choose multi-user or enterprise licenses for cost-effective access to the report.
13. Are there any additional resources or data provided in the US Oilfield Artificial Lift System Industry report?
While the report offers comprehensive insights, it's advisable to review the specific contents or supplementary materials provided to ascertain if additional resources or data are available.
14. How can I stay updated on further developments or reports in the US Oilfield Artificial Lift System Industry?
To stay informed about further developments, trends, and reports in the US Oilfield Artificial Lift System Industry, consider subscribing to industry newsletters, following relevant companies and organizations, or regularly checking reputable industry news sources and publications.
Methodology
Step 1 - Identification of Relevant Samples Size from Population Database


Step 2 - Approaches for Defining Global Market Size (Value, Volume* & Price*)

Note*: In applicable scenarios
Step 3 - Data Sources
Primary Research
- Web Analytics
- Survey Reports
- Research Institute
- Latest Research Reports
- Opinion Leaders
Secondary Research
- Annual Reports
- White Paper
- Latest Press Release
- Industry Association
- Paid Database
- Investor Presentations

Step 4 - Data Triangulation
Involves using different sources of information in order to increase the validity of a study
These sources are likely to be stakeholders in a program - participants, other researchers, program staff, other community members, and so on.
Then we put all data in single framework & apply various statistical tools to find out the dynamic on the market.
During the analysis stage, feedback from the stakeholder groups would be compared to determine areas of agreement as well as areas of divergence
