

Key Insights
The US electronic gadgets insurance market, valued at $19.58 billion in 2025, is projected to experience robust growth, exhibiting a Compound Annual Growth Rate (CAGR) of 11.54% from 2025 to 2033. This expansion is fueled by several key drivers. The increasing adoption of smartphones, laptops, and other electronic devices, coupled with their rising cost and vulnerability to damage, theft, and loss, significantly increases demand for insurance coverage. Furthermore, the growing awareness of the financial implications of device malfunction or loss, particularly amongst younger demographics heavily reliant on technology, is bolstering market penetration. The market is segmented by coverage type (accidental damage, theft and loss), device type (laptops, computers, cameras, mobile devices, drones), and end-users (corporate, individual). The corporate segment is expected to show strong growth due to the need to protect company assets and ensure business continuity. Competitive pressures among insurers are also driving innovation in policy offerings, including extended warranties and bundled services, further stimulating market expansion.
The market's growth trajectory is not without challenges. Restraints include the perception that insurance premiums are costly compared to self-insuring through savings, particularly for lower-value devices. However, this is counterbalanced by the growing understanding of the risks involved in device failure, as well as the emergence of affordable and comprehensive insurance plans. The North American region, specifically the United States, constitutes a significant portion of the market, primarily driven by high electronic device ownership rates and a robust insurance sector. Key players such as AIG, Progressive, Allianz Insurance, and Assurant Inc are actively competing, driving innovation and shaping the market landscape. The market's future success hinges on continued technological advancements in both devices and insurance offerings, along with a sustained focus on effective marketing and consumer education.

US Electronic Gadgets Insurance Market: A Comprehensive Report (2019-2033)
This in-depth report provides a comprehensive analysis of the US Electronic Gadgets Insurance Market, offering invaluable insights for industry stakeholders, investors, and strategic decision-makers. Covering the period 2019-2033, with a focus on 2025, this report delves into market dynamics, leading players, emerging trends, and future growth opportunities. The market is projected to reach xx Million by 2033, exhibiting a CAGR of xx% during the forecast period (2025-2033).
US Electronic Gadgets Insurance Market Market Dynamics & Concentration
The US Electronic Gadgets Insurance market presents a moderately concentrated landscape, with key players like AIG, Progressive, American Fidelity Assurance, Allianz Insurance, Aviva, AXA, Chubb, Assurant Inc, AT&T Inc, and Amica Mutual Insurance vying for market dominance. While precise figures for market concentration in 2025 are still emerging (replace "xx%" with the actual data), the market's composition reflects a blend of established giants and innovative newcomers. Continuous innovation is a crucial driver, with companies aggressively developing tailored insurance products and services to meet the evolving needs of consumers and the rapid advancements in technology. The regulatory environment plays a significant role, particularly regulations surrounding data privacy and consumer protection, which directly impact market operations. Competitive pressure arises from product substitutes such as self-insurance or manufacturer warranties. However, the ever-increasing adoption of electronic gadgets by both individual and corporate users is a potent force driving market expansion. Mergers and acquisitions (M&A) activity, while relatively moderate between 2019 and 2024 (replace "xx" with the actual number of deals), is projected to intensify, fueled by companies seeking to broaden their product portfolios and geographical reach. This expansion is likely to be characterized by strategic acquisitions of smaller, specialized firms offering niche products or technologies.
- Market Concentration (2025): [Insert Actual Percentage Here]
- Innovation Drivers: Development of specialized insurance products for drones, wearables, IoT devices, and other emerging technologies. Emphasis on personalized risk assessment through telematics and AI.
- Regulatory Landscape: Stringent compliance with data privacy regulations (e.g., CCPA, GDPR, state-specific regulations) and cybersecurity standards.
- Product Substitutes: Manufacturer warranties, extended warranties, self-insurance, and bundled service packages.
- End-User Trends: Growing demand from both individual consumers (driven by increasing gadget ownership) and corporate clients (covering employee devices and corporate assets).
- M&A Activity (2019-2024): [Insert Actual Number of Deals Here] Future projections suggest an increase in M&A activity.
US Electronic Gadgets Insurance Market Industry Trends & Analysis
The US Electronic Gadgets Insurance market exhibits robust growth, driven by several factors. The increasing penetration of electronic gadgets across all demographics is a key driver, coupled with rising consumer awareness of the risks associated with gadget damage or loss. Technological advancements, such as the Internet of Things (IoT), are enabling innovative insurance solutions, while evolving consumer preferences are shifting towards comprehensive coverage and seamless digital experiences. Competitive dynamics are characterized by innovation, product differentiation, and strategic partnerships. The market is experiencing a shift towards embedded insurance models, where insurance is integrated directly into the purchase of the electronic gadget. The CAGR for the period 2019-2024 was xx%, and market penetration is currently estimated at xx%. The forecast period (2025-2033) projects a CAGR of xx%, with potential for even higher growth depending on technological developments and evolving consumer behavior.

Leading Markets & Segments in US Electronic Gadgets Insurance Market
The US Electronic Gadgets Insurance market is dominated by the individual end-user segment, accounting for approximately xx% of the total market value in 2025. Within device types, mobile devices represent the largest segment, followed by laptops and computers. Accidental damage is the most prevalent coverage type, driven by the high incidence of accidental drops and spills. Geographically, the market is spread relatively evenly across the US, with no single region exhibiting clear dominance.
Key Drivers for Individual Segment:
- High ownership of electronic gadgets.
- Increased awareness of gadget protection needs.
- Affordability of insurance plans.
Key Drivers for Mobile Devices Segment:
- High prevalence of smartphone ownership.
- Increased device value and repair costs.
- Frequent exposure to damage risks.
Key Drivers for Accidental Damage Segment:
- High incidence of accidental damage.
- Relatively lower premiums compared to other coverage types.
- Ease of claiming processes.
US Electronic Gadgets Insurance Market Product Developments
Recent product innovations include specialized insurance plans for drones and other emerging technologies, reflecting the market's responsiveness to technological trends. Insurers are increasingly incorporating telematics and IoT technologies to offer personalized pricing and risk assessment, providing competitive advantages. The focus is on developing user-friendly digital platforms and streamlined claims processes to enhance customer experience and strengthen market fit.
Key Drivers of US Electronic Gadgets Insurance Market Growth
The US Electronic Gadgets Insurance Market is propelled by several key growth drivers:
- Technological advancements: The rise of IoT and connected devices creates new opportunities for insurance solutions.
- Economic factors: Rising disposable incomes and increased consumer spending on electronics fuels demand.
- Regulatory changes: New regulations focused on data privacy and cybersecurity could potentially shape product design.
Challenges in the US Electronic Gadgets Insurance Market Market
The market faces challenges including:
- Regulatory hurdles: Navigating complex insurance regulations in various states.
- Supply chain disruptions: Potential impacts on the availability of repair parts and services.
- Intense competition: The presence of numerous established players and the emergence of new market entrants.
Emerging Opportunities in US Electronic Gadgets Insurance Market
Long-term growth is fueled by the expansion of IoT technologies, offering insurers opportunities for data-driven insights and personalized insurance solutions. Strategic partnerships between insurance providers and electronics manufacturers are creating new embedded insurance models. The expansion of the market into underserved segments and geographies also presents significant opportunities.
Leading Players in the US Electronic Gadgets Insurance Market Sector
- AIG
- Progressive
- American Fidelity Assurance
- Allianz Insurance
- Aviva
- AXA
- Chubb
- Assurant Inc
- AT&T Inc
- Amica Mutual Insurance
Key Milestones in US Electronic Gadgets Insurance Market Industry
- October 2023: Bolttech and Allianz Partners partnered to launch insurance solutions for embedded devices and appliances in the United States. This signals a shift towards embedded insurance models and increased competition.
- February 2023: Moonrock Insurance, in collaboration with Apollo Insurance, launched drone insurance covering non-standard operations (BVLOS flights, heavy lift, etc.). This expands coverage to a rapidly growing segment.
Strategic Outlook for US Electronic Gadgets Insurance Market Market
The US Electronic Gadgets Insurance market holds substantial long-term growth potential. Strategic opportunities lie in leveraging technological advancements, expanding into new customer segments (e.g., small businesses), and forging strategic partnerships to offer integrated insurance solutions. Focusing on customer experience and developing innovative product offerings will be crucial for success in this dynamic and competitive market.
US Electronic Gadgets Insurance Market Segmentation
-
1. Coverage Type
- 1.1. Accidental Damage
- 1.2. Theft and Loss
-
2. Device Type
- 2.1. Laptops
- 2.2. Computers
- 2.3. Cameras
- 2.4. Mobile Devices
- 2.5. Drones
-
3. End Users
- 3.1. Corporate
- 3.2. Individual
US Electronic Gadgets Insurance Market Segmentation By Geography
-
1. North America
- 1.1. United States
- 1.2. Canada
- 1.3. Mexico
-
2. South America
- 2.1. Brazil
- 2.2. Argentina
- 2.3. Rest of South America
-
3. Europe
- 3.1. United Kingdom
- 3.2. Germany
- 3.3. France
- 3.4. Italy
- 3.5. Spain
- 3.6. Russia
- 3.7. Benelux
- 3.8. Nordics
- 3.9. Rest of Europe
-
4. Middle East & Africa
- 4.1. Turkey
- 4.2. Israel
- 4.3. GCC
- 4.4. North Africa
- 4.5. South Africa
- 4.6. Rest of Middle East & Africa
-
5. Asia Pacific
- 5.1. China
- 5.2. India
- 5.3. Japan
- 5.4. South Korea
- 5.5. ASEAN
- 5.6. Oceania
- 5.7. Rest of Asia Pacific
US Electronic Gadgets Insurance Market REPORT HIGHLIGHTS
| Aspects | Details |
|---|---|
| Study Period | 2019-2033 |
| Base Year | 2024 |
| Estimated Year | 2025 |
| Forecast Period | 2025-2033 |
| Historical Period | 2019-2024 |
| Growth Rate | CAGR of 11.54% from 2019-2033 |
| Segmentation |
|
Table of Contents
- 1. Introduction
- 1.1. Research Scope
- 1.2. Market Segmentation
- 1.3. Research Methodology
- 1.4. Definitions and Assumptions
- 2. Executive Summary
- 2.1. Introduction
- 3. Market Dynamics
- 3.1. Introduction
- 3.2. Market Drivers
- 3.2.1. Increse in Consumer spending for Electronic gadgets.; Rising living living standard of the the people
- 3.3. Market Restrains
- 3.3.1. Fluctuation in price of electronic gadgets raw material.; Fragmented market in electronic gadgets insurance business
- 3.4. Market Trends
- 3.4.1. Increase In Demand For Electronic Gadget Post Pandemic
- 4. Market Factor Analysis
- 4.1. Porters Five Forces
- 4.2. Supply/Value Chain
- 4.3. PESTEL analysis
- 4.4. Market Entropy
- 4.5. Patent/Trademark Analysis
- 5. Global US Electronic Gadgets Insurance Market Analysis, Insights and Forecast, 2019-2031
- 5.1. Market Analysis, Insights and Forecast - by Coverage Type
- 5.1.1. Accidental Damage
- 5.1.2. Theft and Loss
- 5.2. Market Analysis, Insights and Forecast - by Device Type
- 5.2.1. Laptops
- 5.2.2. Computers
- 5.2.3. Cameras
- 5.2.4. Mobile Devices
- 5.2.5. Drones
- 5.3. Market Analysis, Insights and Forecast - by End Users
- 5.3.1. Corporate
- 5.3.2. Individual
- 5.4. Market Analysis, Insights and Forecast - by Region
- 5.4.1. North America
- 5.4.2. South America
- 5.4.3. Europe
- 5.4.4. Middle East & Africa
- 5.4.5. Asia Pacific
- 5.1. Market Analysis, Insights and Forecast - by Coverage Type
- 6. North America US Electronic Gadgets Insurance Market Analysis, Insights and Forecast, 2019-2031
- 6.1. Market Analysis, Insights and Forecast - by Coverage Type
- 6.1.1. Accidental Damage
- 6.1.2. Theft and Loss
- 6.2. Market Analysis, Insights and Forecast - by Device Type
- 6.2.1. Laptops
- 6.2.2. Computers
- 6.2.3. Cameras
- 6.2.4. Mobile Devices
- 6.2.5. Drones
- 6.3. Market Analysis, Insights and Forecast - by End Users
- 6.3.1. Corporate
- 6.3.2. Individual
- 6.1. Market Analysis, Insights and Forecast - by Coverage Type
- 7. South America US Electronic Gadgets Insurance Market Analysis, Insights and Forecast, 2019-2031
- 7.1. Market Analysis, Insights and Forecast - by Coverage Type
- 7.1.1. Accidental Damage
- 7.1.2. Theft and Loss
- 7.2. Market Analysis, Insights and Forecast - by Device Type
- 7.2.1. Laptops
- 7.2.2. Computers
- 7.2.3. Cameras
- 7.2.4. Mobile Devices
- 7.2.5. Drones
- 7.3. Market Analysis, Insights and Forecast - by End Users
- 7.3.1. Corporate
- 7.3.2. Individual
- 7.1. Market Analysis, Insights and Forecast - by Coverage Type
- 8. Europe US Electronic Gadgets Insurance Market Analysis, Insights and Forecast, 2019-2031
- 8.1. Market Analysis, Insights and Forecast - by Coverage Type
- 8.1.1. Accidental Damage
- 8.1.2. Theft and Loss
- 8.2. Market Analysis, Insights and Forecast - by Device Type
- 8.2.1. Laptops
- 8.2.2. Computers
- 8.2.3. Cameras
- 8.2.4. Mobile Devices
- 8.2.5. Drones
- 8.3. Market Analysis, Insights and Forecast - by End Users
- 8.3.1. Corporate
- 8.3.2. Individual
- 8.1. Market Analysis, Insights and Forecast - by Coverage Type
- 9. Middle East & Africa US Electronic Gadgets Insurance Market Analysis, Insights and Forecast, 2019-2031
- 9.1. Market Analysis, Insights and Forecast - by Coverage Type
- 9.1.1. Accidental Damage
- 9.1.2. Theft and Loss
- 9.2. Market Analysis, Insights and Forecast - by Device Type
- 9.2.1. Laptops
- 9.2.2. Computers
- 9.2.3. Cameras
- 9.2.4. Mobile Devices
- 9.2.5. Drones
- 9.3. Market Analysis, Insights and Forecast - by End Users
- 9.3.1. Corporate
- 9.3.2. Individual
- 9.1. Market Analysis, Insights and Forecast - by Coverage Type
- 10. Asia Pacific US Electronic Gadgets Insurance Market Analysis, Insights and Forecast, 2019-2031
- 10.1. Market Analysis, Insights and Forecast - by Coverage Type
- 10.1.1. Accidental Damage
- 10.1.2. Theft and Loss
- 10.2. Market Analysis, Insights and Forecast - by Device Type
- 10.2.1. Laptops
- 10.2.2. Computers
- 10.2.3. Cameras
- 10.2.4. Mobile Devices
- 10.2.5. Drones
- 10.3. Market Analysis, Insights and Forecast - by End Users
- 10.3.1. Corporate
- 10.3.2. Individual
- 10.1. Market Analysis, Insights and Forecast - by Coverage Type
- 11. United States US Electronic Gadgets Insurance Market Analysis, Insights and Forecast, 2019-2031
- 12. Canada US Electronic Gadgets Insurance Market Analysis, Insights and Forecast, 2019-2031
- 13. Mexico US Electronic Gadgets Insurance Market Analysis, Insights and Forecast, 2019-2031
- 14. Competitive Analysis
- 14.1. Global Market Share Analysis 2024
- 14.2. Company Profiles
- 14.2.1 AIG
- 14.2.1.1. Overview
- 14.2.1.2. Products
- 14.2.1.3. SWOT Analysis
- 14.2.1.4. Recent Developments
- 14.2.1.5. Financials (Based on Availability)
- 14.2.2 Progressive**List Not Exhaustive
- 14.2.2.1. Overview
- 14.2.2.2. Products
- 14.2.2.3. SWOT Analysis
- 14.2.2.4. Recent Developments
- 14.2.2.5. Financials (Based on Availability)
- 14.2.3 American Fidelity Assurance
- 14.2.3.1. Overview
- 14.2.3.2. Products
- 14.2.3.3. SWOT Analysis
- 14.2.3.4. Recent Developments
- 14.2.3.5. Financials (Based on Availability)
- 14.2.4 Allianz Insurance
- 14.2.4.1. Overview
- 14.2.4.2. Products
- 14.2.4.3. SWOT Analysis
- 14.2.4.4. Recent Developments
- 14.2.4.5. Financials (Based on Availability)
- 14.2.5 Aviva
- 14.2.5.1. Overview
- 14.2.5.2. Products
- 14.2.5.3. SWOT Analysis
- 14.2.5.4. Recent Developments
- 14.2.5.5. Financials (Based on Availability)
- 14.2.6 AXA
- 14.2.6.1. Overview
- 14.2.6.2. Products
- 14.2.6.3. SWOT Analysis
- 14.2.6.4. Recent Developments
- 14.2.6.5. Financials (Based on Availability)
- 14.2.7 Chubb
- 14.2.7.1. Overview
- 14.2.7.2. Products
- 14.2.7.3. SWOT Analysis
- 14.2.7.4. Recent Developments
- 14.2.7.5. Financials (Based on Availability)
- 14.2.8 Assurant Inc
- 14.2.8.1. Overview
- 14.2.8.2. Products
- 14.2.8.3. SWOT Analysis
- 14.2.8.4. Recent Developments
- 14.2.8.5. Financials (Based on Availability)
- 14.2.9 AT&T Inc
- 14.2.9.1. Overview
- 14.2.9.2. Products
- 14.2.9.3. SWOT Analysis
- 14.2.9.4. Recent Developments
- 14.2.9.5. Financials (Based on Availability)
- 14.2.10 Amica Mutual Insurance
- 14.2.10.1. Overview
- 14.2.10.2. Products
- 14.2.10.3. SWOT Analysis
- 14.2.10.4. Recent Developments
- 14.2.10.5. Financials (Based on Availability)
- 14.2.1 AIG
List of Figures
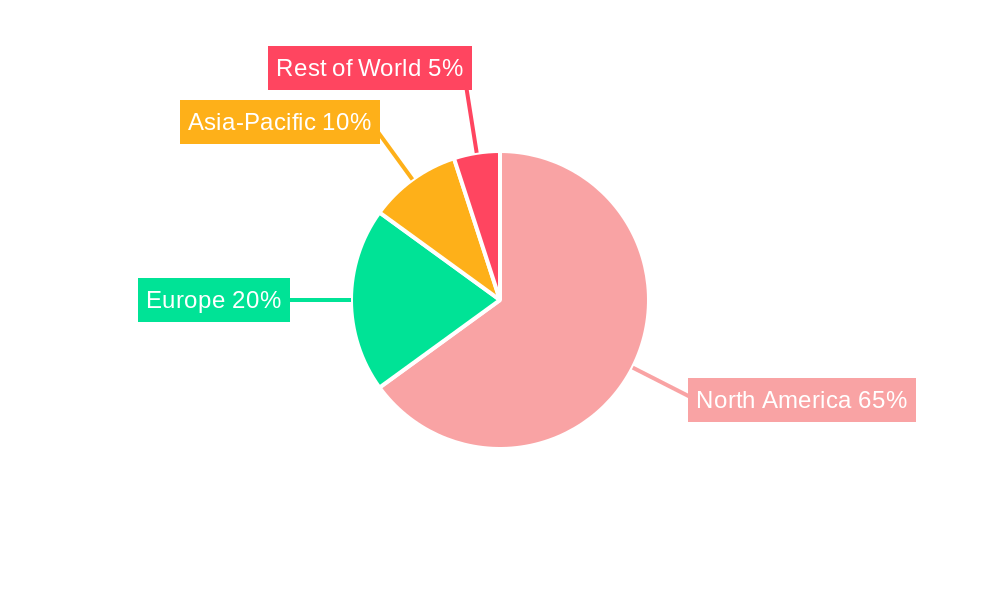
- Figure 1: Global US Electronic Gadgets Insurance Market Revenue Breakdown (Million, %) by Region 2024 & 2032
- Figure 2: North America US Electronic Gadgets Insurance Market Revenue (Million), by Country 2024 & 2032
- Figure 3: North America US Electronic Gadgets Insurance Market Revenue Share (%), by Country 2024 & 2032
- Figure 4: North America US Electronic Gadgets Insurance Market Revenue (Million), by Coverage Type 2024 & 2032
- Figure 5: North America US Electronic Gadgets Insurance Market Revenue Share (%), by Coverage Type 2024 & 2032
- Figure 6: North America US Electronic Gadgets Insurance Market Revenue (Million), by Device Type 2024 & 2032
- Figure 7: North America US Electronic Gadgets Insurance Market Revenue Share (%), by Device Type 2024 & 2032
- Figure 8: North America US Electronic Gadgets Insurance Market Revenue (Million), by End Users 2024 & 2032
- Figure 9: North America US Electronic Gadgets Insurance Market Revenue Share (%), by End Users 2024 & 2032
- Figure 10: North America US Electronic Gadgets Insurance Market Revenue (Million), by Country 2024 & 2032
- Figure 11: North America US Electronic Gadgets Insurance Market Revenue Share (%), by Country 2024 & 2032
- Figure 12: South America US Electronic Gadgets Insurance Market Revenue (Million), by Coverage Type 2024 & 2032
- Figure 13: South America US Electronic Gadgets Insurance Market Revenue Share (%), by Coverage Type 2024 & 2032
- Figure 14: South America US Electronic Gadgets Insurance Market Revenue (Million), by Device Type 2024 & 2032
- Figure 15: South America US Electronic Gadgets Insurance Market Revenue Share (%), by Device Type 2024 & 2032
- Figure 16: South America US Electronic Gadgets Insurance Market Revenue (Million), by End Users 2024 & 2032
- Figure 17: South America US Electronic Gadgets Insurance Market Revenue Share (%), by End Users 2024 & 2032
- Figure 18: South America US Electronic Gadgets Insurance Market Revenue (Million), by Country 2024 & 2032
- Figure 19: South America US Electronic Gadgets Insurance Market Revenue Share (%), by Country 2024 & 2032
- Figure 20: Europe US Electronic Gadgets Insurance Market Revenue (Million), by Coverage Type 2024 & 2032
- Figure 21: Europe US Electronic Gadgets Insurance Market Revenue Share (%), by Coverage Type 2024 & 2032
- Figure 22: Europe US Electronic Gadgets Insurance Market Revenue (Million), by Device Type 2024 & 2032
- Figure 23: Europe US Electronic Gadgets Insurance Market Revenue Share (%), by Device Type 2024 & 2032
- Figure 24: Europe US Electronic Gadgets Insurance Market Revenue (Million), by End Users 2024 & 2032
- Figure 25: Europe US Electronic Gadgets Insurance Market Revenue Share (%), by End Users 2024 & 2032
- Figure 26: Europe US Electronic Gadgets Insurance Market Revenue (Million), by Country 2024 & 2032
- Figure 27: Europe US Electronic Gadgets Insurance Market Revenue Share (%), by Country 2024 & 2032
- Figure 28: Middle East & Africa US Electronic Gadgets Insurance Market Revenue (Million), by Coverage Type 2024 & 2032
- Figure 29: Middle East & Africa US Electronic Gadgets Insurance Market Revenue Share (%), by Coverage Type 2024 & 2032
- Figure 30: Middle East & Africa US Electronic Gadgets Insurance Market Revenue (Million), by Device Type 2024 & 2032
- Figure 31: Middle East & Africa US Electronic Gadgets Insurance Market Revenue Share (%), by Device Type 2024 & 2032
- Figure 32: Middle East & Africa US Electronic Gadgets Insurance Market Revenue (Million), by End Users 2024 & 2032
- Figure 33: Middle East & Africa US Electronic Gadgets Insurance Market Revenue Share (%), by End Users 2024 & 2032
- Figure 34: Middle East & Africa US Electronic Gadgets Insurance Market Revenue (Million), by Country 2024 & 2032
- Figure 35: Middle East & Africa US Electronic Gadgets Insurance Market Revenue Share (%), by Country 2024 & 2032
- Figure 36: Asia Pacific US Electronic Gadgets Insurance Market Revenue (Million), by Coverage Type 2024 & 2032
- Figure 37: Asia Pacific US Electronic Gadgets Insurance Market Revenue Share (%), by Coverage Type 2024 & 2032
- Figure 38: Asia Pacific US Electronic Gadgets Insurance Market Revenue (Million), by Device Type 2024 & 2032
- Figure 39: Asia Pacific US Electronic Gadgets Insurance Market Revenue Share (%), by Device Type 2024 & 2032
- Figure 40: Asia Pacific US Electronic Gadgets Insurance Market Revenue (Million), by End Users 2024 & 2032
- Figure 41: Asia Pacific US Electronic Gadgets Insurance Market Revenue Share (%), by End Users 2024 & 2032
- Figure 42: Asia Pacific US Electronic Gadgets Insurance Market Revenue (Million), by Country 2024 & 2032
- Figure 43: Asia Pacific US Electronic Gadgets Insurance Market Revenue Share (%), by Country 2024 & 2032
List of Tables
- Table 1: Global US Electronic Gadgets Insurance Market Revenue Million Forecast, by Region 2019 & 2032
- Table 2: Global US Electronic Gadgets Insurance Market Revenue Million Forecast, by Coverage Type 2019 & 2032
- Table 3: Global US Electronic Gadgets Insurance Market Revenue Million Forecast, by Device Type 2019 & 2032
- Table 4: Global US Electronic Gadgets Insurance Market Revenue Million Forecast, by End Users 2019 & 2032
- Table 5: Global US Electronic Gadgets Insurance Market Revenue Million Forecast, by Region 2019 & 2032
- Table 6: Global US Electronic Gadgets Insurance Market Revenue Million Forecast, by Country 2019 & 2032
- Table 7: United States US Electronic Gadgets Insurance Market Revenue (Million) Forecast, by Application 2019 & 2032
- Table 8: Canada US Electronic Gadgets Insurance Market Revenue (Million) Forecast, by Application 2019 & 2032
- Table 9: Mexico US Electronic Gadgets Insurance Market Revenue (Million) Forecast, by Application 2019 & 2032
- Table 10: Global US Electronic Gadgets Insurance Market Revenue Million Forecast, by Coverage Type 2019 & 2032
- Table 11: Global US Electronic Gadgets Insurance Market Revenue Million Forecast, by Device Type 2019 & 2032
- Table 12: Global US Electronic Gadgets Insurance Market Revenue Million Forecast, by End Users 2019 & 2032
- Table 13: Global US Electronic Gadgets Insurance Market Revenue Million Forecast, by Country 2019 & 2032
- Table 14: United States US Electronic Gadgets Insurance Market Revenue (Million) Forecast, by Application 2019 & 2032
- Table 15: Canada US Electronic Gadgets Insurance Market Revenue (Million) Forecast, by Application 2019 & 2032
- Table 16: Mexico US Electronic Gadgets Insurance Market Revenue (Million) Forecast, by Application 2019 & 2032
- Table 17: Global US Electronic Gadgets Insurance Market Revenue Million Forecast, by Coverage Type 2019 & 2032
- Table 18: Global US Electronic Gadgets Insurance Market Revenue Million Forecast, by Device Type 2019 & 2032
- Table 19: Global US Electronic Gadgets Insurance Market Revenue Million Forecast, by End Users 2019 & 2032
- Table 20: Global US Electronic Gadgets Insurance Market Revenue Million Forecast, by Country 2019 & 2032
- Table 21: Brazil US Electronic Gadgets Insurance Market Revenue (Million) Forecast, by Application 2019 & 2032
- Table 22: Argentina US Electronic Gadgets Insurance Market Revenue (Million) Forecast, by Application 2019 & 2032
- Table 23: Rest of South America US Electronic Gadgets Insurance Market Revenue (Million) Forecast, by Application 2019 & 2032
- Table 24: Global US Electronic Gadgets Insurance Market Revenue Million Forecast, by Coverage Type 2019 & 2032
- Table 25: Global US Electronic Gadgets Insurance Market Revenue Million Forecast, by Device Type 2019 & 2032
- Table 26: Global US Electronic Gadgets Insurance Market Revenue Million Forecast, by End Users 2019 & 2032
- Table 27: Global US Electronic Gadgets Insurance Market Revenue Million Forecast, by Country 2019 & 2032
- Table 28: United Kingdom US Electronic Gadgets Insurance Market Revenue (Million) Forecast, by Application 2019 & 2032
- Table 29: Germany US Electronic Gadgets Insurance Market Revenue (Million) Forecast, by Application 2019 & 2032
- Table 30: France US Electronic Gadgets Insurance Market Revenue (Million) Forecast, by Application 2019 & 2032
- Table 31: Italy US Electronic Gadgets Insurance Market Revenue (Million) Forecast, by Application 2019 & 2032
- Table 32: Spain US Electronic Gadgets Insurance Market Revenue (Million) Forecast, by Application 2019 & 2032
- Table 33: Russia US Electronic Gadgets Insurance Market Revenue (Million) Forecast, by Application 2019 & 2032
- Table 34: Benelux US Electronic Gadgets Insurance Market Revenue (Million) Forecast, by Application 2019 & 2032
- Table 35: Nordics US Electronic Gadgets Insurance Market Revenue (Million) Forecast, by Application 2019 & 2032
- Table 36: Rest of Europe US Electronic Gadgets Insurance Market Revenue (Million) Forecast, by Application 2019 & 2032
- Table 37: Global US Electronic Gadgets Insurance Market Revenue Million Forecast, by Coverage Type 2019 & 2032
- Table 38: Global US Electronic Gadgets Insurance Market Revenue Million Forecast, by Device Type 2019 & 2032
- Table 39: Global US Electronic Gadgets Insurance Market Revenue Million Forecast, by End Users 2019 & 2032
- Table 40: Global US Electronic Gadgets Insurance Market Revenue Million Forecast, by Country 2019 & 2032
- Table 41: Turkey US Electronic Gadgets Insurance Market Revenue (Million) Forecast, by Application 2019 & 2032
- Table 42: Israel US Electronic Gadgets Insurance Market Revenue (Million) Forecast, by Application 2019 & 2032
- Table 43: GCC US Electronic Gadgets Insurance Market Revenue (Million) Forecast, by Application 2019 & 2032
- Table 44: North Africa US Electronic Gadgets Insurance Market Revenue (Million) Forecast, by Application 2019 & 2032
- Table 45: South Africa US Electronic Gadgets Insurance Market Revenue (Million) Forecast, by Application 2019 & 2032
- Table 46: Rest of Middle East & Africa US Electronic Gadgets Insurance Market Revenue (Million) Forecast, by Application 2019 & 2032
- Table 47: Global US Electronic Gadgets Insurance Market Revenue Million Forecast, by Coverage Type 2019 & 2032
- Table 48: Global US Electronic Gadgets Insurance Market Revenue Million Forecast, by Device Type 2019 & 2032
- Table 49: Global US Electronic Gadgets Insurance Market Revenue Million Forecast, by End Users 2019 & 2032
- Table 50: Global US Electronic Gadgets Insurance Market Revenue Million Forecast, by Country 2019 & 2032
- Table 51: China US Electronic Gadgets Insurance Market Revenue (Million) Forecast, by Application 2019 & 2032
- Table 52: India US Electronic Gadgets Insurance Market Revenue (Million) Forecast, by Application 2019 & 2032
- Table 53: Japan US Electronic Gadgets Insurance Market Revenue (Million) Forecast, by Application 2019 & 2032
- Table 54: South Korea US Electronic Gadgets Insurance Market Revenue (Million) Forecast, by Application 2019 & 2032
- Table 55: ASEAN US Electronic Gadgets Insurance Market Revenue (Million) Forecast, by Application 2019 & 2032
- Table 56: Oceania US Electronic Gadgets Insurance Market Revenue (Million) Forecast, by Application 2019 & 2032
- Table 57: Rest of Asia Pacific US Electronic Gadgets Insurance Market Revenue (Million) Forecast, by Application 2019 & 2032
Frequently Asked Questions
1. What is the projected Compound Annual Growth Rate (CAGR) of the US Electronic Gadgets Insurance Market?
The projected CAGR is approximately 11.54%.
2. Which companies are prominent players in the US Electronic Gadgets Insurance Market?
Key companies in the market include AIG, Progressive**List Not Exhaustive, American Fidelity Assurance, Allianz Insurance, Aviva, AXA, Chubb, Assurant Inc, AT&T Inc, Amica Mutual Insurance.
3. What are the main segments of the US Electronic Gadgets Insurance Market?
The market segments include Coverage Type, Device Type, End Users.
4. Can you provide details about the market size?
The market size is estimated to be USD 19.58 Million as of 2022.
5. What are some drivers contributing to market growth?
Increse in Consumer spending for Electronic gadgets.; Rising living living standard of the the people.
6. What are the notable trends driving market growth?
Increase In Demand For Electronic Gadget Post Pandemic.
7. Are there any restraints impacting market growth?
Fluctuation in price of electronic gadgets raw material.; Fragmented market in electronic gadgets insurance business.
8. Can you provide examples of recent developments in the market?
In October 2023, Bolttech and Allianz Partners partnered to launch insurance solutions for embedded devices and appliances in the United States.
9. What pricing options are available for accessing the report?
Pricing options include single-user, multi-user, and enterprise licenses priced at USD 3800, USD 4500, and USD 5800 respectively.
10. Is the market size provided in terms of value or volume?
The market size is provided in terms of value, measured in Million.
11. Are there any specific market keywords associated with the report?
Yes, the market keyword associated with the report is "US Electronic Gadgets Insurance Market," which aids in identifying and referencing the specific market segment covered.
12. How do I determine which pricing option suits my needs best?
The pricing options vary based on user requirements and access needs. Individual users may opt for single-user licenses, while businesses requiring broader access may choose multi-user or enterprise licenses for cost-effective access to the report.
13. Are there any additional resources or data provided in the US Electronic Gadgets Insurance Market report?
While the report offers comprehensive insights, it's advisable to review the specific contents or supplementary materials provided to ascertain if additional resources or data are available.
14. How can I stay updated on further developments or reports in the US Electronic Gadgets Insurance Market?
To stay informed about further developments, trends, and reports in the US Electronic Gadgets Insurance Market, consider subscribing to industry newsletters, following relevant companies and organizations, or regularly checking reputable industry news sources and publications.
Methodology
Step 1 - Identification of Relevant Samples Size from Population Database


Step 2 - Approaches for Defining Global Market Size (Value, Volume* & Price*)

Note*: In applicable scenarios
Step 3 - Data Sources
Primary Research
- Web Analytics
- Survey Reports
- Research Institute
- Latest Research Reports
- Opinion Leaders
Secondary Research
- Annual Reports
- White Paper
- Latest Press Release
- Industry Association
- Paid Database
- Investor Presentations

Step 4 - Data Triangulation
Involves using different sources of information in order to increase the validity of a study
These sources are likely to be stakeholders in a program - participants, other researchers, program staff, other community members, and so on.
Then we put all data in single framework & apply various statistical tools to find out the dynamic on the market.
During the analysis stage, feedback from the stakeholder groups would be compared to determine areas of agreement as well as areas of divergence
