

Key Insights
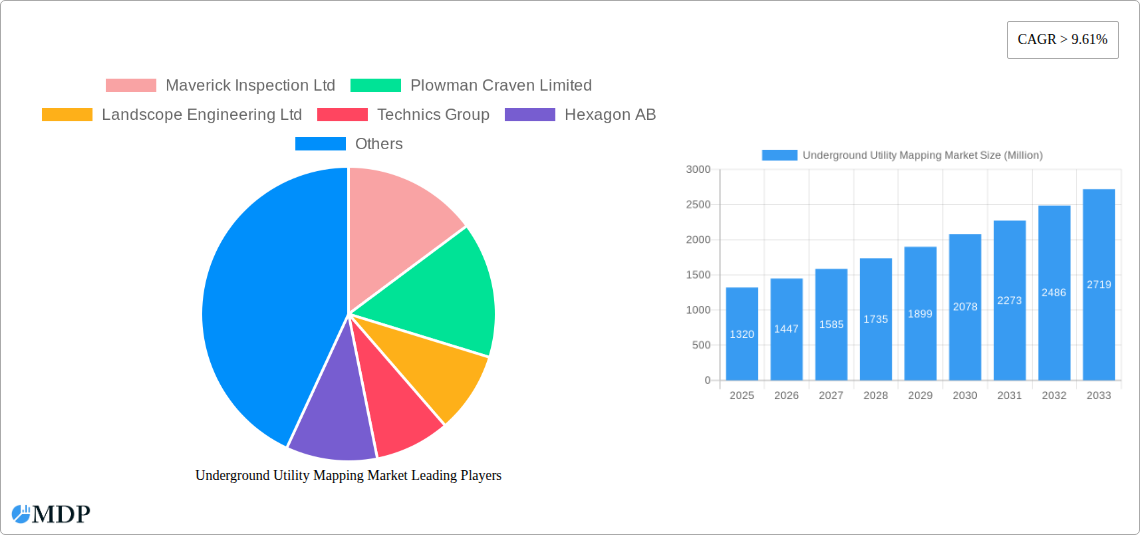
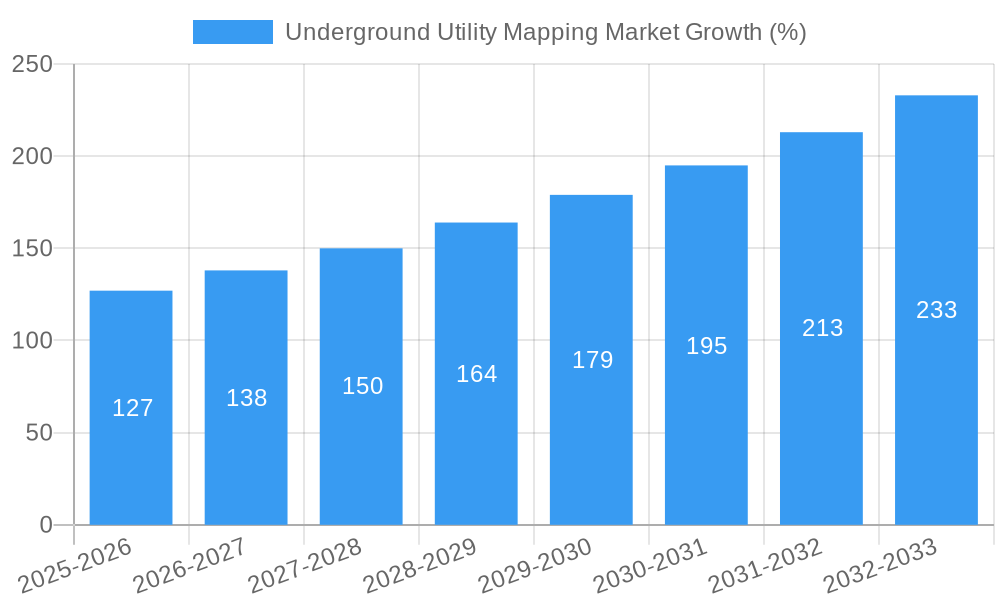
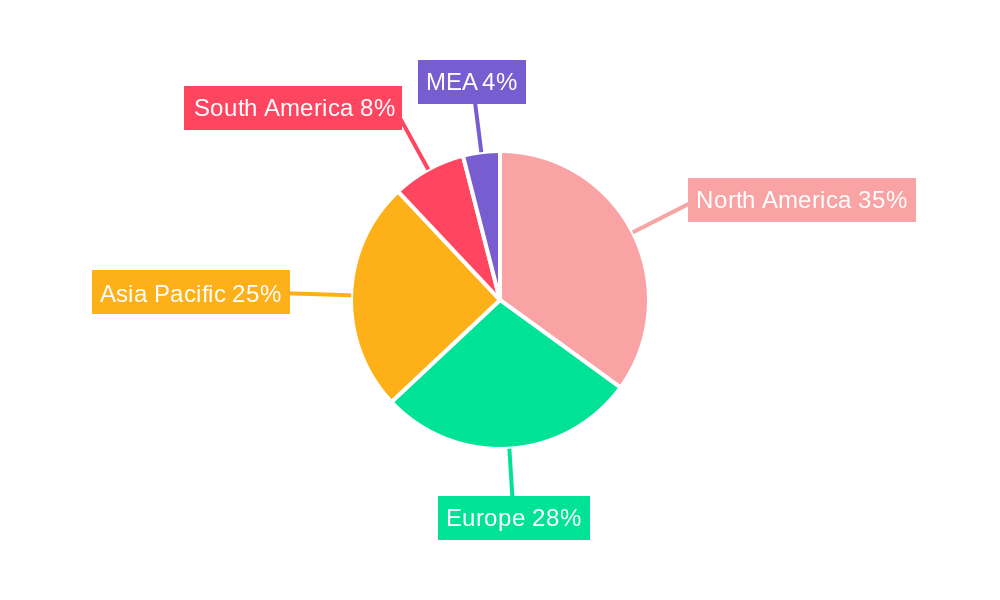
The Underground Utility Mapping market is experiencing robust growth, projected to reach a substantial size, driven by increasing urbanization, infrastructure development, and stringent safety regulations. The market's Compound Annual Growth Rate (CAGR) exceeding 9.61% from 2019-2024 indicates a strong upward trajectory, further fueled by the rising adoption of advanced technologies like ground-penetrating radar (GPR), LiDAR, and GIS. Key drivers include the need to prevent costly damage to underground utilities during excavation, improve public safety, and streamline infrastructure management. The market is segmented by component type (solutions and services) and end-user industry (public safety, oil and gas, building and construction, telecommunication, electricity, and others). North America currently holds a significant market share due to advanced technological adoption and robust infrastructure investment. However, Asia Pacific is anticipated to witness the fastest growth in the coming years driven by rapid urbanization and infrastructure development projects across countries like China and India. The competitive landscape features both established players and emerging companies offering diverse solutions and services catering to specific needs across various industries and regions.
The market's growth is further strengthened by increasing government initiatives focusing on infrastructure modernization and digitalization, coupled with rising investments in smart city projects globally. While challenges such as high initial investment costs and the need for skilled professionals may act as restraints, the long-term benefits in terms of safety, cost-effectiveness, and efficiency are expected to outweigh these challenges. The market is projected to continue its upward trend throughout the forecast period (2025-2033), with notable growth in emerging economies and increasing demand for integrated solutions providing comprehensive utility mapping capabilities. Continuous technological innovation in areas such as data analysis and visualization is poised to further enhance market growth and adoption.
Underground Utility Mapping Market Report: A Comprehensive Analysis (2019-2033)
This in-depth report provides a comprehensive analysis of the Underground Utility Mapping Market, offering valuable insights for stakeholders across the industry. With a study period spanning 2019-2033, a base year of 2025, and a forecast period of 2025-2033, this report presents a detailed overview of market dynamics, trends, leading players, and future opportunities. The market is expected to reach xx Million by 2033, exhibiting a CAGR of xx% during the forecast period.
Underground Utility Mapping Market Market Dynamics & Concentration
The Underground Utility Mapping market is characterized by a moderately concentrated landscape, with several key players holding significant market share. Market concentration is influenced by factors such as technological innovation, regulatory compliance, and the increasing demand for precise utility mapping solutions. The market exhibits considerable innovation, driven by advancements in technologies such as LiDAR, GPR, and AI-powered analytics. Stringent regulatory frameworks, varying across geographies, impact market players' operational strategies and compliance costs. The presence of substitute technologies and their effectiveness in specific applications also influences market dynamics.
End-user trends play a pivotal role, with increasing infrastructural projects and stringent safety regulations across various sectors driving market expansion. Mergers and acquisitions (M&A) have been observed in the market, with larger companies strategically acquiring smaller firms to expand their technological capabilities and market reach.
- Market Share: Hexagon AB and Vivax-Metrotech Corp are estimated to hold a combined market share of approximately xx%, showcasing their dominance. Other significant players contribute the remaining market share.
- M&A Activity: The historical period (2019-2024) witnessed approximately xx M&A deals, indicating a moderate level of consolidation. This is projected to increase slightly during the forecast period.
Underground Utility Mapping Market Industry Trends & Analysis
The Underground Utility Mapping market is experiencing robust growth, primarily driven by the escalating demand for precise utility mapping to prevent damage during excavation and construction projects. Technological advancements, particularly in sensor technology and data analytics, are transforming the industry, offering enhanced accuracy and efficiency. Consumer preferences are shifting towards solutions that offer real-time data access, improved visualization, and seamless integration with existing infrastructure management systems. The market's competitive landscape is marked by intense rivalry, with companies focusing on innovation, strategic partnerships, and geographic expansion. The increasing adoption of AI and machine learning to improve the accuracy and speed of utility mapping is further augmenting market growth. The market penetration of AI-powered solutions is projected to increase from xx% in 2025 to xx% by 2033, showcasing the accelerating adoption of sophisticated technologies. The global market is expected to experience a substantial growth in the next few years owing to the increasing demand for accurate underground utility mapping from the construction and building industry across the globe.
Leading Markets & Segments in Underground Utility Mapping Market
The North American region currently dominates the Underground Utility Mapping market, driven by robust infrastructural development and stringent safety regulations. Within this region, the United States holds a significant share due to extensive investment in infrastructure projects and the adoption of advanced mapping technologies.
By Component Type: Solutions segment dominates the market due to the rising demand for comprehensive utility mapping software and hardware. Services contribute significantly, catering to the need for specialized expertise and data analysis.
By End-user Industry: The building and construction sector is a key driver, followed closely by the oil and gas and telecommunication sectors. Public safety and electricity sectors also showcase considerable growth potential, owing to their need for accurate utility data for effective emergency response and grid management.
Key Drivers for North American Dominance:
- Extensive investment in infrastructure development.
- Stringent safety regulations regarding utility damage prevention.
- High adoption of advanced technologies.
Underground Utility Mapping Market Product Developments
Recent product developments have focused on integrating advanced technologies such as AI, machine learning, and improved sensor capabilities. This results in higher accuracy, faster processing times, and improved data visualization. New applications are emerging in areas such as asset management and infrastructure planning, enhancing the overall value proposition of underground utility mapping solutions. Companies are emphasizing seamless data integration with existing systems to increase market fit and efficiency.
Key Drivers of Underground Utility Mapping Market Growth
Several factors contribute to the growth of the Underground Utility Mapping Market. Firstly, the increasing need to prevent damage to underground utilities during excavation is a key driver. Secondly, the rising adoption of advanced technologies like LiDAR and GPR enhances accuracy and efficiency. Finally, stringent regulations related to utility safety also push market expansion.
Challenges in the Underground Utility Mapping Market Market
The Underground Utility Mapping Market faces several challenges. High initial investment costs for advanced equipment can be a barrier for entry for smaller companies. The complexity of integrating data from diverse sources and maintaining data accuracy remains a persistent hurdle. Competition from established players and the emergence of new technologies adds to the competitive pressures.
Emerging Opportunities in Underground Utility Mapping Market
The integration of AI and machine learning presents significant opportunities for enhanced accuracy, efficiency, and cost reduction. Strategic partnerships among technology providers, data analytics firms, and utility companies are expanding market penetration. Expanding into new geographical regions with growing infrastructure development holds substantial growth potential.
Leading Players in the Underground Utility Mapping Market Sector
- Maverick Inspection Ltd
- Plowman Craven Limited
- Landscope Engineering Ltd
- Technics Group
- Hexagon AB
- Red Laser Scanning
- Vivax-Metrotech Corp
- GSSI Geophysical Survey Systems Inc
- multiVIEW Locates Inc
- Geospatial Corporation
Key Milestones in Underground Utility Mapping Market Industry
- March 2024: WSB LLC partnered with 4M Analytics, integrating AI-powered subsurface utility mapping into infrastructure projects, significantly improving data integrity and real-time access.
- February 2024: Exodigo announced its participation in the GOPHURRS program, providing accurate subsurface maps for underground power line projects, boosting the adoption of advanced mapping solutions for enhancing grid reliability.
Strategic Outlook for Underground Utility Mapping Market Market
The Underground Utility Mapping Market holds substantial growth potential, driven by technological advancements, increasing infrastructural development, and stringent safety regulations. Strategic partnerships, geographic expansion, and the development of innovative solutions will play key roles in shaping the market's future. The focus on AI-powered solutions and enhanced data integration will define the competitive landscape, offering significant opportunities for growth and innovation.
Underground Utility Mapping Market Segmentation
-
1. Component Type
-
1.1. Solutions
- 1.1.1. Ground Penetrating Radar
- 1.1.2. Electromagnetic Locators
- 1.1.3. Other Solutions
- 1.2. Services
-
1.1. Solutions
-
2. End-user Industry
- 2.1. Public Safety
- 2.2. Oil and Gas
- 2.3. Building and Construction
- 2.4. Telecommunication
- 2.5. Electricity
- 2.6. Other End-user Industries
Underground Utility Mapping Market Segmentation By Geography
- 1. North America
- 2. Europe
- 3. Asia
- 4. Australia and New Zealand
- 5. Latin America
- 6. Middle East and Africa
Underground Utility Mapping Market REPORT HIGHLIGHTS
| Aspects | Details |
|---|---|
| Study Period | 2019-2033 |
| Base Year | 2024 |
| Estimated Year | 2025 |
| Forecast Period | 2025-2033 |
| Historical Period | 2019-2024 |
| Growth Rate | CAGR of > 9.61% from 2019-2033 |
| Segmentation |
|
Table of Contents
- 1. Introduction
- 1.1. Research Scope
- 1.2. Market Segmentation
- 1.3. Research Methodology
- 1.4. Definitions and Assumptions
- 2. Executive Summary
- 2.1. Introduction
- 3. Market Dynamics
- 3.1. Introduction
- 3.2. Market Drivers
- 3.2.1. Emerging Technologies Combined With Utility Maps to Improve the Exploration Activities; Increasing Availability of Detecting Applications and Increased Return on Marketing Spending
- 3.3. Market Restrains
- 3.3.1. High Initial Investment Cost To Hinder Market Growth
- 3.4. Market Trends
- 3.4.1. Ground Penetrating Radar is Expected to be the Largest Component Type Solution
- 4. Market Factor Analysis
- 4.1. Porters Five Forces
- 4.2. Supply/Value Chain
- 4.3. PESTEL analysis
- 4.4. Market Entropy
- 4.5. Patent/Trademark Analysis
- 5. Global Underground Utility Mapping Market Analysis, Insights and Forecast, 2019-2031
- 5.1. Market Analysis, Insights and Forecast - by Component Type
- 5.1.1. Solutions
- 5.1.1.1. Ground Penetrating Radar
- 5.1.1.2. Electromagnetic Locators
- 5.1.1.3. Other Solutions
- 5.1.2. Services
- 5.1.1. Solutions
- 5.2. Market Analysis, Insights and Forecast - by End-user Industry
- 5.2.1. Public Safety
- 5.2.2. Oil and Gas
- 5.2.3. Building and Construction
- 5.2.4. Telecommunication
- 5.2.5. Electricity
- 5.2.6. Other End-user Industries
- 5.3. Market Analysis, Insights and Forecast - by Region
- 5.3.1. North America
- 5.3.2. Europe
- 5.3.3. Asia
- 5.3.4. Australia and New Zealand
- 5.3.5. Latin America
- 5.3.6. Middle East and Africa
- 5.1. Market Analysis, Insights and Forecast - by Component Type
- 6. North America Underground Utility Mapping Market Analysis, Insights and Forecast, 2019-2031
- 6.1. Market Analysis, Insights and Forecast - by Component Type
- 6.1.1. Solutions
- 6.1.1.1. Ground Penetrating Radar
- 6.1.1.2. Electromagnetic Locators
- 6.1.1.3. Other Solutions
- 6.1.2. Services
- 6.1.1. Solutions
- 6.2. Market Analysis, Insights and Forecast - by End-user Industry
- 6.2.1. Public Safety
- 6.2.2. Oil and Gas
- 6.2.3. Building and Construction
- 6.2.4. Telecommunication
- 6.2.5. Electricity
- 6.2.6. Other End-user Industries
- 6.1. Market Analysis, Insights and Forecast - by Component Type
- 7. Europe Underground Utility Mapping Market Analysis, Insights and Forecast, 2019-2031
- 7.1. Market Analysis, Insights and Forecast - by Component Type
- 7.1.1. Solutions
- 7.1.1.1. Ground Penetrating Radar
- 7.1.1.2. Electromagnetic Locators
- 7.1.1.3. Other Solutions
- 7.1.2. Services
- 7.1.1. Solutions
- 7.2. Market Analysis, Insights and Forecast - by End-user Industry
- 7.2.1. Public Safety
- 7.2.2. Oil and Gas
- 7.2.3. Building and Construction
- 7.2.4. Telecommunication
- 7.2.5. Electricity
- 7.2.6. Other End-user Industries
- 7.1. Market Analysis, Insights and Forecast - by Component Type
- 8. Asia Underground Utility Mapping Market Analysis, Insights and Forecast, 2019-2031
- 8.1. Market Analysis, Insights and Forecast - by Component Type
- 8.1.1. Solutions
- 8.1.1.1. Ground Penetrating Radar
- 8.1.1.2. Electromagnetic Locators
- 8.1.1.3. Other Solutions
- 8.1.2. Services
- 8.1.1. Solutions
- 8.2. Market Analysis, Insights and Forecast - by End-user Industry
- 8.2.1. Public Safety
- 8.2.2. Oil and Gas
- 8.2.3. Building and Construction
- 8.2.4. Telecommunication
- 8.2.5. Electricity
- 8.2.6. Other End-user Industries
- 8.1. Market Analysis, Insights and Forecast - by Component Type
- 9. Australia and New Zealand Underground Utility Mapping Market Analysis, Insights and Forecast, 2019-2031
- 9.1. Market Analysis, Insights and Forecast - by Component Type
- 9.1.1. Solutions
- 9.1.1.1. Ground Penetrating Radar
- 9.1.1.2. Electromagnetic Locators
- 9.1.1.3. Other Solutions
- 9.1.2. Services
- 9.1.1. Solutions
- 9.2. Market Analysis, Insights and Forecast - by End-user Industry
- 9.2.1. Public Safety
- 9.2.2. Oil and Gas
- 9.2.3. Building and Construction
- 9.2.4. Telecommunication
- 9.2.5. Electricity
- 9.2.6. Other End-user Industries
- 9.1. Market Analysis, Insights and Forecast - by Component Type
- 10. Latin America Underground Utility Mapping Market Analysis, Insights and Forecast, 2019-2031
- 10.1. Market Analysis, Insights and Forecast - by Component Type
- 10.1.1. Solutions
- 10.1.1.1. Ground Penetrating Radar
- 10.1.1.2. Electromagnetic Locators
- 10.1.1.3. Other Solutions
- 10.1.2. Services
- 10.1.1. Solutions
- 10.2. Market Analysis, Insights and Forecast - by End-user Industry
- 10.2.1. Public Safety
- 10.2.2. Oil and Gas
- 10.2.3. Building and Construction
- 10.2.4. Telecommunication
- 10.2.5. Electricity
- 10.2.6. Other End-user Industries
- 10.1. Market Analysis, Insights and Forecast - by Component Type
- 11. Middle East and Africa Underground Utility Mapping Market Analysis, Insights and Forecast, 2019-2031
- 11.1. Market Analysis, Insights and Forecast - by Component Type
- 11.1.1. Solutions
- 11.1.1.1. Ground Penetrating Radar
- 11.1.1.2. Electromagnetic Locators
- 11.1.1.3. Other Solutions
- 11.1.2. Services
- 11.1.1. Solutions
- 11.2. Market Analysis, Insights and Forecast - by End-user Industry
- 11.2.1. Public Safety
- 11.2.2. Oil and Gas
- 11.2.3. Building and Construction
- 11.2.4. Telecommunication
- 11.2.5. Electricity
- 11.2.6. Other End-user Industries
- 11.1. Market Analysis, Insights and Forecast - by Component Type
- 12. North America Underground Utility Mapping Market Analysis, Insights and Forecast, 2019-2031
- 12.1. Market Analysis, Insights and Forecast - By Country/Sub-region
- 12.1.1 United States
- 12.1.2 Canada
- 12.1.3 Mexico
- 13. Europe Underground Utility Mapping Market Analysis, Insights and Forecast, 2019-2031
- 13.1. Market Analysis, Insights and Forecast - By Country/Sub-region
- 13.1.1 Germany
- 13.1.2 United Kingdom
- 13.1.3 France
- 13.1.4 Spain
- 13.1.5 Italy
- 13.1.6 Spain
- 13.1.7 Belgium
- 13.1.8 Netherland
- 13.1.9 Nordics
- 13.1.10 Rest of Europe
- 14. Asia Pacific Underground Utility Mapping Market Analysis, Insights and Forecast, 2019-2031
- 14.1. Market Analysis, Insights and Forecast - By Country/Sub-region
- 14.1.1 China
- 14.1.2 Japan
- 14.1.3 India
- 14.1.4 South Korea
- 14.1.5 Southeast Asia
- 14.1.6 Australia
- 14.1.7 Indonesia
- 14.1.8 Phillipes
- 14.1.9 Singapore
- 14.1.10 Thailandc
- 14.1.11 Rest of Asia Pacific
- 15. South America Underground Utility Mapping Market Analysis, Insights and Forecast, 2019-2031
- 15.1. Market Analysis, Insights and Forecast - By Country/Sub-region
- 15.1.1 Brazil
- 15.1.2 Argentina
- 15.1.3 Peru
- 15.1.4 Chile
- 15.1.5 Colombia
- 15.1.6 Ecuador
- 15.1.7 Venezuela
- 15.1.8 Rest of South America
- 16. North America Underground Utility Mapping Market Analysis, Insights and Forecast, 2019-2031
- 16.1. Market Analysis, Insights and Forecast - By Country/Sub-region
- 16.1.1 United States
- 16.1.2 Canada
- 16.1.3 Mexico
- 17. MEA Underground Utility Mapping Market Analysis, Insights and Forecast, 2019-2031
- 17.1. Market Analysis, Insights and Forecast - By Country/Sub-region
- 17.1.1 United Arab Emirates
- 17.1.2 Saudi Arabia
- 17.1.3 South Africa
- 17.1.4 Rest of Middle East and Africa
- 18. Competitive Analysis
- 18.1. Global Market Share Analysis 2024
- 18.2. Company Profiles
- 18.2.1 Maverick Inspection Ltd
- 18.2.1.1. Overview
- 18.2.1.2. Products
- 18.2.1.3. SWOT Analysis
- 18.2.1.4. Recent Developments
- 18.2.1.5. Financials (Based on Availability)
- 18.2.2 Plowman Craven Limited
- 18.2.2.1. Overview
- 18.2.2.2. Products
- 18.2.2.3. SWOT Analysis
- 18.2.2.4. Recent Developments
- 18.2.2.5. Financials (Based on Availability)
- 18.2.3 Landscope Engineering Ltd
- 18.2.3.1. Overview
- 18.2.3.2. Products
- 18.2.3.3. SWOT Analysis
- 18.2.3.4. Recent Developments
- 18.2.3.5. Financials (Based on Availability)
- 18.2.4 Technics Group
- 18.2.4.1. Overview
- 18.2.4.2. Products
- 18.2.4.3. SWOT Analysis
- 18.2.4.4. Recent Developments
- 18.2.4.5. Financials (Based on Availability)
- 18.2.5 Hexagon AB
- 18.2.5.1. Overview
- 18.2.5.2. Products
- 18.2.5.3. SWOT Analysis
- 18.2.5.4. Recent Developments
- 18.2.5.5. Financials (Based on Availability)
- 18.2.6 Red Laser Scanning
- 18.2.6.1. Overview
- 18.2.6.2. Products
- 18.2.6.3. SWOT Analysis
- 18.2.6.4. Recent Developments
- 18.2.6.5. Financials (Based on Availability)
- 18.2.7 Vivax-Metrotech Corp
- 18.2.7.1. Overview
- 18.2.7.2. Products
- 18.2.7.3. SWOT Analysis
- 18.2.7.4. Recent Developments
- 18.2.7.5. Financials (Based on Availability)
- 18.2.8 GSSI Geophysical Survey Systems Inc
- 18.2.8.1. Overview
- 18.2.8.2. Products
- 18.2.8.3. SWOT Analysis
- 18.2.8.4. Recent Developments
- 18.2.8.5. Financials (Based on Availability)
- 18.2.9 multiVIEW Locates Inc
- 18.2.9.1. Overview
- 18.2.9.2. Products
- 18.2.9.3. SWOT Analysis
- 18.2.9.4. Recent Developments
- 18.2.9.5. Financials (Based on Availability)
- 18.2.10 Geospatial Corporation
- 18.2.10.1. Overview
- 18.2.10.2. Products
- 18.2.10.3. SWOT Analysis
- 18.2.10.4. Recent Developments
- 18.2.10.5. Financials (Based on Availability)
- 18.2.1 Maverick Inspection Ltd
List of Figures
- Figure 1: Global Underground Utility Mapping Market Revenue Breakdown (Million, %) by Region 2024 & 2032
- Figure 2: North America Underground Utility Mapping Market Revenue (Million), by Country 2024 & 2032
- Figure 3: North America Underground Utility Mapping Market Revenue Share (%), by Country 2024 & 2032
- Figure 4: Europe Underground Utility Mapping Market Revenue (Million), by Country 2024 & 2032
- Figure 5: Europe Underground Utility Mapping Market Revenue Share (%), by Country 2024 & 2032
- Figure 6: Asia Pacific Underground Utility Mapping Market Revenue (Million), by Country 2024 & 2032
- Figure 7: Asia Pacific Underground Utility Mapping Market Revenue Share (%), by Country 2024 & 2032
- Figure 8: South America Underground Utility Mapping Market Revenue (Million), by Country 2024 & 2032
- Figure 9: South America Underground Utility Mapping Market Revenue Share (%), by Country 2024 & 2032
- Figure 10: North America Underground Utility Mapping Market Revenue (Million), by Country 2024 & 2032
- Figure 11: North America Underground Utility Mapping Market Revenue Share (%), by Country 2024 & 2032
- Figure 12: MEA Underground Utility Mapping Market Revenue (Million), by Country 2024 & 2032
- Figure 13: MEA Underground Utility Mapping Market Revenue Share (%), by Country 2024 & 2032
- Figure 14: North America Underground Utility Mapping Market Revenue (Million), by Component Type 2024 & 2032
- Figure 15: North America Underground Utility Mapping Market Revenue Share (%), by Component Type 2024 & 2032
- Figure 16: North America Underground Utility Mapping Market Revenue (Million), by End-user Industry 2024 & 2032
- Figure 17: North America Underground Utility Mapping Market Revenue Share (%), by End-user Industry 2024 & 2032
- Figure 18: North America Underground Utility Mapping Market Revenue (Million), by Country 2024 & 2032
- Figure 19: North America Underground Utility Mapping Market Revenue Share (%), by Country 2024 & 2032
- Figure 20: Europe Underground Utility Mapping Market Revenue (Million), by Component Type 2024 & 2032
- Figure 21: Europe Underground Utility Mapping Market Revenue Share (%), by Component Type 2024 & 2032
- Figure 22: Europe Underground Utility Mapping Market Revenue (Million), by End-user Industry 2024 & 2032
- Figure 23: Europe Underground Utility Mapping Market Revenue Share (%), by End-user Industry 2024 & 2032
- Figure 24: Europe Underground Utility Mapping Market Revenue (Million), by Country 2024 & 2032
- Figure 25: Europe Underground Utility Mapping Market Revenue Share (%), by Country 2024 & 2032
- Figure 26: Asia Underground Utility Mapping Market Revenue (Million), by Component Type 2024 & 2032
- Figure 27: Asia Underground Utility Mapping Market Revenue Share (%), by Component Type 2024 & 2032
- Figure 28: Asia Underground Utility Mapping Market Revenue (Million), by End-user Industry 2024 & 2032
- Figure 29: Asia Underground Utility Mapping Market Revenue Share (%), by End-user Industry 2024 & 2032
- Figure 30: Asia Underground Utility Mapping Market Revenue (Million), by Country 2024 & 2032
- Figure 31: Asia Underground Utility Mapping Market Revenue Share (%), by Country 2024 & 2032
- Figure 32: Australia and New Zealand Underground Utility Mapping Market Revenue (Million), by Component Type 2024 & 2032
- Figure 33: Australia and New Zealand Underground Utility Mapping Market Revenue Share (%), by Component Type 2024 & 2032
- Figure 34: Australia and New Zealand Underground Utility Mapping Market Revenue (Million), by End-user Industry 2024 & 2032
- Figure 35: Australia and New Zealand Underground Utility Mapping Market Revenue Share (%), by End-user Industry 2024 & 2032
- Figure 36: Australia and New Zealand Underground Utility Mapping Market Revenue (Million), by Country 2024 & 2032
- Figure 37: Australia and New Zealand Underground Utility Mapping Market Revenue Share (%), by Country 2024 & 2032
- Figure 38: Latin America Underground Utility Mapping Market Revenue (Million), by Component Type 2024 & 2032
- Figure 39: Latin America Underground Utility Mapping Market Revenue Share (%), by Component Type 2024 & 2032
- Figure 40: Latin America Underground Utility Mapping Market Revenue (Million), by End-user Industry 2024 & 2032
- Figure 41: Latin America Underground Utility Mapping Market Revenue Share (%), by End-user Industry 2024 & 2032
- Figure 42: Latin America Underground Utility Mapping Market Revenue (Million), by Country 2024 & 2032
- Figure 43: Latin America Underground Utility Mapping Market Revenue Share (%), by Country 2024 & 2032
- Figure 44: Middle East and Africa Underground Utility Mapping Market Revenue (Million), by Component Type 2024 & 2032
- Figure 45: Middle East and Africa Underground Utility Mapping Market Revenue Share (%), by Component Type 2024 & 2032
- Figure 46: Middle East and Africa Underground Utility Mapping Market Revenue (Million), by End-user Industry 2024 & 2032
- Figure 47: Middle East and Africa Underground Utility Mapping Market Revenue Share (%), by End-user Industry 2024 & 2032
- Figure 48: Middle East and Africa Underground Utility Mapping Market Revenue (Million), by Country 2024 & 2032
- Figure 49: Middle East and Africa Underground Utility Mapping Market Revenue Share (%), by Country 2024 & 2032
List of Tables
- Table 1: Global Underground Utility Mapping Market Revenue Million Forecast, by Region 2019 & 2032
- Table 2: Global Underground Utility Mapping Market Revenue Million Forecast, by Component Type 2019 & 2032
- Table 3: Global Underground Utility Mapping Market Revenue Million Forecast, by End-user Industry 2019 & 2032
- Table 4: Global Underground Utility Mapping Market Revenue Million Forecast, by Region 2019 & 2032
- Table 5: Global Underground Utility Mapping Market Revenue Million Forecast, by Country 2019 & 2032
- Table 6: United States Underground Utility Mapping Market Revenue (Million) Forecast, by Application 2019 & 2032
- Table 7: Canada Underground Utility Mapping Market Revenue (Million) Forecast, by Application 2019 & 2032
- Table 8: Mexico Underground Utility Mapping Market Revenue (Million) Forecast, by Application 2019 & 2032
- Table 9: Global Underground Utility Mapping Market Revenue Million Forecast, by Country 2019 & 2032
- Table 10: Germany Underground Utility Mapping Market Revenue (Million) Forecast, by Application 2019 & 2032
- Table 11: United Kingdom Underground Utility Mapping Market Revenue (Million) Forecast, by Application 2019 & 2032
- Table 12: France Underground Utility Mapping Market Revenue (Million) Forecast, by Application 2019 & 2032
- Table 13: Spain Underground Utility Mapping Market Revenue (Million) Forecast, by Application 2019 & 2032
- Table 14: Italy Underground Utility Mapping Market Revenue (Million) Forecast, by Application 2019 & 2032
- Table 15: Spain Underground Utility Mapping Market Revenue (Million) Forecast, by Application 2019 & 2032
- Table 16: Belgium Underground Utility Mapping Market Revenue (Million) Forecast, by Application 2019 & 2032
- Table 17: Netherland Underground Utility Mapping Market Revenue (Million) Forecast, by Application 2019 & 2032
- Table 18: Nordics Underground Utility Mapping Market Revenue (Million) Forecast, by Application 2019 & 2032
- Table 19: Rest of Europe Underground Utility Mapping Market Revenue (Million) Forecast, by Application 2019 & 2032
- Table 20: Global Underground Utility Mapping Market Revenue Million Forecast, by Country 2019 & 2032
- Table 21: China Underground Utility Mapping Market Revenue (Million) Forecast, by Application 2019 & 2032
- Table 22: Japan Underground Utility Mapping Market Revenue (Million) Forecast, by Application 2019 & 2032
- Table 23: India Underground Utility Mapping Market Revenue (Million) Forecast, by Application 2019 & 2032
- Table 24: South Korea Underground Utility Mapping Market Revenue (Million) Forecast, by Application 2019 & 2032
- Table 25: Southeast Asia Underground Utility Mapping Market Revenue (Million) Forecast, by Application 2019 & 2032
- Table 26: Australia Underground Utility Mapping Market Revenue (Million) Forecast, by Application 2019 & 2032
- Table 27: Indonesia Underground Utility Mapping Market Revenue (Million) Forecast, by Application 2019 & 2032
- Table 28: Phillipes Underground Utility Mapping Market Revenue (Million) Forecast, by Application 2019 & 2032
- Table 29: Singapore Underground Utility Mapping Market Revenue (Million) Forecast, by Application 2019 & 2032
- Table 30: Thailandc Underground Utility Mapping Market Revenue (Million) Forecast, by Application 2019 & 2032
- Table 31: Rest of Asia Pacific Underground Utility Mapping Market Revenue (Million) Forecast, by Application 2019 & 2032
- Table 32: Global Underground Utility Mapping Market Revenue Million Forecast, by Country 2019 & 2032
- Table 33: Brazil Underground Utility Mapping Market Revenue (Million) Forecast, by Application 2019 & 2032
- Table 34: Argentina Underground Utility Mapping Market Revenue (Million) Forecast, by Application 2019 & 2032
- Table 35: Peru Underground Utility Mapping Market Revenue (Million) Forecast, by Application 2019 & 2032
- Table 36: Chile Underground Utility Mapping Market Revenue (Million) Forecast, by Application 2019 & 2032
- Table 37: Colombia Underground Utility Mapping Market Revenue (Million) Forecast, by Application 2019 & 2032
- Table 38: Ecuador Underground Utility Mapping Market Revenue (Million) Forecast, by Application 2019 & 2032
- Table 39: Venezuela Underground Utility Mapping Market Revenue (Million) Forecast, by Application 2019 & 2032
- Table 40: Rest of South America Underground Utility Mapping Market Revenue (Million) Forecast, by Application 2019 & 2032
- Table 41: Global Underground Utility Mapping Market Revenue Million Forecast, by Country 2019 & 2032
- Table 42: United States Underground Utility Mapping Market Revenue (Million) Forecast, by Application 2019 & 2032
- Table 43: Canada Underground Utility Mapping Market Revenue (Million) Forecast, by Application 2019 & 2032
- Table 44: Mexico Underground Utility Mapping Market Revenue (Million) Forecast, by Application 2019 & 2032
- Table 45: Global Underground Utility Mapping Market Revenue Million Forecast, by Country 2019 & 2032
- Table 46: United Arab Emirates Underground Utility Mapping Market Revenue (Million) Forecast, by Application 2019 & 2032
- Table 47: Saudi Arabia Underground Utility Mapping Market Revenue (Million) Forecast, by Application 2019 & 2032
- Table 48: South Africa Underground Utility Mapping Market Revenue (Million) Forecast, by Application 2019 & 2032
- Table 49: Rest of Middle East and Africa Underground Utility Mapping Market Revenue (Million) Forecast, by Application 2019 & 2032
- Table 50: Global Underground Utility Mapping Market Revenue Million Forecast, by Component Type 2019 & 2032
- Table 51: Global Underground Utility Mapping Market Revenue Million Forecast, by End-user Industry 2019 & 2032
- Table 52: Global Underground Utility Mapping Market Revenue Million Forecast, by Country 2019 & 2032
- Table 53: Global Underground Utility Mapping Market Revenue Million Forecast, by Component Type 2019 & 2032
- Table 54: Global Underground Utility Mapping Market Revenue Million Forecast, by End-user Industry 2019 & 2032
- Table 55: Global Underground Utility Mapping Market Revenue Million Forecast, by Country 2019 & 2032
- Table 56: Global Underground Utility Mapping Market Revenue Million Forecast, by Component Type 2019 & 2032
- Table 57: Global Underground Utility Mapping Market Revenue Million Forecast, by End-user Industry 2019 & 2032
- Table 58: Global Underground Utility Mapping Market Revenue Million Forecast, by Country 2019 & 2032
- Table 59: Global Underground Utility Mapping Market Revenue Million Forecast, by Component Type 2019 & 2032
- Table 60: Global Underground Utility Mapping Market Revenue Million Forecast, by End-user Industry 2019 & 2032
- Table 61: Global Underground Utility Mapping Market Revenue Million Forecast, by Country 2019 & 2032
- Table 62: Global Underground Utility Mapping Market Revenue Million Forecast, by Component Type 2019 & 2032
- Table 63: Global Underground Utility Mapping Market Revenue Million Forecast, by End-user Industry 2019 & 2032
- Table 64: Global Underground Utility Mapping Market Revenue Million Forecast, by Country 2019 & 2032
- Table 65: Global Underground Utility Mapping Market Revenue Million Forecast, by Component Type 2019 & 2032
- Table 66: Global Underground Utility Mapping Market Revenue Million Forecast, by End-user Industry 2019 & 2032
- Table 67: Global Underground Utility Mapping Market Revenue Million Forecast, by Country 2019 & 2032
Frequently Asked Questions
1. What is the projected Compound Annual Growth Rate (CAGR) of the Underground Utility Mapping Market?
The projected CAGR is approximately > 9.61%.
2. Which companies are prominent players in the Underground Utility Mapping Market?
Key companies in the market include Maverick Inspection Ltd, Plowman Craven Limited, Landscope Engineering Ltd, Technics Group, Hexagon AB, Red Laser Scanning, Vivax-Metrotech Corp, GSSI Geophysical Survey Systems Inc, multiVIEW Locates Inc, Geospatial Corporation.
3. What are the main segments of the Underground Utility Mapping Market?
The market segments include Component Type, End-user Industry.
4. Can you provide details about the market size?
The market size is estimated to be USD 1.32 Million as of 2022.
5. What are some drivers contributing to market growth?
Emerging Technologies Combined With Utility Maps to Improve the Exploration Activities; Increasing Availability of Detecting Applications and Increased Return on Marketing Spending.
6. What are the notable trends driving market growth?
Ground Penetrating Radar is Expected to be the Largest Component Type Solution.
7. Are there any restraints impacting market growth?
High Initial Investment Cost To Hinder Market Growth.
8. Can you provide examples of recent developments in the market?
March 2024: WSB LLC (“WSB”), one of the nation’s fastest-growing infrastructure engineering and consulting firms, partnered with 4M Analytics, the nation’s leading subsurface utility AI mapping and analytics solution. This partnership is intended to support infrastructure projects across the United States, focusing on data integrity and real-time digital delivery. Leveraging artificial intelligence, computer vision, and change detection techniques, 4M Analytics synthesizes, digitizes, and geo-locates millions of utility data sources into a single platform and visually validates each line using vertical and horizontal imagery dating back to the 1940s. This enables ‘real-time’ access to the utility landscape for infrastructure projects through an intuitive user interface. The mapping resources will decrease the time it takes to locate underground utilities for owners, civil engineering firms, general contractors, subsurface utility engineering firms, and many other utility stakeholders.
9. What pricing options are available for accessing the report?
Pricing options include single-user, multi-user, and enterprise licenses priced at USD 4750, USD 5250, and USD 8750 respectively.
10. Is the market size provided in terms of value or volume?
The market size is provided in terms of value, measured in Million.
11. Are there any specific market keywords associated with the report?
Yes, the market keyword associated with the report is "Underground Utility Mapping Market," which aids in identifying and referencing the specific market segment covered.
12. How do I determine which pricing option suits my needs best?
The pricing options vary based on user requirements and access needs. Individual users may opt for single-user licenses, while businesses requiring broader access may choose multi-user or enterprise licenses for cost-effective access to the report.
13. Are there any additional resources or data provided in the Underground Utility Mapping Market report?
While the report offers comprehensive insights, it's advisable to review the specific contents or supplementary materials provided to ascertain if additional resources or data are available.
14. How can I stay updated on further developments or reports in the Underground Utility Mapping Market?
To stay informed about further developments, trends, and reports in the Underground Utility Mapping Market, consider subscribing to industry newsletters, following relevant companies and organizations, or regularly checking reputable industry news sources and publications.
Methodology
Step 1 - Identification of Relevant Samples Size from Population Database


Step 2 - Approaches for Defining Global Market Size (Value, Volume* & Price*)

Note*: In applicable scenarios
Step 3 - Data Sources
Primary Research
- Web Analytics
- Survey Reports
- Research Institute
- Latest Research Reports
- Opinion Leaders
Secondary Research
- Annual Reports
- White Paper
- Latest Press Release
- Industry Association
- Paid Database
- Investor Presentations

Step 4 - Data Triangulation
Involves using different sources of information in order to increase the validity of a study
These sources are likely to be stakeholders in a program - participants, other researchers, program staff, other community members, and so on.
Then we put all data in single framework & apply various statistical tools to find out the dynamic on the market.
During the analysis stage, feedback from the stakeholder groups would be compared to determine areas of agreement as well as areas of divergence
