

Key Insights
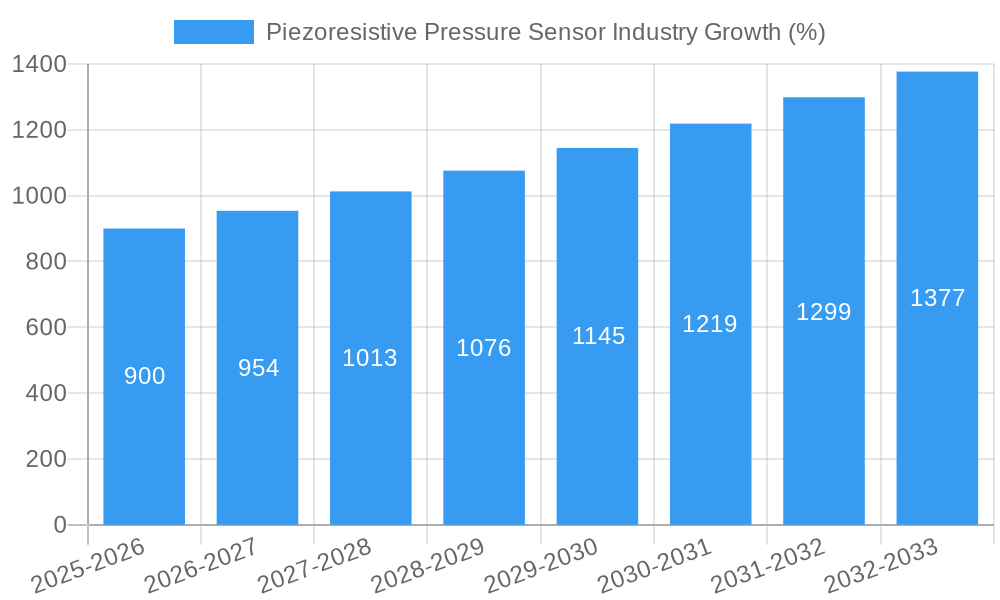
The piezoresistive pressure sensor market is experiencing robust growth, driven by increasing demand across diverse sectors. The market's Compound Annual Growth Rate (CAGR) of 5.80% from 2019 to 2024 suggests a consistently expanding market, projected to continue its upward trajectory through 2033. Key drivers include the automotive industry's shift towards advanced driver-assistance systems (ADAS) and electric vehicles, requiring sophisticated pressure sensing for braking, fuel injection, and tire pressure monitoring. Furthermore, the healthcare industry's reliance on minimally invasive procedures and remote patient monitoring fuels demand for accurate and reliable pressure sensors in medical devices. Industrial automation, particularly in process control and manufacturing, also contributes significantly to market growth. The market is segmented by material (silicon, ceramic, and other materials), with silicon currently dominating due to its cost-effectiveness and performance. End-user segments include automotive, healthcare, industrial, oil and gas, and others, reflecting the broad applicability of these sensors. While potential restraints such as stringent regulatory requirements and the emergence of alternative sensor technologies exist, the overall market outlook remains positive, indicating significant growth opportunities for established players and new entrants.
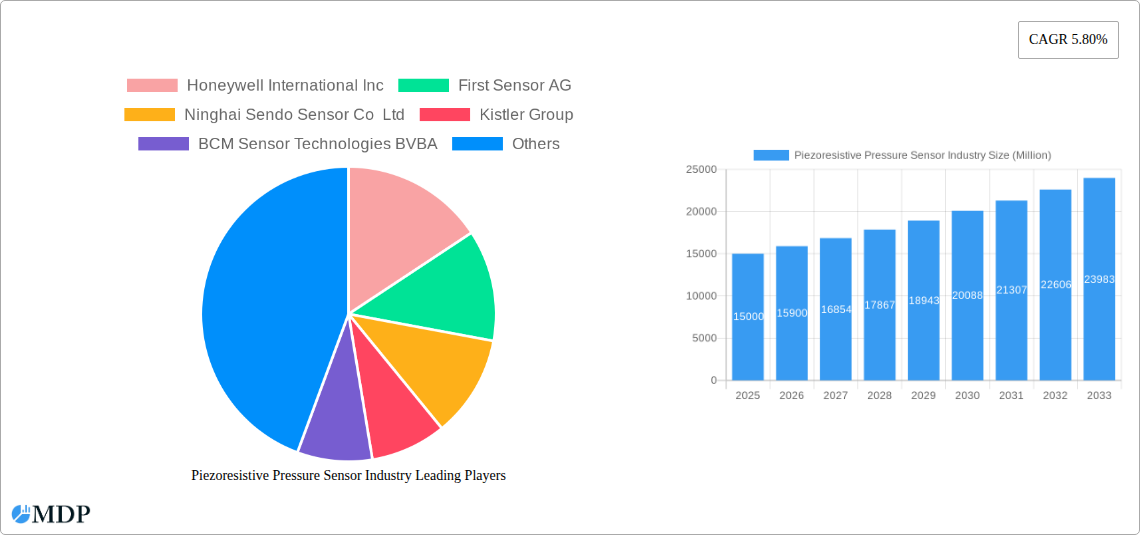
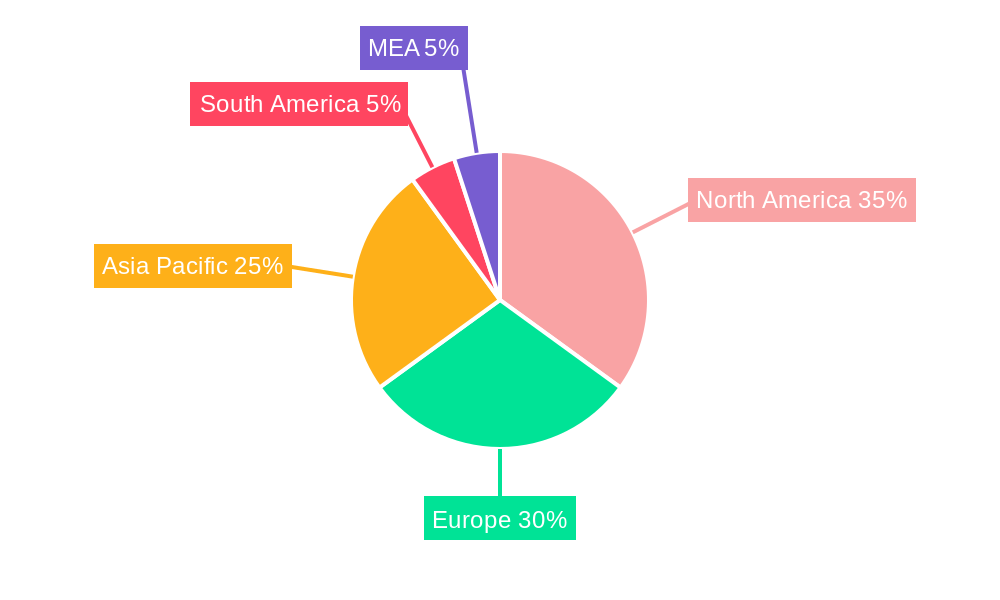
Growth is further fueled by the increasing adoption of IoT devices, requiring precise pressure monitoring in various applications. The Asia-Pacific region, particularly China and India, is projected to experience substantial growth due to increasing industrialization and infrastructure development. North America and Europe, while already significant markets, will continue to contribute significantly driven by technological advancements and adoption of precision manufacturing. Competitive dynamics are shaped by established players like Honeywell International and First Sensor, alongside emerging regional players. Strategic partnerships, mergers, and acquisitions, along with technological innovations focusing on miniaturization, improved accuracy, and enhanced durability, will continue to shape the competitive landscape. The forecast period of 2025-2033 anticipates continued market expansion, driven by sustained demand across various end-user segments and geographical regions. Therefore, investment and innovation within this field remain highly promising.
Piezoresistive Pressure Sensor Industry: Market Analysis & Forecast 2019-2033
This comprehensive report provides a detailed analysis of the global piezoresistive pressure sensor industry, offering invaluable insights for stakeholders seeking to navigate this dynamic market. Covering the period from 2019 to 2033, with a focus on 2025, this report unveils market dynamics, key players, technological advancements, and future growth potential. Expect actionable data and strategic recommendations to inform your business decisions. The market is projected to reach xx Million by 2033, exhibiting a robust CAGR of xx% during the forecast period (2025-2033).
Piezoresistive Pressure Sensor Industry Market Dynamics & Concentration
The global piezoresistive pressure sensor market is characterized by moderate concentration, with several key players holding significant market share. The industry is witnessing continuous innovation driven by the demand for higher accuracy, miniaturization, and improved durability. Stringent regulatory frameworks, particularly concerning safety and performance standards in various end-use industries, influence market dynamics. Product substitutes, such as capacitive and optical pressure sensors, pose competitive pressure, but piezoresistive sensors maintain their dominance due to their cost-effectiveness and mature technology. End-user trends, including the increasing adoption of automation and digitization across various sectors, drive demand. Mergers and acquisitions (M&A) activities are moderate, with an estimated xx M&A deals in the historical period (2019-2024), primarily aimed at expanding product portfolios and market reach. Honeywell International Inc. and First Sensor AG are estimated to hold the largest market share, with approximately xx% and xx% respectively in 2025. Smaller players focus on niche applications or regional markets.
Piezoresistive Pressure Sensor Industry Industry Trends & Analysis
The piezoresistive pressure sensor market exhibits strong growth, fueled by several key factors. The increasing demand for precise pressure measurement in diverse applications, particularly in automotive, healthcare, and industrial automation, is a primary driver. Technological advancements, such as the development of MEMS-based sensors and improved signal processing capabilities, enhance sensor performance and miniaturization, leading to higher market penetration in various segments. Consumer preference for advanced and reliable devices in diverse applications further bolsters market growth. Competitive dynamics are intense, with companies focusing on innovation, cost optimization, and strategic partnerships to gain market share. The market is witnessing a gradual shift towards high-precision, low-power consumption, and smart sensor technology. The market is projected to grow at a CAGR of xx% from 2025 to 2033, with a market penetration rate of xx% by 2033 in the automotive sector.
Leading Markets & Segments in Piezoresistive Pressure Sensor Industry
The automotive sector dominates the piezoresistive pressure sensor market, driven by the increasing adoption of advanced driver-assistance systems (ADAS) and engine management systems. The industrial sector is another significant contributor, with applications in process control, automation, and manufacturing. Within materials, silicon-based sensors hold the largest market share due to their cost-effectiveness and scalability. Geographically, North America and Europe currently lead the market, benefiting from robust automotive and industrial sectors and advanced technological infrastructure. However, Asia-Pacific is projected to experience the fastest growth in the coming years, driven by economic expansion, infrastructure development, and increasing industrialization.
- Key Drivers for Automotive Segment: Stringent emission regulations, rising demand for fuel-efficient vehicles, increasing adoption of ADAS features.
- Key Drivers for Industrial Segment: Automation of industrial processes, demand for improved process control and efficiency, increasing adoption of IoT devices.
- Key Drivers for Silicon Material Segment: Cost-effectiveness, established manufacturing processes, high performance characteristics.
Piezoresistive Pressure Sensor Industry Product Developments
Recent product innovations focus on improving sensor accuracy, miniaturization, and integration with smart technologies. New sensor designs incorporating advanced signal processing techniques and improved packaging enhance reliability and durability. Applications are expanding into areas such as medical devices, wearable technology, and environmental monitoring. Competitive advantages are increasingly gained through superior performance, innovative packaging, and integration with complementary technologies, enabling faster data transmission and improved connectivity. The trend is towards highly integrated, smart pressure sensors capable of providing more sophisticated data and analytics.
Key Drivers of Piezoresistive Pressure Sensor Industry Growth
The piezoresistive pressure sensor industry is experiencing significant growth due to several factors. Firstly, the increasing demand for precise pressure measurements in diverse applications across various industries is a primary driver. Secondly, technological advancements resulting in more accurate, reliable, and miniaturized sensors are boosting market growth. Thirdly, government regulations, particularly in safety-critical applications, are fostering the demand for high-quality pressure sensors. Lastly, the rise of the Internet of Things (IoT) and Industry 4.0 is driving the adoption of smart sensors, which are integrated with data analytics and communication capabilities.
Challenges in the Piezoresistive Pressure Sensor Industry Market
The industry faces challenges such as intense competition, particularly from alternative sensor technologies like capacitive and optical sensors. Supply chain disruptions, especially concerning raw materials, impact production and pricing. Stringent regulatory requirements and certification processes increase the cost of product development and market entry. Fluctuations in global economic conditions can influence demand, while maintaining accuracy and stability in extreme environments remain technological hurdles. The estimated cost increase due to supply chain issues in 2024 was approximately xx Million.
Emerging Opportunities in Piezoresistive Pressure Sensor Industry
Emerging opportunities lie in the growing adoption of IoT and Industry 4.0, driving demand for smart, connected pressure sensors capable of real-time data monitoring and analytics. Advancements in materials science and sensor design are enabling the development of smaller, more accurate, and energy-efficient sensors for emerging applications in healthcare, environmental monitoring, and wearable technologies. Strategic partnerships and collaborations among sensor manufacturers, software providers, and end-users can unlock new market opportunities and accelerate the adoption of innovative pressure sensing solutions.
Leading Players in the Piezoresistive Pressure Sensor Industry Sector
- Honeywell International Inc
- First Sensor AG
- Ninghai Sendo Sensor Co Ltd
- Kistler Group
- BCM Sensor Technologies BVBA
- Metallux SA
- Impress Sensors and Systems Ltd
- BD Sensors GmBH
- Pewatron AG
- All Sensors Corporation
- Rosemount Inc (Emerson Electric Company)
Key Milestones in Piezoresistive Pressure Sensor Industry Industry
- 2020: Introduction of a new MEMS-based piezoresistive pressure sensor with enhanced accuracy by Honeywell International Inc.
- 2021: First Sensor AG launched a miniature pressure sensor for medical applications.
- 2022: Acquisition of a smaller sensor company by Kistler Group to expand its product portfolio.
- 2023: Several key players announced investments in R&D to improve sensor performance and miniaturization.
Strategic Outlook for Piezoresistive Pressure Sensor Industry Market
The piezoresistive pressure sensor market is poised for continued growth, driven by technological advancements, increasing demand across diverse sectors, and the expansion of IoT and Industry 4.0 applications. Strategic opportunities exist for companies to focus on developing innovative sensor designs, improving sensor integration with smart technologies, and forging strategic partnerships to access new markets and expand their product portfolios. The focus on miniaturization, improved accuracy, and enhanced connectivity will be crucial for companies aiming to capture market share in the coming years.
Piezoresistive Pressure Sensor Industry Segmentation
-
1. Material
- 1.1. Silicon
- 1.2. Ceramic
- 1.3. Other Materials
-
2. End User
- 2.1. Automotive
- 2.2. Healthcare
- 2.3. Industrial
- 2.4. Oil and Gas
- 2.5. Other End Users
Piezoresistive Pressure Sensor Industry Segmentation By Geography
- 1. North America
- 2. Europe
- 3. Asia Pacific
- 4. Latin America
- 5. Middle East and Africa
Piezoresistive Pressure Sensor Industry REPORT HIGHLIGHTS
| Aspects | Details |
|---|---|
| Study Period | 2019-2033 |
| Base Year | 2024 |
| Estimated Year | 2025 |
| Forecast Period | 2025-2033 |
| Historical Period | 2019-2024 |
| Growth Rate | CAGR of 5.80% from 2019-2033 |
| Segmentation |
|
Table of Contents
- 1. Introduction
- 1.1. Research Scope
- 1.2. Market Segmentation
- 1.3. Research Methodology
- 1.4. Definitions and Assumptions
- 2. Executive Summary
- 2.1. Introduction
- 3. Market Dynamics
- 3.1. Introduction
- 3.2. Market Drivers
- 3.2.1. ; Rising Emphasis on Miniaturization of Equipment; Need for Robust Design and Enhanced Performance in Rugged Environment
- 3.3. Market Restrains
- 3.3.1. ; Technical Issues associated with the involvement of Smaller Components
- 3.4. Market Trends
- 3.4.1. Automotive Industry is Expected to Significantly Drive the Market Growth
- 4. Market Factor Analysis
- 4.1. Porters Five Forces
- 4.2. Supply/Value Chain
- 4.3. PESTEL analysis
- 4.4. Market Entropy
- 4.5. Patent/Trademark Analysis
- 5. Global Piezoresistive Pressure Sensor Industry Analysis, Insights and Forecast, 2019-2031
- 5.1. Market Analysis, Insights and Forecast - by Material
- 5.1.1. Silicon
- 5.1.2. Ceramic
- 5.1.3. Other Materials
- 5.2. Market Analysis, Insights and Forecast - by End User
- 5.2.1. Automotive
- 5.2.2. Healthcare
- 5.2.3. Industrial
- 5.2.4. Oil and Gas
- 5.2.5. Other End Users
- 5.3. Market Analysis, Insights and Forecast - by Region
- 5.3.1. North America
- 5.3.2. Europe
- 5.3.3. Asia Pacific
- 5.3.4. Latin America
- 5.3.5. Middle East and Africa
- 5.1. Market Analysis, Insights and Forecast - by Material
- 6. North America Piezoresistive Pressure Sensor Industry Analysis, Insights and Forecast, 2019-2031
- 6.1. Market Analysis, Insights and Forecast - by Material
- 6.1.1. Silicon
- 6.1.2. Ceramic
- 6.1.3. Other Materials
- 6.2. Market Analysis, Insights and Forecast - by End User
- 6.2.1. Automotive
- 6.2.2. Healthcare
- 6.2.3. Industrial
- 6.2.4. Oil and Gas
- 6.2.5. Other End Users
- 6.1. Market Analysis, Insights and Forecast - by Material
- 7. Europe Piezoresistive Pressure Sensor Industry Analysis, Insights and Forecast, 2019-2031
- 7.1. Market Analysis, Insights and Forecast - by Material
- 7.1.1. Silicon
- 7.1.2. Ceramic
- 7.1.3. Other Materials
- 7.2. Market Analysis, Insights and Forecast - by End User
- 7.2.1. Automotive
- 7.2.2. Healthcare
- 7.2.3. Industrial
- 7.2.4. Oil and Gas
- 7.2.5. Other End Users
- 7.1. Market Analysis, Insights and Forecast - by Material
- 8. Asia Pacific Piezoresistive Pressure Sensor Industry Analysis, Insights and Forecast, 2019-2031
- 8.1. Market Analysis, Insights and Forecast - by Material
- 8.1.1. Silicon
- 8.1.2. Ceramic
- 8.1.3. Other Materials
- 8.2. Market Analysis, Insights and Forecast - by End User
- 8.2.1. Automotive
- 8.2.2. Healthcare
- 8.2.3. Industrial
- 8.2.4. Oil and Gas
- 8.2.5. Other End Users
- 8.1. Market Analysis, Insights and Forecast - by Material
- 9. Latin America Piezoresistive Pressure Sensor Industry Analysis, Insights and Forecast, 2019-2031
- 9.1. Market Analysis, Insights and Forecast - by Material
- 9.1.1. Silicon
- 9.1.2. Ceramic
- 9.1.3. Other Materials
- 9.2. Market Analysis, Insights and Forecast - by End User
- 9.2.1. Automotive
- 9.2.2. Healthcare
- 9.2.3. Industrial
- 9.2.4. Oil and Gas
- 9.2.5. Other End Users
- 9.1. Market Analysis, Insights and Forecast - by Material
- 10. Middle East and Africa Piezoresistive Pressure Sensor Industry Analysis, Insights and Forecast, 2019-2031
- 10.1. Market Analysis, Insights and Forecast - by Material
- 10.1.1. Silicon
- 10.1.2. Ceramic
- 10.1.3. Other Materials
- 10.2. Market Analysis, Insights and Forecast - by End User
- 10.2.1. Automotive
- 10.2.2. Healthcare
- 10.2.3. Industrial
- 10.2.4. Oil and Gas
- 10.2.5. Other End Users
- 10.1. Market Analysis, Insights and Forecast - by Material
- 11. North America Piezoresistive Pressure Sensor Industry Analysis, Insights and Forecast, 2019-2031
- 11.1. Market Analysis, Insights and Forecast - By Country/Sub-region
- 11.1.1 United States
- 11.1.2 Canada
- 11.1.3 Mexico
- 12. Europe Piezoresistive Pressure Sensor Industry Analysis, Insights and Forecast, 2019-2031
- 12.1. Market Analysis, Insights and Forecast - By Country/Sub-region
- 12.1.1 Germany
- 12.1.2 United Kingdom
- 12.1.3 France
- 12.1.4 Spain
- 12.1.5 Italy
- 12.1.6 Spain
- 12.1.7 Belgium
- 12.1.8 Netherland
- 12.1.9 Nordics
- 12.1.10 Rest of Europe
- 13. Asia Pacific Piezoresistive Pressure Sensor Industry Analysis, Insights and Forecast, 2019-2031
- 13.1. Market Analysis, Insights and Forecast - By Country/Sub-region
- 13.1.1 China
- 13.1.2 Japan
- 13.1.3 India
- 13.1.4 South Korea
- 13.1.5 Southeast Asia
- 13.1.6 Australia
- 13.1.7 Indonesia
- 13.1.8 Phillipes
- 13.1.9 Singapore
- 13.1.10 Thailandc
- 13.1.11 Rest of Asia Pacific
- 14. South America Piezoresistive Pressure Sensor Industry Analysis, Insights and Forecast, 2019-2031
- 14.1. Market Analysis, Insights and Forecast - By Country/Sub-region
- 14.1.1 Brazil
- 14.1.2 Argentina
- 14.1.3 Peru
- 14.1.4 Chile
- 14.1.5 Colombia
- 14.1.6 Ecuador
- 14.1.7 Venezuela
- 14.1.8 Rest of South America
- 15. North America Piezoresistive Pressure Sensor Industry Analysis, Insights and Forecast, 2019-2031
- 15.1. Market Analysis, Insights and Forecast - By Country/Sub-region
- 15.1.1 United States
- 15.1.2 Canada
- 15.1.3 Mexico
- 16. MEA Piezoresistive Pressure Sensor Industry Analysis, Insights and Forecast, 2019-2031
- 16.1. Market Analysis, Insights and Forecast - By Country/Sub-region
- 16.1.1 United Arab Emirates
- 16.1.2 Saudi Arabia
- 16.1.3 South Africa
- 16.1.4 Rest of Middle East and Africa
- 17. Competitive Analysis
- 17.1. Global Market Share Analysis 2024
- 17.2. Company Profiles
- 17.2.1 Honeywell International Inc
- 17.2.1.1. Overview
- 17.2.1.2. Products
- 17.2.1.3. SWOT Analysis
- 17.2.1.4. Recent Developments
- 17.2.1.5. Financials (Based on Availability)
- 17.2.2 First Sensor AG
- 17.2.2.1. Overview
- 17.2.2.2. Products
- 17.2.2.3. SWOT Analysis
- 17.2.2.4. Recent Developments
- 17.2.2.5. Financials (Based on Availability)
- 17.2.3 Ninghai Sendo Sensor Co Ltd
- 17.2.3.1. Overview
- 17.2.3.2. Products
- 17.2.3.3. SWOT Analysis
- 17.2.3.4. Recent Developments
- 17.2.3.5. Financials (Based on Availability)
- 17.2.4 Kistler Group
- 17.2.4.1. Overview
- 17.2.4.2. Products
- 17.2.4.3. SWOT Analysis
- 17.2.4.4. Recent Developments
- 17.2.4.5. Financials (Based on Availability)
- 17.2.5 BCM Sensor Technologies BVBA
- 17.2.5.1. Overview
- 17.2.5.2. Products
- 17.2.5.3. SWOT Analysis
- 17.2.5.4. Recent Developments
- 17.2.5.5. Financials (Based on Availability)
- 17.2.6 Metallux SA
- 17.2.6.1. Overview
- 17.2.6.2. Products
- 17.2.6.3. SWOT Analysis
- 17.2.6.4. Recent Developments
- 17.2.6.5. Financials (Based on Availability)
- 17.2.7 Impress Sensors and Systems Ltd
- 17.2.7.1. Overview
- 17.2.7.2. Products
- 17.2.7.3. SWOT Analysis
- 17.2.7.4. Recent Developments
- 17.2.7.5. Financials (Based on Availability)
- 17.2.8 BD Sensors GmBH
- 17.2.8.1. Overview
- 17.2.8.2. Products
- 17.2.8.3. SWOT Analysis
- 17.2.8.4. Recent Developments
- 17.2.8.5. Financials (Based on Availability)
- 17.2.9 Pewatron AG
- 17.2.9.1. Overview
- 17.2.9.2. Products
- 17.2.9.3. SWOT Analysis
- 17.2.9.4. Recent Developments
- 17.2.9.5. Financials (Based on Availability)
- 17.2.10 All Sensors Corporation
- 17.2.10.1. Overview
- 17.2.10.2. Products
- 17.2.10.3. SWOT Analysis
- 17.2.10.4. Recent Developments
- 17.2.10.5. Financials (Based on Availability)
- 17.2.11 Rosemount Inc (Emerson Electric Company)
- 17.2.11.1. Overview
- 17.2.11.2. Products
- 17.2.11.3. SWOT Analysis
- 17.2.11.4. Recent Developments
- 17.2.11.5. Financials (Based on Availability)
- 17.2.1 Honeywell International Inc
List of Figures
- Figure 1: Global Piezoresistive Pressure Sensor Industry Revenue Breakdown (Million, %) by Region 2024 & 2032
- Figure 2: Global Piezoresistive Pressure Sensor Industry Volume Breakdown (K Unit, %) by Region 2024 & 2032
- Figure 3: North America Piezoresistive Pressure Sensor Industry Revenue (Million), by Country 2024 & 2032
- Figure 4: North America Piezoresistive Pressure Sensor Industry Volume (K Unit), by Country 2024 & 2032
- Figure 5: North America Piezoresistive Pressure Sensor Industry Revenue Share (%), by Country 2024 & 2032
- Figure 6: North America Piezoresistive Pressure Sensor Industry Volume Share (%), by Country 2024 & 2032
- Figure 7: Europe Piezoresistive Pressure Sensor Industry Revenue (Million), by Country 2024 & 2032
- Figure 8: Europe Piezoresistive Pressure Sensor Industry Volume (K Unit), by Country 2024 & 2032
- Figure 9: Europe Piezoresistive Pressure Sensor Industry Revenue Share (%), by Country 2024 & 2032
- Figure 10: Europe Piezoresistive Pressure Sensor Industry Volume Share (%), by Country 2024 & 2032
- Figure 11: Asia Pacific Piezoresistive Pressure Sensor Industry Revenue (Million), by Country 2024 & 2032
- Figure 12: Asia Pacific Piezoresistive Pressure Sensor Industry Volume (K Unit), by Country 2024 & 2032
- Figure 13: Asia Pacific Piezoresistive Pressure Sensor Industry Revenue Share (%), by Country 2024 & 2032
- Figure 14: Asia Pacific Piezoresistive Pressure Sensor Industry Volume Share (%), by Country 2024 & 2032
- Figure 15: South America Piezoresistive Pressure Sensor Industry Revenue (Million), by Country 2024 & 2032
- Figure 16: South America Piezoresistive Pressure Sensor Industry Volume (K Unit), by Country 2024 & 2032
- Figure 17: South America Piezoresistive Pressure Sensor Industry Revenue Share (%), by Country 2024 & 2032
- Figure 18: South America Piezoresistive Pressure Sensor Industry Volume Share (%), by Country 2024 & 2032
- Figure 19: North America Piezoresistive Pressure Sensor Industry Revenue (Million), by Country 2024 & 2032
- Figure 20: North America Piezoresistive Pressure Sensor Industry Volume (K Unit), by Country 2024 & 2032
- Figure 21: North America Piezoresistive Pressure Sensor Industry Revenue Share (%), by Country 2024 & 2032
- Figure 22: North America Piezoresistive Pressure Sensor Industry Volume Share (%), by Country 2024 & 2032
- Figure 23: MEA Piezoresistive Pressure Sensor Industry Revenue (Million), by Country 2024 & 2032
- Figure 24: MEA Piezoresistive Pressure Sensor Industry Volume (K Unit), by Country 2024 & 2032
- Figure 25: MEA Piezoresistive Pressure Sensor Industry Revenue Share (%), by Country 2024 & 2032
- Figure 26: MEA Piezoresistive Pressure Sensor Industry Volume Share (%), by Country 2024 & 2032
- Figure 27: North America Piezoresistive Pressure Sensor Industry Revenue (Million), by Material 2024 & 2032
- Figure 28: North America Piezoresistive Pressure Sensor Industry Volume (K Unit), by Material 2024 & 2032
- Figure 29: North America Piezoresistive Pressure Sensor Industry Revenue Share (%), by Material 2024 & 2032
- Figure 30: North America Piezoresistive Pressure Sensor Industry Volume Share (%), by Material 2024 & 2032
- Figure 31: North America Piezoresistive Pressure Sensor Industry Revenue (Million), by End User 2024 & 2032
- Figure 32: North America Piezoresistive Pressure Sensor Industry Volume (K Unit), by End User 2024 & 2032
- Figure 33: North America Piezoresistive Pressure Sensor Industry Revenue Share (%), by End User 2024 & 2032
- Figure 34: North America Piezoresistive Pressure Sensor Industry Volume Share (%), by End User 2024 & 2032
- Figure 35: North America Piezoresistive Pressure Sensor Industry Revenue (Million), by Country 2024 & 2032
- Figure 36: North America Piezoresistive Pressure Sensor Industry Volume (K Unit), by Country 2024 & 2032
- Figure 37: North America Piezoresistive Pressure Sensor Industry Revenue Share (%), by Country 2024 & 2032
- Figure 38: North America Piezoresistive Pressure Sensor Industry Volume Share (%), by Country 2024 & 2032
- Figure 39: Europe Piezoresistive Pressure Sensor Industry Revenue (Million), by Material 2024 & 2032
- Figure 40: Europe Piezoresistive Pressure Sensor Industry Volume (K Unit), by Material 2024 & 2032
- Figure 41: Europe Piezoresistive Pressure Sensor Industry Revenue Share (%), by Material 2024 & 2032
- Figure 42: Europe Piezoresistive Pressure Sensor Industry Volume Share (%), by Material 2024 & 2032
- Figure 43: Europe Piezoresistive Pressure Sensor Industry Revenue (Million), by End User 2024 & 2032
- Figure 44: Europe Piezoresistive Pressure Sensor Industry Volume (K Unit), by End User 2024 & 2032
- Figure 45: Europe Piezoresistive Pressure Sensor Industry Revenue Share (%), by End User 2024 & 2032
- Figure 46: Europe Piezoresistive Pressure Sensor Industry Volume Share (%), by End User 2024 & 2032
- Figure 47: Europe Piezoresistive Pressure Sensor Industry Revenue (Million), by Country 2024 & 2032
- Figure 48: Europe Piezoresistive Pressure Sensor Industry Volume (K Unit), by Country 2024 & 2032
- Figure 49: Europe Piezoresistive Pressure Sensor Industry Revenue Share (%), by Country 2024 & 2032
- Figure 50: Europe Piezoresistive Pressure Sensor Industry Volume Share (%), by Country 2024 & 2032
- Figure 51: Asia Pacific Piezoresistive Pressure Sensor Industry Revenue (Million), by Material 2024 & 2032
- Figure 52: Asia Pacific Piezoresistive Pressure Sensor Industry Volume (K Unit), by Material 2024 & 2032
- Figure 53: Asia Pacific Piezoresistive Pressure Sensor Industry Revenue Share (%), by Material 2024 & 2032
- Figure 54: Asia Pacific Piezoresistive Pressure Sensor Industry Volume Share (%), by Material 2024 & 2032
- Figure 55: Asia Pacific Piezoresistive Pressure Sensor Industry Revenue (Million), by End User 2024 & 2032
- Figure 56: Asia Pacific Piezoresistive Pressure Sensor Industry Volume (K Unit), by End User 2024 & 2032
- Figure 57: Asia Pacific Piezoresistive Pressure Sensor Industry Revenue Share (%), by End User 2024 & 2032
- Figure 58: Asia Pacific Piezoresistive Pressure Sensor Industry Volume Share (%), by End User 2024 & 2032
- Figure 59: Asia Pacific Piezoresistive Pressure Sensor Industry Revenue (Million), by Country 2024 & 2032
- Figure 60: Asia Pacific Piezoresistive Pressure Sensor Industry Volume (K Unit), by Country 2024 & 2032
- Figure 61: Asia Pacific Piezoresistive Pressure Sensor Industry Revenue Share (%), by Country 2024 & 2032
- Figure 62: Asia Pacific Piezoresistive Pressure Sensor Industry Volume Share (%), by Country 2024 & 2032
- Figure 63: Latin America Piezoresistive Pressure Sensor Industry Revenue (Million), by Material 2024 & 2032
- Figure 64: Latin America Piezoresistive Pressure Sensor Industry Volume (K Unit), by Material 2024 & 2032
- Figure 65: Latin America Piezoresistive Pressure Sensor Industry Revenue Share (%), by Material 2024 & 2032
- Figure 66: Latin America Piezoresistive Pressure Sensor Industry Volume Share (%), by Material 2024 & 2032
- Figure 67: Latin America Piezoresistive Pressure Sensor Industry Revenue (Million), by End User 2024 & 2032
- Figure 68: Latin America Piezoresistive Pressure Sensor Industry Volume (K Unit), by End User 2024 & 2032
- Figure 69: Latin America Piezoresistive Pressure Sensor Industry Revenue Share (%), by End User 2024 & 2032
- Figure 70: Latin America Piezoresistive Pressure Sensor Industry Volume Share (%), by End User 2024 & 2032
- Figure 71: Latin America Piezoresistive Pressure Sensor Industry Revenue (Million), by Country 2024 & 2032
- Figure 72: Latin America Piezoresistive Pressure Sensor Industry Volume (K Unit), by Country 2024 & 2032
- Figure 73: Latin America Piezoresistive Pressure Sensor Industry Revenue Share (%), by Country 2024 & 2032
- Figure 74: Latin America Piezoresistive Pressure Sensor Industry Volume Share (%), by Country 2024 & 2032
- Figure 75: Middle East and Africa Piezoresistive Pressure Sensor Industry Revenue (Million), by Material 2024 & 2032
- Figure 76: Middle East and Africa Piezoresistive Pressure Sensor Industry Volume (K Unit), by Material 2024 & 2032
- Figure 77: Middle East and Africa Piezoresistive Pressure Sensor Industry Revenue Share (%), by Material 2024 & 2032
- Figure 78: Middle East and Africa Piezoresistive Pressure Sensor Industry Volume Share (%), by Material 2024 & 2032
- Figure 79: Middle East and Africa Piezoresistive Pressure Sensor Industry Revenue (Million), by End User 2024 & 2032
- Figure 80: Middle East and Africa Piezoresistive Pressure Sensor Industry Volume (K Unit), by End User 2024 & 2032
- Figure 81: Middle East and Africa Piezoresistive Pressure Sensor Industry Revenue Share (%), by End User 2024 & 2032
- Figure 82: Middle East and Africa Piezoresistive Pressure Sensor Industry Volume Share (%), by End User 2024 & 2032
- Figure 83: Middle East and Africa Piezoresistive Pressure Sensor Industry Revenue (Million), by Country 2024 & 2032
- Figure 84: Middle East and Africa Piezoresistive Pressure Sensor Industry Volume (K Unit), by Country 2024 & 2032
- Figure 85: Middle East and Africa Piezoresistive Pressure Sensor Industry Revenue Share (%), by Country 2024 & 2032
- Figure 86: Middle East and Africa Piezoresistive Pressure Sensor Industry Volume Share (%), by Country 2024 & 2032
List of Tables
- Table 1: Global Piezoresistive Pressure Sensor Industry Revenue Million Forecast, by Region 2019 & 2032
- Table 2: Global Piezoresistive Pressure Sensor Industry Volume K Unit Forecast, by Region 2019 & 2032
- Table 3: Global Piezoresistive Pressure Sensor Industry Revenue Million Forecast, by Material 2019 & 2032
- Table 4: Global Piezoresistive Pressure Sensor Industry Volume K Unit Forecast, by Material 2019 & 2032
- Table 5: Global Piezoresistive Pressure Sensor Industry Revenue Million Forecast, by End User 2019 & 2032
- Table 6: Global Piezoresistive Pressure Sensor Industry Volume K Unit Forecast, by End User 2019 & 2032
- Table 7: Global Piezoresistive Pressure Sensor Industry Revenue Million Forecast, by Region 2019 & 2032
- Table 8: Global Piezoresistive Pressure Sensor Industry Volume K Unit Forecast, by Region 2019 & 2032
- Table 9: Global Piezoresistive Pressure Sensor Industry Revenue Million Forecast, by Country 2019 & 2032
- Table 10: Global Piezoresistive Pressure Sensor Industry Volume K Unit Forecast, by Country 2019 & 2032
- Table 11: United States Piezoresistive Pressure Sensor Industry Revenue (Million) Forecast, by Application 2019 & 2032
- Table 12: United States Piezoresistive Pressure Sensor Industry Volume (K Unit) Forecast, by Application 2019 & 2032
- Table 13: Canada Piezoresistive Pressure Sensor Industry Revenue (Million) Forecast, by Application 2019 & 2032
- Table 14: Canada Piezoresistive Pressure Sensor Industry Volume (K Unit) Forecast, by Application 2019 & 2032
- Table 15: Mexico Piezoresistive Pressure Sensor Industry Revenue (Million) Forecast, by Application 2019 & 2032
- Table 16: Mexico Piezoresistive Pressure Sensor Industry Volume (K Unit) Forecast, by Application 2019 & 2032
- Table 17: Global Piezoresistive Pressure Sensor Industry Revenue Million Forecast, by Country 2019 & 2032
- Table 18: Global Piezoresistive Pressure Sensor Industry Volume K Unit Forecast, by Country 2019 & 2032
- Table 19: Germany Piezoresistive Pressure Sensor Industry Revenue (Million) Forecast, by Application 2019 & 2032
- Table 20: Germany Piezoresistive Pressure Sensor Industry Volume (K Unit) Forecast, by Application 2019 & 2032
- Table 21: United Kingdom Piezoresistive Pressure Sensor Industry Revenue (Million) Forecast, by Application 2019 & 2032
- Table 22: United Kingdom Piezoresistive Pressure Sensor Industry Volume (K Unit) Forecast, by Application 2019 & 2032
- Table 23: France Piezoresistive Pressure Sensor Industry Revenue (Million) Forecast, by Application 2019 & 2032
- Table 24: France Piezoresistive Pressure Sensor Industry Volume (K Unit) Forecast, by Application 2019 & 2032
- Table 25: Spain Piezoresistive Pressure Sensor Industry Revenue (Million) Forecast, by Application 2019 & 2032
- Table 26: Spain Piezoresistive Pressure Sensor Industry Volume (K Unit) Forecast, by Application 2019 & 2032
- Table 27: Italy Piezoresistive Pressure Sensor Industry Revenue (Million) Forecast, by Application 2019 & 2032
- Table 28: Italy Piezoresistive Pressure Sensor Industry Volume (K Unit) Forecast, by Application 2019 & 2032
- Table 29: Spain Piezoresistive Pressure Sensor Industry Revenue (Million) Forecast, by Application 2019 & 2032
- Table 30: Spain Piezoresistive Pressure Sensor Industry Volume (K Unit) Forecast, by Application 2019 & 2032
- Table 31: Belgium Piezoresistive Pressure Sensor Industry Revenue (Million) Forecast, by Application 2019 & 2032
- Table 32: Belgium Piezoresistive Pressure Sensor Industry Volume (K Unit) Forecast, by Application 2019 & 2032
- Table 33: Netherland Piezoresistive Pressure Sensor Industry Revenue (Million) Forecast, by Application 2019 & 2032
- Table 34: Netherland Piezoresistive Pressure Sensor Industry Volume (K Unit) Forecast, by Application 2019 & 2032
- Table 35: Nordics Piezoresistive Pressure Sensor Industry Revenue (Million) Forecast, by Application 2019 & 2032
- Table 36: Nordics Piezoresistive Pressure Sensor Industry Volume (K Unit) Forecast, by Application 2019 & 2032
- Table 37: Rest of Europe Piezoresistive Pressure Sensor Industry Revenue (Million) Forecast, by Application 2019 & 2032
- Table 38: Rest of Europe Piezoresistive Pressure Sensor Industry Volume (K Unit) Forecast, by Application 2019 & 2032
- Table 39: Global Piezoresistive Pressure Sensor Industry Revenue Million Forecast, by Country 2019 & 2032
- Table 40: Global Piezoresistive Pressure Sensor Industry Volume K Unit Forecast, by Country 2019 & 2032
- Table 41: China Piezoresistive Pressure Sensor Industry Revenue (Million) Forecast, by Application 2019 & 2032
- Table 42: China Piezoresistive Pressure Sensor Industry Volume (K Unit) Forecast, by Application 2019 & 2032
- Table 43: Japan Piezoresistive Pressure Sensor Industry Revenue (Million) Forecast, by Application 2019 & 2032
- Table 44: Japan Piezoresistive Pressure Sensor Industry Volume (K Unit) Forecast, by Application 2019 & 2032
- Table 45: India Piezoresistive Pressure Sensor Industry Revenue (Million) Forecast, by Application 2019 & 2032
- Table 46: India Piezoresistive Pressure Sensor Industry Volume (K Unit) Forecast, by Application 2019 & 2032
- Table 47: South Korea Piezoresistive Pressure Sensor Industry Revenue (Million) Forecast, by Application 2019 & 2032
- Table 48: South Korea Piezoresistive Pressure Sensor Industry Volume (K Unit) Forecast, by Application 2019 & 2032
- Table 49: Southeast Asia Piezoresistive Pressure Sensor Industry Revenue (Million) Forecast, by Application 2019 & 2032
- Table 50: Southeast Asia Piezoresistive Pressure Sensor Industry Volume (K Unit) Forecast, by Application 2019 & 2032
- Table 51: Australia Piezoresistive Pressure Sensor Industry Revenue (Million) Forecast, by Application 2019 & 2032
- Table 52: Australia Piezoresistive Pressure Sensor Industry Volume (K Unit) Forecast, by Application 2019 & 2032
- Table 53: Indonesia Piezoresistive Pressure Sensor Industry Revenue (Million) Forecast, by Application 2019 & 2032
- Table 54: Indonesia Piezoresistive Pressure Sensor Industry Volume (K Unit) Forecast, by Application 2019 & 2032
- Table 55: Phillipes Piezoresistive Pressure Sensor Industry Revenue (Million) Forecast, by Application 2019 & 2032
- Table 56: Phillipes Piezoresistive Pressure Sensor Industry Volume (K Unit) Forecast, by Application 2019 & 2032
- Table 57: Singapore Piezoresistive Pressure Sensor Industry Revenue (Million) Forecast, by Application 2019 & 2032
- Table 58: Singapore Piezoresistive Pressure Sensor Industry Volume (K Unit) Forecast, by Application 2019 & 2032
- Table 59: Thailandc Piezoresistive Pressure Sensor Industry Revenue (Million) Forecast, by Application 2019 & 2032
- Table 60: Thailandc Piezoresistive Pressure Sensor Industry Volume (K Unit) Forecast, by Application 2019 & 2032
- Table 61: Rest of Asia Pacific Piezoresistive Pressure Sensor Industry Revenue (Million) Forecast, by Application 2019 & 2032
- Table 62: Rest of Asia Pacific Piezoresistive Pressure Sensor Industry Volume (K Unit) Forecast, by Application 2019 & 2032
- Table 63: Global Piezoresistive Pressure Sensor Industry Revenue Million Forecast, by Country 2019 & 2032
- Table 64: Global Piezoresistive Pressure Sensor Industry Volume K Unit Forecast, by Country 2019 & 2032
- Table 65: Brazil Piezoresistive Pressure Sensor Industry Revenue (Million) Forecast, by Application 2019 & 2032
- Table 66: Brazil Piezoresistive Pressure Sensor Industry Volume (K Unit) Forecast, by Application 2019 & 2032
- Table 67: Argentina Piezoresistive Pressure Sensor Industry Revenue (Million) Forecast, by Application 2019 & 2032
- Table 68: Argentina Piezoresistive Pressure Sensor Industry Volume (K Unit) Forecast, by Application 2019 & 2032
- Table 69: Peru Piezoresistive Pressure Sensor Industry Revenue (Million) Forecast, by Application 2019 & 2032
- Table 70: Peru Piezoresistive Pressure Sensor Industry Volume (K Unit) Forecast, by Application 2019 & 2032
- Table 71: Chile Piezoresistive Pressure Sensor Industry Revenue (Million) Forecast, by Application 2019 & 2032
- Table 72: Chile Piezoresistive Pressure Sensor Industry Volume (K Unit) Forecast, by Application 2019 & 2032
- Table 73: Colombia Piezoresistive Pressure Sensor Industry Revenue (Million) Forecast, by Application 2019 & 2032
- Table 74: Colombia Piezoresistive Pressure Sensor Industry Volume (K Unit) Forecast, by Application 2019 & 2032
- Table 75: Ecuador Piezoresistive Pressure Sensor Industry Revenue (Million) Forecast, by Application 2019 & 2032
- Table 76: Ecuador Piezoresistive Pressure Sensor Industry Volume (K Unit) Forecast, by Application 2019 & 2032
- Table 77: Venezuela Piezoresistive Pressure Sensor Industry Revenue (Million) Forecast, by Application 2019 & 2032
- Table 78: Venezuela Piezoresistive Pressure Sensor Industry Volume (K Unit) Forecast, by Application 2019 & 2032
- Table 79: Rest of South America Piezoresistive Pressure Sensor Industry Revenue (Million) Forecast, by Application 2019 & 2032
- Table 80: Rest of South America Piezoresistive Pressure Sensor Industry Volume (K Unit) Forecast, by Application 2019 & 2032
- Table 81: Global Piezoresistive Pressure Sensor Industry Revenue Million Forecast, by Country 2019 & 2032
- Table 82: Global Piezoresistive Pressure Sensor Industry Volume K Unit Forecast, by Country 2019 & 2032
- Table 83: United States Piezoresistive Pressure Sensor Industry Revenue (Million) Forecast, by Application 2019 & 2032
- Table 84: United States Piezoresistive Pressure Sensor Industry Volume (K Unit) Forecast, by Application 2019 & 2032
- Table 85: Canada Piezoresistive Pressure Sensor Industry Revenue (Million) Forecast, by Application 2019 & 2032
- Table 86: Canada Piezoresistive Pressure Sensor Industry Volume (K Unit) Forecast, by Application 2019 & 2032
- Table 87: Mexico Piezoresistive Pressure Sensor Industry Revenue (Million) Forecast, by Application 2019 & 2032
- Table 88: Mexico Piezoresistive Pressure Sensor Industry Volume (K Unit) Forecast, by Application 2019 & 2032
- Table 89: Global Piezoresistive Pressure Sensor Industry Revenue Million Forecast, by Country 2019 & 2032
- Table 90: Global Piezoresistive Pressure Sensor Industry Volume K Unit Forecast, by Country 2019 & 2032
- Table 91: United Arab Emirates Piezoresistive Pressure Sensor Industry Revenue (Million) Forecast, by Application 2019 & 2032
- Table 92: United Arab Emirates Piezoresistive Pressure Sensor Industry Volume (K Unit) Forecast, by Application 2019 & 2032
- Table 93: Saudi Arabia Piezoresistive Pressure Sensor Industry Revenue (Million) Forecast, by Application 2019 & 2032
- Table 94: Saudi Arabia Piezoresistive Pressure Sensor Industry Volume (K Unit) Forecast, by Application 2019 & 2032
- Table 95: South Africa Piezoresistive Pressure Sensor Industry Revenue (Million) Forecast, by Application 2019 & 2032
- Table 96: South Africa Piezoresistive Pressure Sensor Industry Volume (K Unit) Forecast, by Application 2019 & 2032
- Table 97: Rest of Middle East and Africa Piezoresistive Pressure Sensor Industry Revenue (Million) Forecast, by Application 2019 & 2032
- Table 98: Rest of Middle East and Africa Piezoresistive Pressure Sensor Industry Volume (K Unit) Forecast, by Application 2019 & 2032
- Table 99: Global Piezoresistive Pressure Sensor Industry Revenue Million Forecast, by Material 2019 & 2032
- Table 100: Global Piezoresistive Pressure Sensor Industry Volume K Unit Forecast, by Material 2019 & 2032
- Table 101: Global Piezoresistive Pressure Sensor Industry Revenue Million Forecast, by End User 2019 & 2032
- Table 102: Global Piezoresistive Pressure Sensor Industry Volume K Unit Forecast, by End User 2019 & 2032
- Table 103: Global Piezoresistive Pressure Sensor Industry Revenue Million Forecast, by Country 2019 & 2032
- Table 104: Global Piezoresistive Pressure Sensor Industry Volume K Unit Forecast, by Country 2019 & 2032
- Table 105: Global Piezoresistive Pressure Sensor Industry Revenue Million Forecast, by Material 2019 & 2032
- Table 106: Global Piezoresistive Pressure Sensor Industry Volume K Unit Forecast, by Material 2019 & 2032
- Table 107: Global Piezoresistive Pressure Sensor Industry Revenue Million Forecast, by End User 2019 & 2032
- Table 108: Global Piezoresistive Pressure Sensor Industry Volume K Unit Forecast, by End User 2019 & 2032
- Table 109: Global Piezoresistive Pressure Sensor Industry Revenue Million Forecast, by Country 2019 & 2032
- Table 110: Global Piezoresistive Pressure Sensor Industry Volume K Unit Forecast, by Country 2019 & 2032
- Table 111: Global Piezoresistive Pressure Sensor Industry Revenue Million Forecast, by Material 2019 & 2032
- Table 112: Global Piezoresistive Pressure Sensor Industry Volume K Unit Forecast, by Material 2019 & 2032
- Table 113: Global Piezoresistive Pressure Sensor Industry Revenue Million Forecast, by End User 2019 & 2032
- Table 114: Global Piezoresistive Pressure Sensor Industry Volume K Unit Forecast, by End User 2019 & 2032
- Table 115: Global Piezoresistive Pressure Sensor Industry Revenue Million Forecast, by Country 2019 & 2032
- Table 116: Global Piezoresistive Pressure Sensor Industry Volume K Unit Forecast, by Country 2019 & 2032
- Table 117: Global Piezoresistive Pressure Sensor Industry Revenue Million Forecast, by Material 2019 & 2032
- Table 118: Global Piezoresistive Pressure Sensor Industry Volume K Unit Forecast, by Material 2019 & 2032
- Table 119: Global Piezoresistive Pressure Sensor Industry Revenue Million Forecast, by End User 2019 & 2032
- Table 120: Global Piezoresistive Pressure Sensor Industry Volume K Unit Forecast, by End User 2019 & 2032
- Table 121: Global Piezoresistive Pressure Sensor Industry Revenue Million Forecast, by Country 2019 & 2032
- Table 122: Global Piezoresistive Pressure Sensor Industry Volume K Unit Forecast, by Country 2019 & 2032
- Table 123: Global Piezoresistive Pressure Sensor Industry Revenue Million Forecast, by Material 2019 & 2032
- Table 124: Global Piezoresistive Pressure Sensor Industry Volume K Unit Forecast, by Material 2019 & 2032
- Table 125: Global Piezoresistive Pressure Sensor Industry Revenue Million Forecast, by End User 2019 & 2032
- Table 126: Global Piezoresistive Pressure Sensor Industry Volume K Unit Forecast, by End User 2019 & 2032
- Table 127: Global Piezoresistive Pressure Sensor Industry Revenue Million Forecast, by Country 2019 & 2032
- Table 128: Global Piezoresistive Pressure Sensor Industry Volume K Unit Forecast, by Country 2019 & 2032
Frequently Asked Questions
1. What is the projected Compound Annual Growth Rate (CAGR) of the Piezoresistive Pressure Sensor Industry?
The projected CAGR is approximately 5.80%.
2. Which companies are prominent players in the Piezoresistive Pressure Sensor Industry?
Key companies in the market include Honeywell International Inc, First Sensor AG, Ninghai Sendo Sensor Co Ltd, Kistler Group, BCM Sensor Technologies BVBA, Metallux SA, Impress Sensors and Systems Ltd, BD Sensors GmBH, Pewatron AG, All Sensors Corporation, Rosemount Inc (Emerson Electric Company).
3. What are the main segments of the Piezoresistive Pressure Sensor Industry?
The market segments include Material, End User.
4. Can you provide details about the market size?
The market size is estimated to be USD XX Million as of 2022.
5. What are some drivers contributing to market growth?
; Rising Emphasis on Miniaturization of Equipment; Need for Robust Design and Enhanced Performance in Rugged Environment.
6. What are the notable trends driving market growth?
Automotive Industry is Expected to Significantly Drive the Market Growth.
7. Are there any restraints impacting market growth?
; Technical Issues associated with the involvement of Smaller Components.
8. Can you provide examples of recent developments in the market?
N/A
9. What pricing options are available for accessing the report?
Pricing options include single-user, multi-user, and enterprise licenses priced at USD 4750, USD 5250, and USD 8750 respectively.
10. Is the market size provided in terms of value or volume?
The market size is provided in terms of value, measured in Million and volume, measured in K Unit.
11. Are there any specific market keywords associated with the report?
Yes, the market keyword associated with the report is "Piezoresistive Pressure Sensor Industry," which aids in identifying and referencing the specific market segment covered.
12. How do I determine which pricing option suits my needs best?
The pricing options vary based on user requirements and access needs. Individual users may opt for single-user licenses, while businesses requiring broader access may choose multi-user or enterprise licenses for cost-effective access to the report.
13. Are there any additional resources or data provided in the Piezoresistive Pressure Sensor Industry report?
While the report offers comprehensive insights, it's advisable to review the specific contents or supplementary materials provided to ascertain if additional resources or data are available.
14. How can I stay updated on further developments or reports in the Piezoresistive Pressure Sensor Industry?
To stay informed about further developments, trends, and reports in the Piezoresistive Pressure Sensor Industry, consider subscribing to industry newsletters, following relevant companies and organizations, or regularly checking reputable industry news sources and publications.
Methodology
Step 1 - Identification of Relevant Samples Size from Population Database


Step 2 - Approaches for Defining Global Market Size (Value, Volume* & Price*)

Note*: In applicable scenarios
Step 3 - Data Sources
Primary Research
- Web Analytics
- Survey Reports
- Research Institute
- Latest Research Reports
- Opinion Leaders
Secondary Research
- Annual Reports
- White Paper
- Latest Press Release
- Industry Association
- Paid Database
- Investor Presentations

Step 4 - Data Triangulation
Involves using different sources of information in order to increase the validity of a study
These sources are likely to be stakeholders in a program - participants, other researchers, program staff, other community members, and so on.
Then we put all data in single framework & apply various statistical tools to find out the dynamic on the market.
During the analysis stage, feedback from the stakeholder groups would be compared to determine areas of agreement as well as areas of divergence
